DOI:
10.1039/C6RA24017H
(Paper)
RSC Adv., 2016,
6, 104847-104867
Novel insights into multitargeted potential of N′-(4-benzylpiperidin-1-yl)alkylamine derivatives in the management of Alzheimer's disease associated pathogenesis†
Received
27th September 2016
, Accepted 25th October 2016
First published on 27th October 2016
Abstract
In response to the molecular complexity of AD, the strategy of multi-target directed ligand (MTDL) holds great potential in modulating different targets involved in the neurodegenerative cascade of AD. In this context, there is a need for the use of privileged scaffolds for discovering potential multifunctional agents for AD treatment. Our group have previously reported a novel series of benzyl piperazine/piperidine based multifunctional agents endowed with in vitro profile appropriate for identifying novel lead candidates with disease-modifying potential. Herein, we have further made an attempt to decipher some of the key mechanisms behind the multitargeted potential of most active inhibitors (5h and 5k) and their characterization for anti-Alzheimer effects. In the present study, investigation of compounds 5h and 5k through CD experiments confirmed their ability in preventing β-sheet aggregation and fibril formation. Morphological visualization in TEM suggested that test inhibitors may interfere with rate of peptide nucleation, leading to short fibrillar aggregates. ThT based fluorimetric assay further demonstrated that 5h and 5k inhibited AChE-mediated Aβ fibrillogenesis via their interaction with the AChE peripheral anionic site. Molecular docking and simulations studies indicated that these compounds could potentially bind to Aβ by inhibiting the toxic conformation of Aβ1–42 and stabilizing the α-helical content. Furthermore, compounds exerted neuroprotective action on SH-SY5Y cells towards Aβ and H2O2-mediated cell death and oxidative injury by inhibiting ROS generation. Moreover, administration of 5h and 5k (5 mg kg−1), significantly reversed scopolamine-induced neurobehavioral, biochemical, neurochemical and histopathological changes in a manner comparable to standard drug donepezil. Together, the present findings provide novel insights into disease-modifying potential of benzylpiperidine derivatives towards the management of AD.
1. Introduction
Alzheimer's disease (AD) is recognized as one of the most severe conditions affecting the elderly population. It is a progressive neurodegenerative disorder of the brain, which is characterized by neuronal loss, synaptic damage, and vascular plaques. At present, AD affects about 37 million people worldwide with the number of patients doubling every 20 years as a consequence of increase in the average age of population, greater life expectancy and improved health care services.1 During past few decades, substantial efforts have been made in understanding the pathogenic mechanisms of AD, but the precise etiology of this disease is still enigmatic and considered to be complex and multifactorial in nature. There are diverse pathological factors that seem to play significant role in development of AD, these are aberrations of brain neurotransmitter levels, accumulation of extracellular β-amyloid (Aβ) deposits, τ-protein aggregation, upregulated neuroinflammation, oxidative stress and dyshomeostasis of biometals. Brain regions that are associated with higher cognitive functions, particularly the neocortex and hippocampus, are most affected by the characteristic pathology of AD. Abnormal accumulation of misfolded Aβ peptides represents a key feature and is believed to be the triggering mechanism for both the neurodegeneration and cognitive dysfunction in AD.2–4 Among the most abundant forms of Aβ derived from the amyloid precursor protein (APP), the 42 amino acid form i.e. Aβ1–42, has a higher tendency to assemble into a variety of oligomeric and fibrillar complexes compared to Aβ1–40 peptide.5 It is believed that this particular peptide mainly comprises the predominant portion of Aβ plaques in AD patients.6,7 The progressive accumulation of these toxic Aβ1–42 aggregates over a period of time significantly contribute towards downstream pathologies such as tangle formation, oxidative damage, energy failure and neuronal apoptosis in AD.8,9 Many studies have confirmed the pathophysiological consequences of Aβ neurotoxicity both via in vitro10 and in vivo models.11
Oxidative damage is one of the earliest events in the onset and progression of AD major pathological hallmarks.12,13 It has been reported that the accumulation of oligomeric form of Aβ, a potent generator of reactive oxygen species (ROS) and reactive nitrogen species (RNS) serves as a source of oxidative stress for vulnerable neurons affected by AD.14,15 In addition, growing evidence indicates that free radical generation plays a major role in the cognitive dysfunction observed in AD patients.16 Therefore, inhibition of Aβ aggregation and toxic free radicals in brain are currently viewed as potential targets for AD therapy.17 The number of therapeutic options currently available for AD treatment such as group of AChEIs (e.g. donepezil, rivastigmine and galantamine) remains severely narrow and provide only minimal symptomatic relief rather than altering the disease progression.18 Therefore, the development of novel AChE inhibitors with improved biological profiles continues to be of great interest to medicinal chemists.
Over the last few decades, the multi-target-directed ligands (MTDLs) strategy has gained considerable attention in AD drug research for addressing the multifaceted nature of AD. Designing of such ligands usually involves molecular hybridization of distinct pharmacophores in a single molecule that can simultaneously hit multiple targets involved in the neurodegenerative cascade of AD.19,20 In recent years, a number of MTDLs acting on very diverse targets have been developed by many research groups21–24 and the results obtained seems to be encouraging as some of these drug candidates have reached to pre-clinical stages in AD drug development.25
Piperazine and piperidine scaffolds are one of the most extensively used backbones in the field of neuropharmaceuticals. These nitrogen containing heterocycles are the most abundant and integral scaffolds with a broad spectrum of biological activities.26,27 A large number of studies have shown successful examples of these derivatives as versatile drug candidates in modern drug discovery programme. Therefore to address the molecular complexity of AD, there is a need to give impetus for the use of these privileged scaffolds to discover new multifunctional agents.
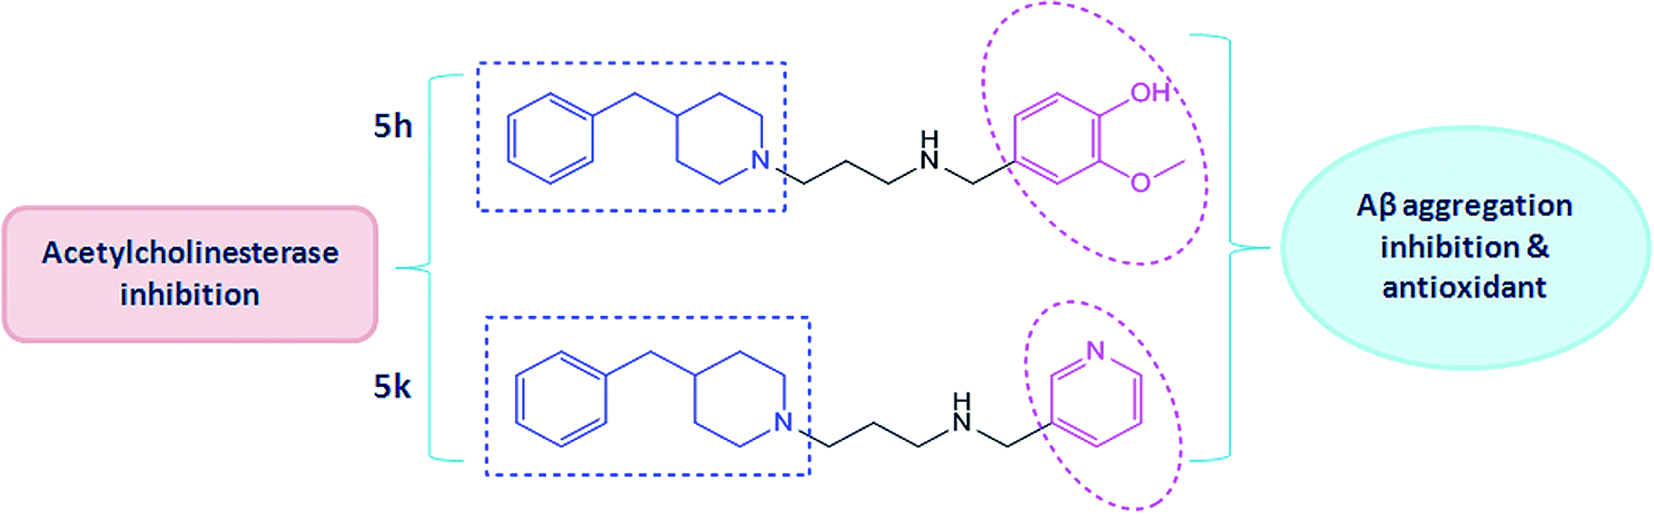
In this connection, we have previously reported the rational design and synthesis of a novel series of N′-(4-benzylpiperidin-/piperazin-/benzhydrylpiperazin-1-yl)alkylamine derivatives based on the MTDL approach of drug discovery.21 These derivatives were synthesized and evaluated for their multitargeted profile towards important biological targets of AD which mainly included cholinesterases (AChE and BuChE) inhibition, kinetics of enzyme inhibition, anti-oxidative effects and their effects on Aβ aggregation inhibition. Based on these findings, two benzylpiperidine derivatives (5h and 5k) were identified as promising lead molecules (Fig. 1) which could be investigated for pharmacological development in AD therapy. Therefore, in the present study, we have further made an attempt to explore some of the underlying mechanisms behind their multitargeted potential. The study design included evaluating effects of targeted compounds (5h and 5k) for their anti-amyloidogenic activities such as the inhibitory activities towards Aβ self-oligomerization and AChE-mediated Aβ aggregation by means of different biophysical and biochemical methods. The mechanism of action responsible for these activities has been discussed here by employing docking and molecular dynamics simulations. In addition, the neuroprotective potential of these compounds were examined against different toxic insults for instance, Aβ-mediated cell death and H2O2-induced toxicity in human SH-SY5Y neuroblastoma cells. Moreover, anti-amnesic effect of compounds (5h and 5k) were explored in detail using various behaviour, biochemical and neuropathological measures in scopolamine model of memory impairment. Also, we examined how these effects were related to the different neurotransmitter systems and to the antioxidant effects in order to elucidate the biochemical mechanisms of their anti-amnesic potential.
 |
| | Fig. 1 Chemical structures of test compound 5h [(4-(3-(4-benzylpiperidin-1-yl)propyl)amino)methyl)-2-methoxyphenol] and compound 5k [(2-(4-benzylpiperidin-1-yl)-N-(pyridin-3-ylmethyl)ethanamine)]. | |
2. Results and discussion
2.1. Effect on Aβ β-sheet formation by compounds 5h and 5k
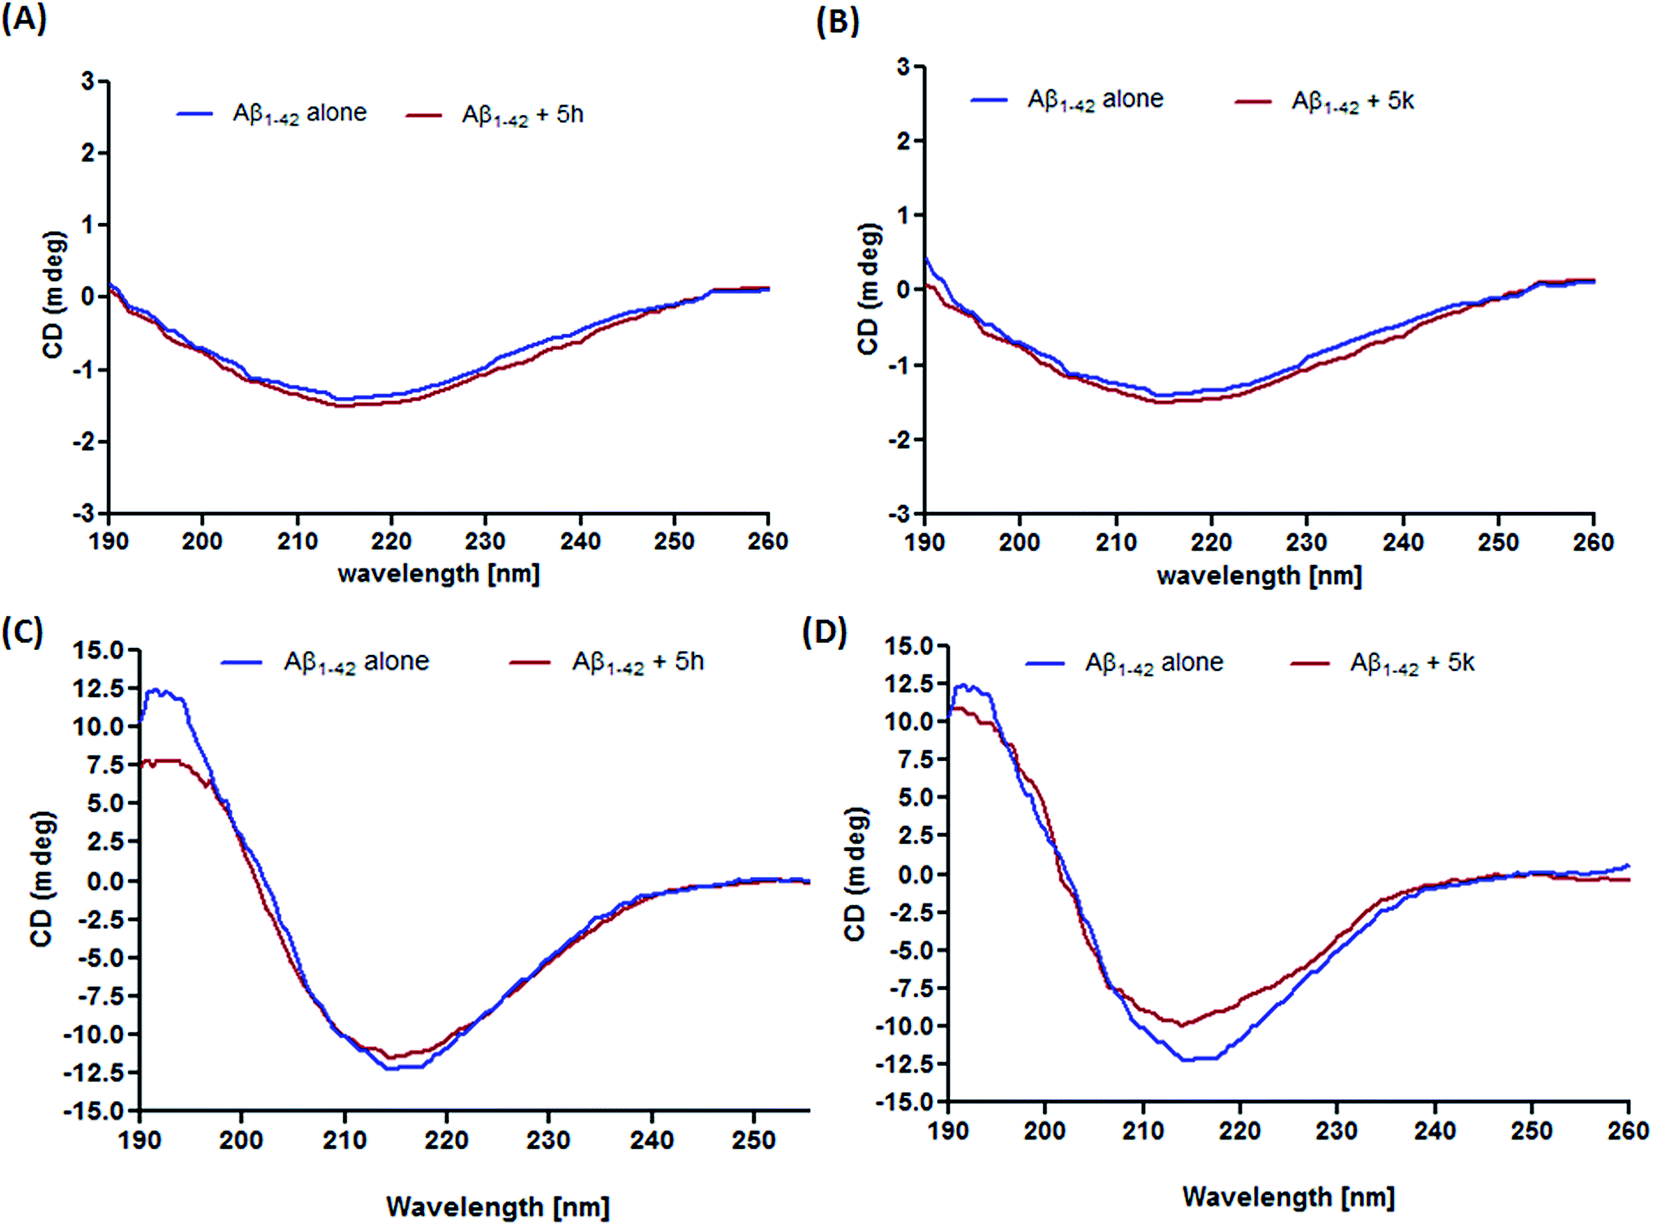
The current leading hypothesis in AD has suggested that accumulation of Aβ peptide is the major triggering factor in disease pathogenesis. Amyloid plaques are mainly composed of Aβ peptides that aggregate after structural modifications. It has been reported that during fibrillization process, Aβ1–42 undergoes conformational change and form a mixture of α-helix, β-sheet, and random coil in the aqueous solution.28 On this premise, finding small molecules that ubiquitously reduce the propensity of Aβ peptides towards aggregation is therefore considered a promising therapeutic approach in AD drug development.29 In our previous report, we have demonstrated that compounds 5h and 5k were able to reduce the binding of thioflavin T (ThT) to aggregated Aβ1–42 by interfering with Aβ self-oligomerization, thus behaving as an inhibitors of Aβ fibrilization. In the present study, CD spectroscopy is further employed to obtain information about the mechanism of action of these inhibitors in preventing conformational changes in Aβ1–42 peptide. As shown in Fig. 2A and B, there was no aggregation of freshly prepared Aβ1–42 sample before incubation which indicates unfolded peptide structure. After 3 days of incubation, prevalence of β-sheet secondary structure is clearly indicated by the appearance of a positive band at 195 nm and a negative band at 217 nm in the CD spectrum (Fig. 2C and D).30 However, in the CD spectrum of compound 5h (Fig. 2C), we observed a slight change in the intensity of band around 217 nm, but there appears a considerable decrease in the band intensity around 195 nm which clearly indicated decrease in β-sheet content of Aβ1–42 peptide after incubation period of 3 days. Notably, the addition of compound 5k decreased the absorbance at both 195 nm and 217 nm (Fig. 2D). These results revealed that test compounds could reduce the β-sheet structure formation thereby hampering further aggregation into mature fibrils.
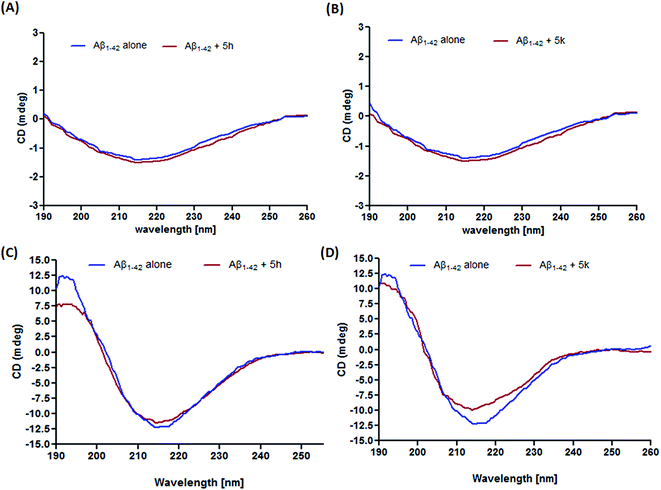 |
| | Fig. 2 CD spectroscopy of Aβ1–42 alone or with compounds 5h and 5k incubated for 0 h (A and B) and 3 days (C and D). | |
2.2. Inhibition of Aβ1–42 fibril formation monitored by TEM
In order to complement the findings obtained from ThT binding assay (performed in our earlier study) and CD assay, TEM analysis was performed with test compounds 5h and 5k to monitor their ability to inhibit Aβ aggregation process. As shown in Fig. 3, following incubation at 37 °C for 24 h, a large number of characteristic fibrillar aggregates were observed in the control sample of Aβ1–42 alone (Fig. 3B). In contrast, only fewer and shorter aggregates were visible in the electron micrographs of Aβ1–42 samples after incubation with the test compounds (Fig. 3C and D) under the same experimental conditions as compared to standard curcumin (Fig. 3E). The TEM results were consistent with the results of ThT and CD studies, which further confirmed that these compounds could effectively inhibit and slow down the rate of Aβ1–42 fibrils formation in vitro.
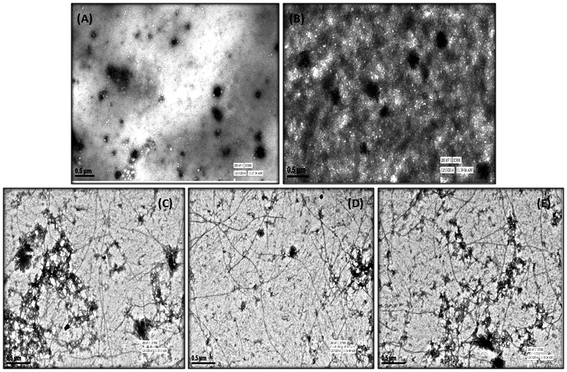 |
| | Fig. 3 TEM image analysis of Aβ1–42 aggregation in the presence of 5k and 5h. (A) Aβ1–42 (25 μM), 0 h. (B) Aβ1–42 alone (25 μM) was incubated at 37 °C for 24 h. (C) Aβ1–42 (25 μM) and 5h (25 μM) were incubated at 37 °C for 24 h. (D) Aβ1–42 (25 μM) and 5k (25 μM) were incubated at 37 °C for 24 h. (E) Aβ1–42 (25 μM) and curcumin (25 μM) were incubated at 37 °C for 24 h. | |
2.3. In silico studies
Over the past few years, a growing number of theoretical studies have been carried out to analyze the interactions of Aβ with antiaggregation molecules using computational methods.31 The combined approach involving docking and MD simulation, provides informative means for the assessment of candidate interactions in the design of effective Aβ aggregation inhibitors.32 Therefore, in current investigation we have successfully implemented these in silico approaches to gain insights into the binding behaviour and conformational changes between test compounds and Aβ1–42.
2.3.1. Docking study of possible conformations of 5h and 5k with Aβ1–42 peptide. The neurotoxicity of amyloid peptide is associated with formation of β-sheet structures that subsequently act as seeds for nucleation and fibrils formation.33,34 Thus, molecules that could prevent the conformational transition from initial random coil or α-helix into β-sheet seems to be intriguing for AD therapeutic development. The process of β-sheet conformational changes during fibrillogenesis is mainly stabilized by hydrophobic interactions and a salt bridge between Asp23/Glu22 and Lys28 residue in Aβ1–42.35 Besides, Met35 residue has been shown to be a critical residue in Aβ1–42-mediated oxidative stress and neurotoxicity.36 Therefore, to study the interaction mode of test compounds towards Aβ, a molecular docking study was employed using AutoDock 4.2 program. As shown in Fig. 4, both the compounds are located in the vicinity of Aβ1–42 C-terminal and mainly establishes non-polar interactions with the side chains of important hydrophobic residues such as Ile31, Met35, Ile41, Ala42 and Val25. The benzylpiperidine moiety in both the compounds appeared to act as an anchor through hydrophobic interactions with Ile41 and Ala42. A hydrogen bond interaction was observed between the OH group of vanillyl moiety in 5h and the backbone NH group of Lys28, with average distance of 2.6 Å (Fig. 4C). In case of compound 5k, hydrogen bond was formed between nitrogen atom of pyridine ring and hydrogen of amino group of Lys28, at a close distance of 3.1 Å (Fig. 4D). In addition, the positively charged nitrogen atom present on residue Lys28 was also found to be engaged in cation–π interaction with the substituted benzyl ring in both 5h and 5k, thereby further strengthening the stability of the Aβ1–42-inhibitor complex. Overall these results indicated that benzylpiperidine derivatives might prevent Aβ aggregation by directly interacting with residue Lys28 and thus blocking the structural conversion responsible for Aβ fibrillogenesis.
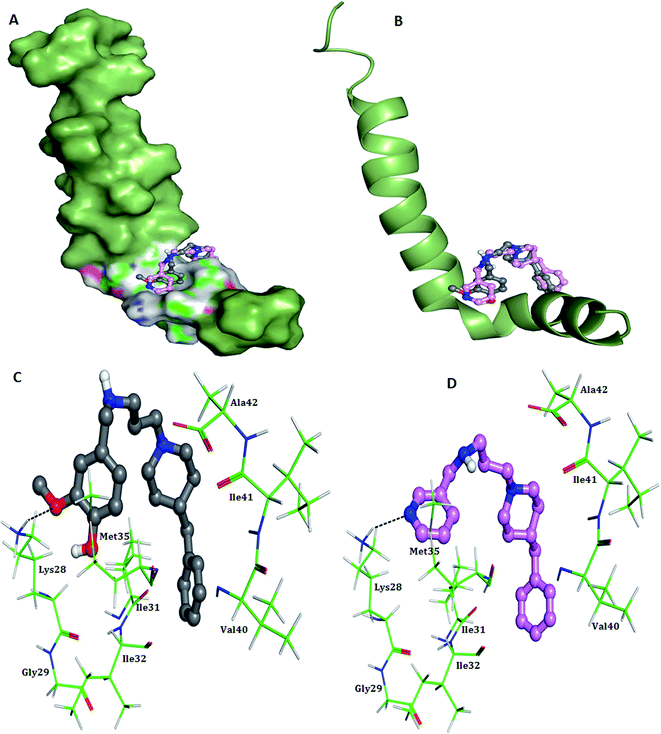 |
| | Fig. 4 Docking studies of 5h (colored gray) and 5k (colored pink) with monomeric Aβ1–42 (PDB code 1IYT). (A) Surface representations of 5h and 5k interacting with Aβ1–42 in one possible binding conformation near the C-terminus (B) cartoon representations of 5h and 5k interacting with Aβ1–42. (C) Association of 5h (colored gray) and the C-terminus of Aβ1–42 obtained from docking calculations. The hydrogen-bonding interaction between the ligand and residue Lys28 is indicated by the black line. (D) Association of 5k (colored pink) and the C-terminus of Aβ1–42 obtained from docking calculations. The hydrogen-bonding interaction between the ligand and residue Lys28 is indicated by the black line. | |
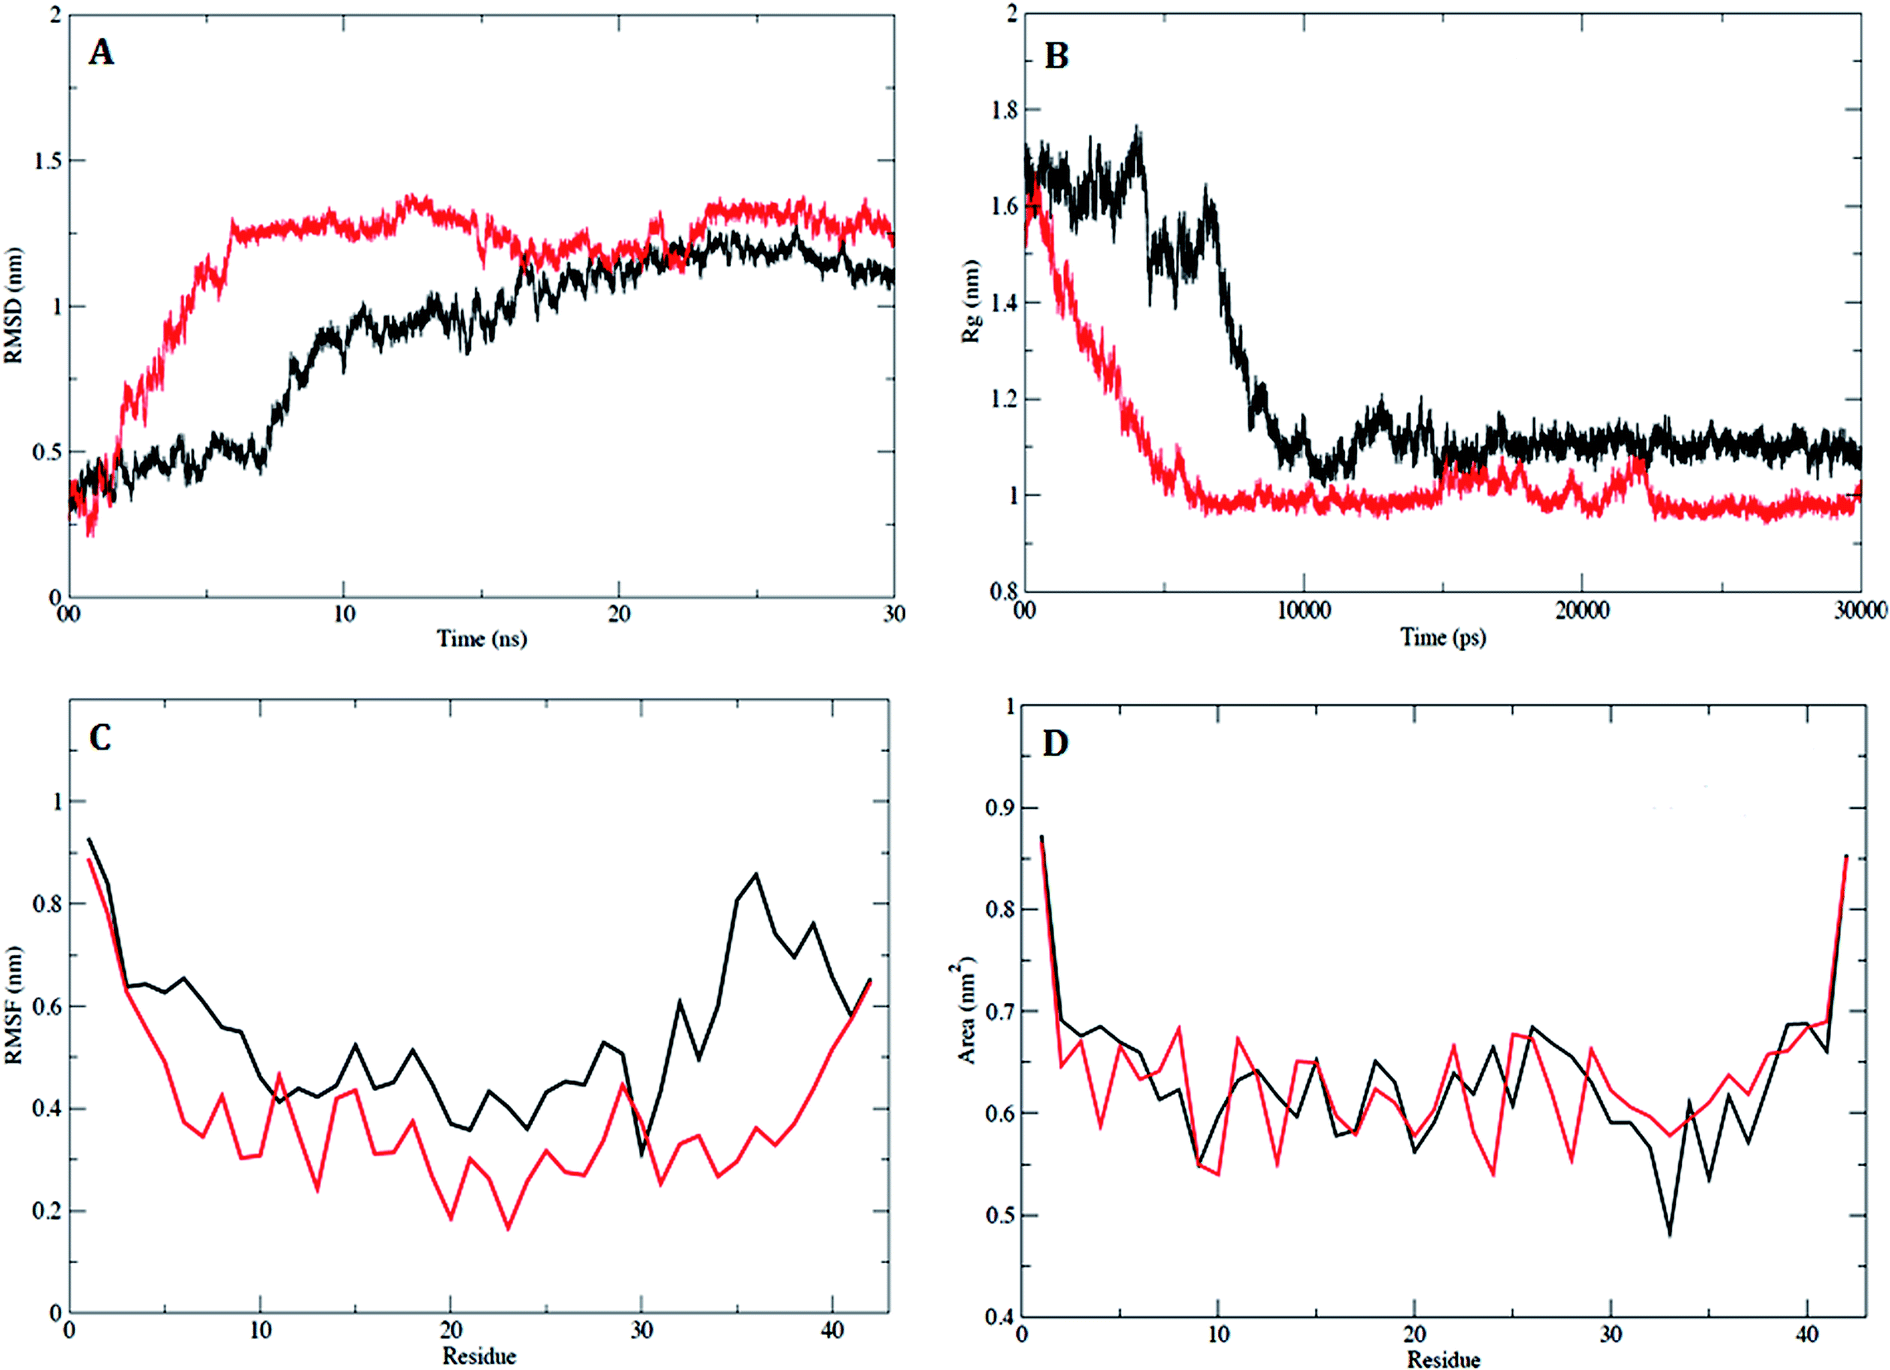
2.3.2. MD simulation studies of the compound 5h and Aβ1–42 peptide complex. In order to examine the dynamic stability of the docked complex of Aβ1–42–5h during MD simulations, the data trajectory was collected over a simulation period of 30 ns. The trajectories of RMSD showed a stable conformation which was maintained throughout the simulation time of 30 ns (Fig. 5A). Aβ1–42 attained a stable equilibrium in 10 ns, with the initial drift of ∼0.5 nm. A minor transition in trajectory was observed after 15 ns, which was recurring up to 20 ns with drift of 0.2 nm. However, rest of the trajectory attained the stability after 20 ns, and an equilibrium was continuously maintained up to end of simulation time. The RMSD plot of Aβ1–42–5h complex shows a significant drift of ∼0.8 nm at 6 ns (Fig. 5A), which indicates the conformational alteration in Aβ1–42 due to spatial arrangement of 5h in the binding site. The amino acid trajectory for Aβ1–42 became stable after 15 ns with deviation of 0.2 nm and finally, it sustained a stable conformation throughout the simulation time of 30 ns. The magnitude of fluctuation with a minor change in average RMSD value of Cα backbone atoms strongly suggests the stable dynamic behaviour of Aβ1–42–5h complex.
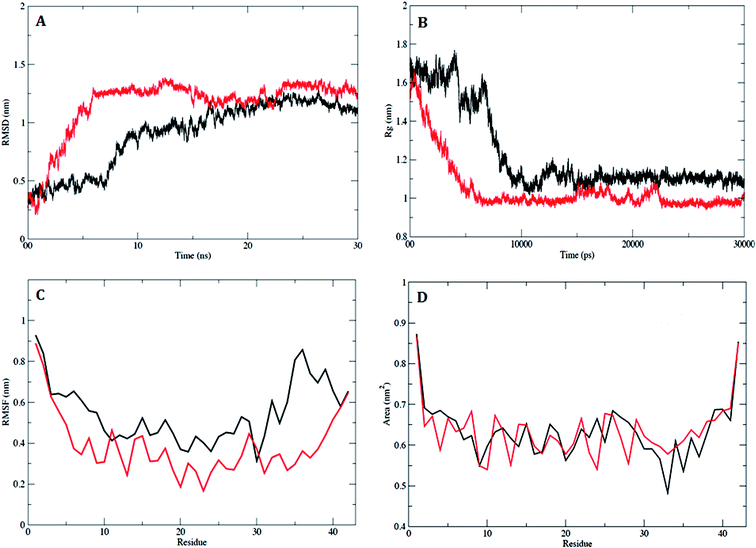 |
| | Fig. 5 Analysis of RMSD, Rg, RMSF and SASA. (A) Plot of time vs. RMSD trajectory of Aβ1–42 (black) and Aβ1–42–5h complex (red). (B) Time evolution of radius of gyration (Rg) values for Aβ1–42 (black) and Aβ1–42–5h complex (red) during 30![[thin space (1/6-em)]](https://www.rsc.org/images/entities/char_2009.gif) 000 ps (30 ns) of MD simulation. (C) RMSF plot for Aβ1–42 (black) and Aβ1–42–5h complex (red). (D) Solvent accessible surfaces area (SASA) plot for Aβ1–42 (black) and Aβ1–42–5h complex (red). 000 ps (30 ns) of MD simulation. (C) RMSF plot for Aβ1–42 (black) and Aβ1–42–5h complex (red). (D) Solvent accessible surfaces area (SASA) plot for Aβ1–42 (black) and Aβ1–42–5h complex (red). | |
In addition, the radius of gyration (Rg) was calculated in order to measure the compactness, shape and folding of overall Aβ1–42 peptide structure at different time points. The average calculated value of Rg from the trajectory is shown in Fig. 5B. In case of Aβ1–42, a stable Rg value of 1.1 nm was maintained over the course of 30 ns. The average Rg value of 1.0 nm for Aβ1–42–5h complex showed the stable interaction with very small drift of 0.1 nm from 15000 ps to 22000 ps and rest of the trajectory attained stable equilibrium till the end of simulation time. The comparative decrease in Rg (0.1 nm), lead to increase in compactness of Aβ1–42, which suggests that, the binding of 5h may enhance the Aβ1–42 stability. To understand the effect on flexible regions of peptide, the average position fluctuation of amino acid residues in a dynamic system was analyzed with RMSF of all Cα atoms. Fig. 5C clearly depicts residues belonging to stable secondary structure conformation have attained stable fluctuation. Furthermore, result indicates that binding of 5h lead to decrease fluctuation of active site residues. This observation suggested that Aβ1–42 was more accurately sustained in the presence of 5h and specifies the consistency with RMSD and Rg data. To understand the effect of binding site residues involved in interaction with inhibitor 5h, we assessed the solvent accessible surface area (SASA) of the Aβ1–42. As illustrated in Fig. 5D, binding of 5h reduces the hydrophobicity of Aβ residues thus providing inhibition to Aβ1–42 aggregated assembly. The dynamic behaviour was found to be less pronounced in case of complex Aβ1–42–5h during a simulation period of 30 ns. Similarly, the RMSD, Rg, RMSF and SASA values of the docked complex of Aβ1–42–5k were also calculated for the entire MD simulation (result not shown).
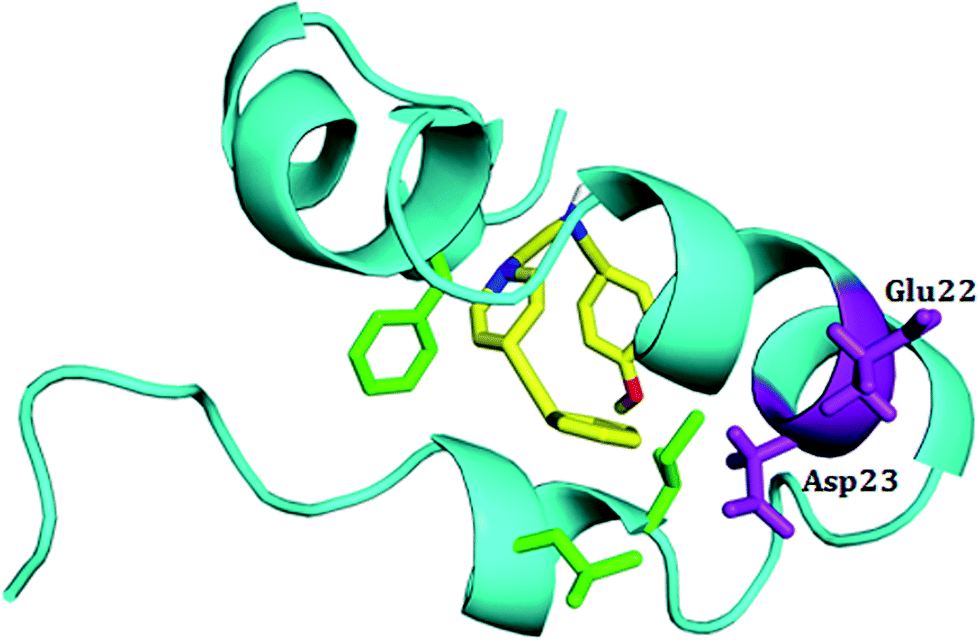
To characterize the effect of 5h on the conformational transition of Aβ1–42 monomer, the time dependence secondary structure for Aβ1–42–5h complex was calculated by using the STRIDE program of VMD tools.37 During the simulation, a significant decrease of helical forms was observed for wild type Aβ1–42 monomer (Fig. 6A). While in Aβ1–42–5h complex, the content of α-helix structure at the N-terminus of Aβ1–42 slowly decreases, but the residues 10–21 attain α-helix structure during the whole simulations (Fig. 6B). In the C-terminus of Aβ1–42, residues 37–41 converts into 3-10 helix and coil structure after 2 ns. This region adopts 3-10 helix structure initially and at the end of simulation it regains to turn structure majorly (Fig. 6B). Residues 31–35 on C-terminus adopt α-helix during the simulations time. Overall, for Aβ1–42–5h complex, most of the residues from C-terminus of Aβ1–42 adopt helix structure (α-helix, 3-10 helix), which confirms Aβ aggregation modulating activity of 5h. Moreover, experimental findings from the solid state NMR studies have identified the presence of turn or bend structures in Aβ42 aggregates in addition to β-sheets.38 Based on these observations, the formation of toxic conformers with the turn at positions 22 and 23 have been suggested to be important for the neurotoxicity and oligomerization of Aβ42.39 Therefore, we also investigated the effect of compound 5h on the formation of toxic turn in the Aβ1–42 monomer. As illustrated in Fig. 7, interaction of 5h prevented the formation of toxic conformer as indicated by α-helix content which was found to be highly preserved including residues Glu22 and Asp23.
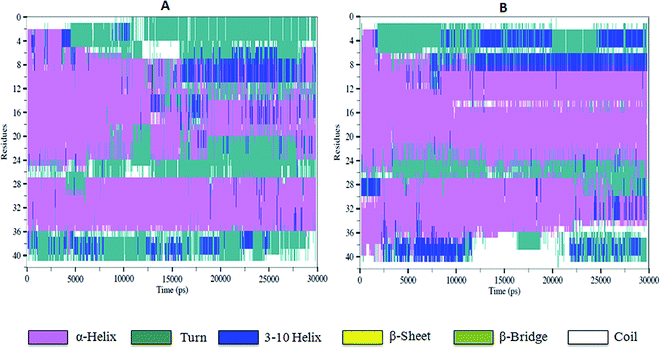 |
| | Fig. 6 The time evolution of secondary structure of wild type Aβ1–42 monomer (A), and the complex 5h–Aβ1–42 (B). | |
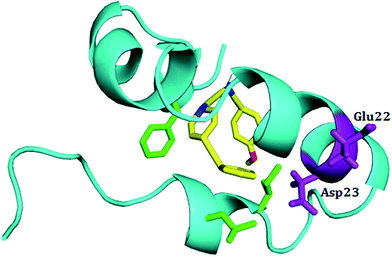 |
| | Fig. 7 Structural conformations of complex 5h–Aβ1–42 monomer. In the presence of inhibitor 5h the toxic conformer is not present. The Aβ1–42 monomer is shown in cyan ribbon, and compounds 5h is shown in yellow. Residues Glu22 and Asp23 are shown in purple sticks. | |
2.4. Inhibition of AChE-induced Aβ aggregation
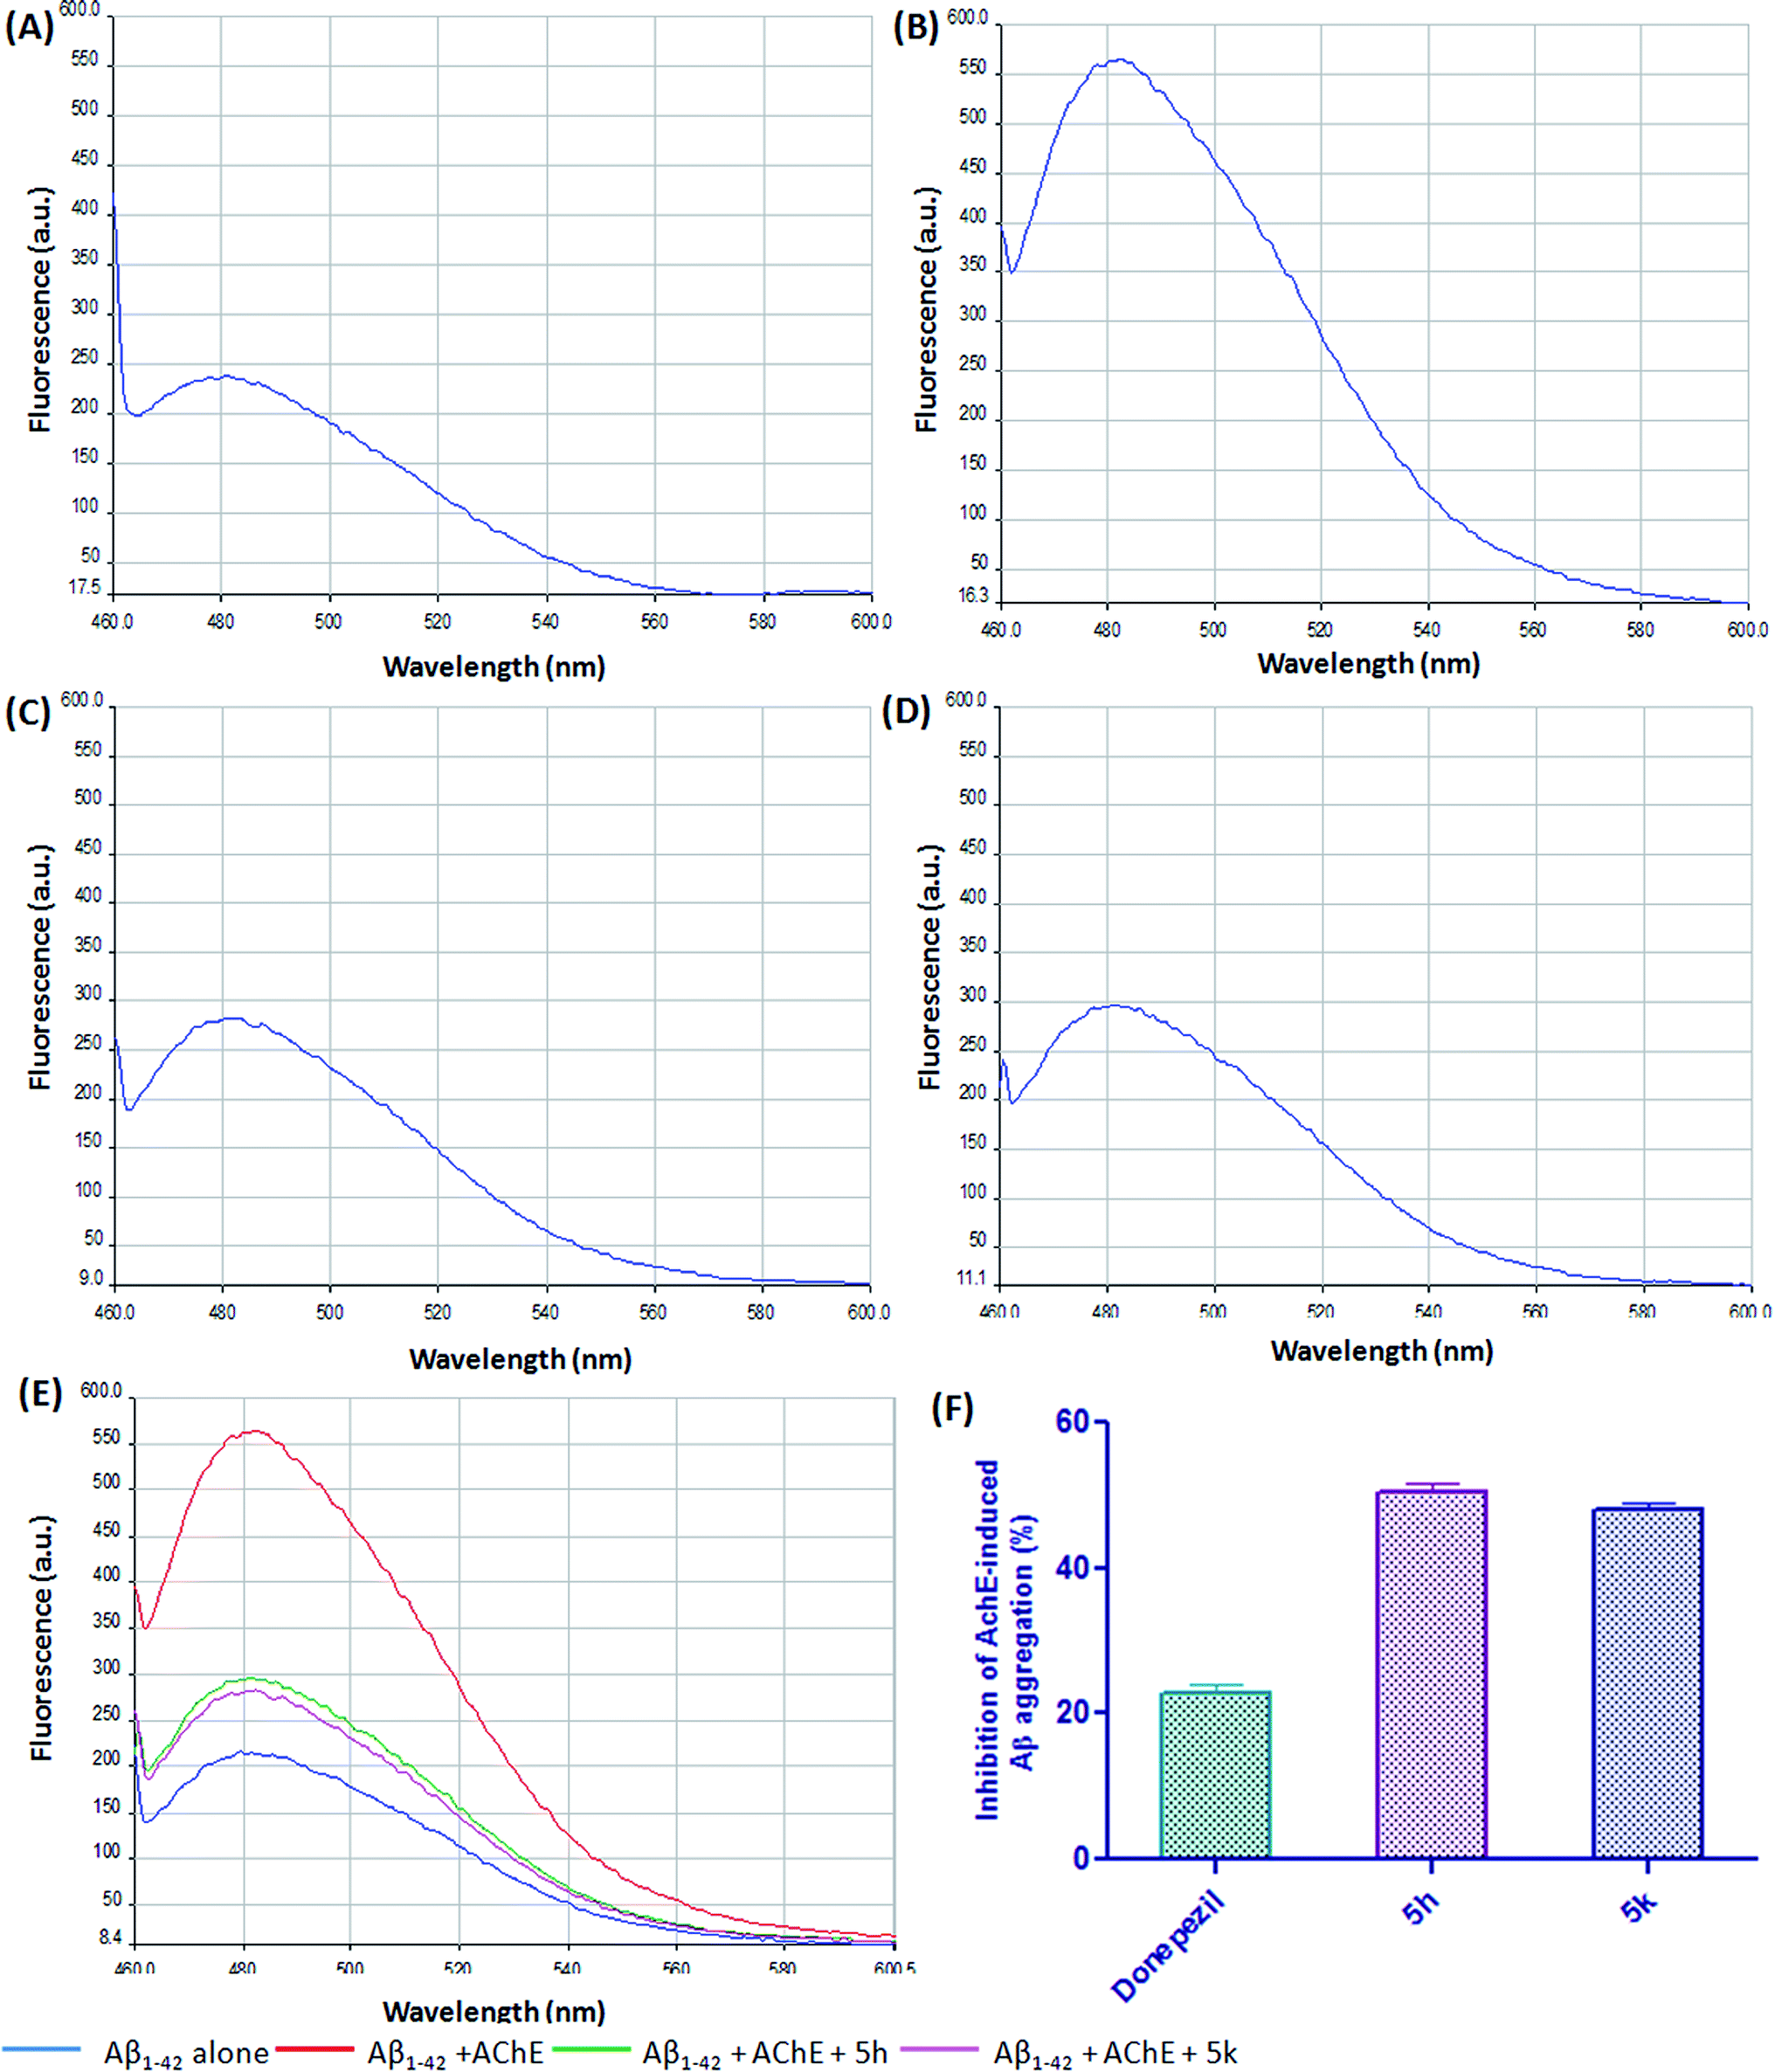
Growing evidences suggested that AChE interacts with Aβ peptide and accelerate its deposition into growing fibrils by forming hydrophobic interactions with the residues present in the peripheral anionic site (PAS) of AChE.40 Therefore, compounds binding to PAS site in addition to the catalytic site has been suggested as a new class of disease-modifying AChEIs for AD treatment. Our previous report has shown that compound 5h and 5k exhibited a mixed-type AChE inhibition as it was able to bind to both the catalytic and peripheral site of AChE.21 Therefore, to further explore the dual inhibitory action, these compounds were assessed for their ability to inhibit the AChE-induced Aβ1–42 aggregation via the ThT fluorescence method. In particular, compounds 5h and 5k were screened at a single concentration and compared with reference compound donepezil. After 24 h incubation, the increase in the intensity of the fluorescence signal of ThT associated with AChE-induced Aβ1–42 aggregation is depicted in Fig. 8. The ThT fluorescence yield was significantly reduced in the presence of compounds 5h (Fig. 8C) and 5k (Fig. 8D). Our results clearly indicated that at a concentration of 25 μM, test inhibitors significantly prevented the AChE-mediated Aβ fibrilization by ∼50% (5h) and ∼47% (5k), respectively (Fig. 8F). The achieved inhibition in case of test inhibitors was higher than standard drug donepezil which revealed that these benzylpiperidine derivatives might have higher affinity for AChE peripheral anionic site. Overall, these results suggested that targeted compounds may have a potential disease-modifying role in AD treatment.
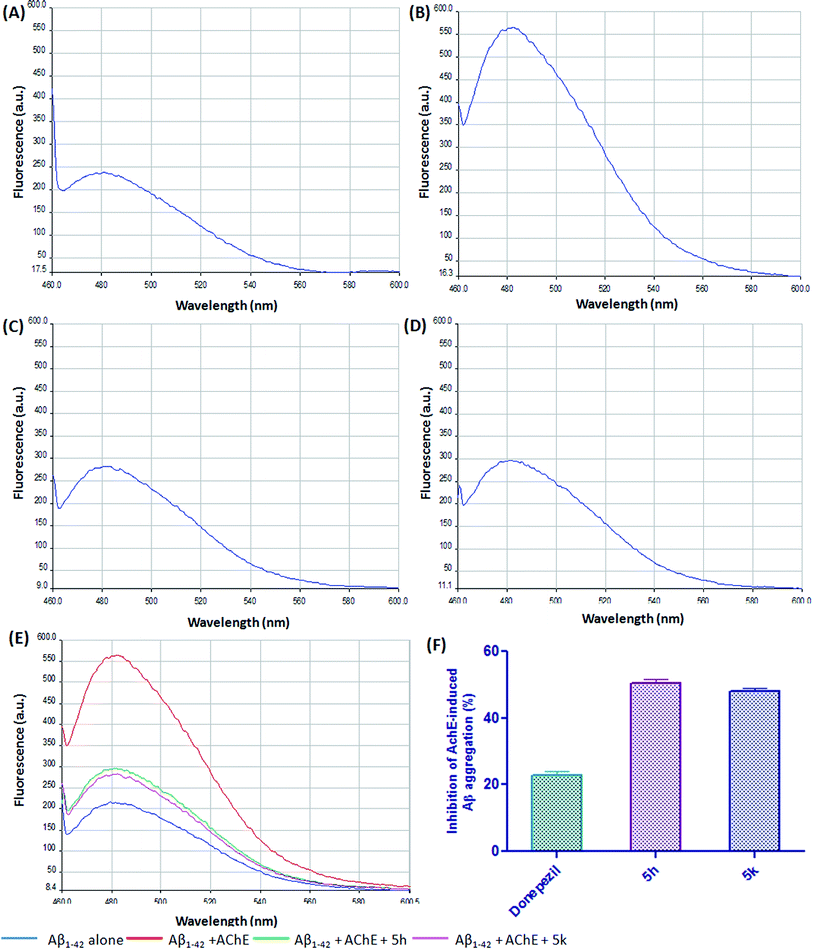 |
| | Fig. 8 ThT emission fluorescence spectra (range 450–600 nm) in the absence of AChE (A) Aβ1–42 alone, and in the presence of (B) Aβ1–42 + AChE, (C) 5h + Aβ1–42 + AChE, (D) 5k + Aβ1–42 + AChE, (E) overlay of ThT emission fluorescence spectra, (F) the inhibitory activity of test compounds to AChE-induced Aβ1–42 aggregation in ThT binding assay. The concentration of Aβ1–42 was 25 μM, and the concentration ratio of Aβ1–42, AChE, compound was 100:1:100. | |
2.5. Cell viability and neuroprotection studies
Next, we examined the potential cytotoxic effects of test compounds on the viability of human neuronal SH-SY5Y cells. This cell line served as well established AD model to study the neurotoxic effects of agents because it mimics some of the important characteristic features of human neuronal cells.41 After treating the cells with varying concentrations of test compounds for 24 h, the cell viability was assessed by employing MTT reduction assay. As shown in Fig. 9A, compounds 5h and 5k demonstrated a dose-dependent effect on the viability of SH-SY5Y cells at different concentration range (1–100 μM). Our results indicated that benzylpiperidine derivatives 5h and 5k did not produce a significant cytotoxic effects on the cells even up to 100 μM concentration after 24 h of treatment. These preliminary findings suggest that these derivatives are non-toxic to cultured neurons and therefore could be further investigated for their neuroprotective profile against different toxic stimuli that leads to neurodegeneration.
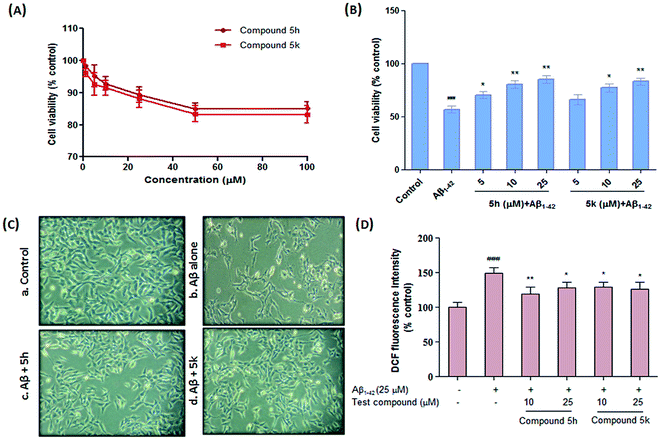 |
| | Fig. 9 Effect of compounds 5h and 5k on Aβ-induced cell death in SH-SY5Y cells. (A) Effects of compounds on cell viability in SH-SY5Y cells. The cells were incubated with the indicated concentrations of the tested compounds for 24 h. The viable cells were assessed by the MTT assay. (B) Protective effects of compounds on Aβ1–42-induced cytotoxicity. The cellular viability was evaluated by MTT assay after treatment with (25 μM) Aβ1–42 in the absence or presence of the indicated concentrations of (5 μM, 10 μM and 25 μM) compounds. (C) Phase-contrast micrographs showing morphological alterations in Aβ1–42-induced apoptotic cell death and neuroprotection by 5h and 5k in SH-SY5Y cells. (a) Control, (b), Aβ1–42 alone, (c), 5h + Aβ1–42 and (d), 5k + Aβ1–42. (D) Effect of compounds on Aβ1–42-induced intracellular ROS accumulation. Quantitative analysis of DCF fluorescence intensity, expressed as % control, as an indication of ROS levels in the Aβ1–42-induced SH-SY5Y cells, treated with or without compounds 5h and 5k. Data are expressed as mean ± SEM of three independent experiments and each included triplicate sets. ###p < 0.001 versus control, *p < 0.05, **p < 0.01 versus Aβ1–42 alone. | |
2.6. Neuroprotective effects of compounds 5h and 5k against Aβ1–42 induced cytotoxicity
Aβ-induced apoptotic neuronal cell death is a critical player in AD pathogenesis. It is believed that 1–42, the most amyloidogenic isoform of amyloid beta peptide self-assembles into variety of oligomeric species that are toxic to neuronal cell culture models. Therefore, the potential therapeutic effect of compounds 5h and 5k against Aβ1–42-induced cytotoxicity were investigated in SH-SY5Y cells at three different test concentrations (5, 10 and 25 μM) (Fig. 9B). Consistent with the previous observations, Aβ1–42 (25 μM) treatment caused significant reduction in cell viability compared to untreated control cells (∼57% of control, p < 0.001). On the other hand, both the test compounds exhibited neuroprotective ability in ameliorating Aβ1–42 induced neurotoxicity as indicated by maintained efficient cell viability at concentrations ranging from 5 to 25 μM (Fig. 9B). Furthermore, protective effect of these compounds were also confirmed through morphological observations using phase contrast microscopy. The photomicrographs showed remarkable changes in the morphology of cells treated with neurotoxic Aβ1–42 peptide as evident by cell loss, shrinkage of cells and disappearance of the neurites (Fig. 9C). However, compounds (5h and 5k) treatment remarkably restored these anomalies in cultured neuroblastoma cells which further supports the neuroprotective potential of these derivatives in preventing Aβ-induced cellular toxicity.
2.7. Effect of compounds 5h and 5k on Aβ1–42-induced intracellular ROS generation
Reactive oxygen species (ROS) are considered to play an important role in Aβ-induced neuronal cell death. Therefore, we evaluated whether test compounds (10 μM and 25 μM) prevent intracellular accumulation of ROS induced by oligomeric Aβ1–42 in SH-SY5Y cells. As illustrated in Fig. 9D, exposure of cells to Aβ1–42 significantly elevated cellular ROS levels by about 2-folds (p < 0.001) compared with control cells. On the other hand, compounds 5h (10 μM, p < 0.01, 25 μM, p < 0.05) and 5k (10 μM, p < 0.05, 25 μM, p < 0.05) provided significant inhibition of Aβ1–42-induced ROS generation in a concentration dependent manner without affecting basal ROS levels. ROS scavenging potential further reflects anti-oxidant profile of these derivatives. However, further study on their detailed antioxidant mechanisms remains to be clarified.
2.8. Cytoprotective effect of compounds 5h and 5k against H2O2-induced cell death
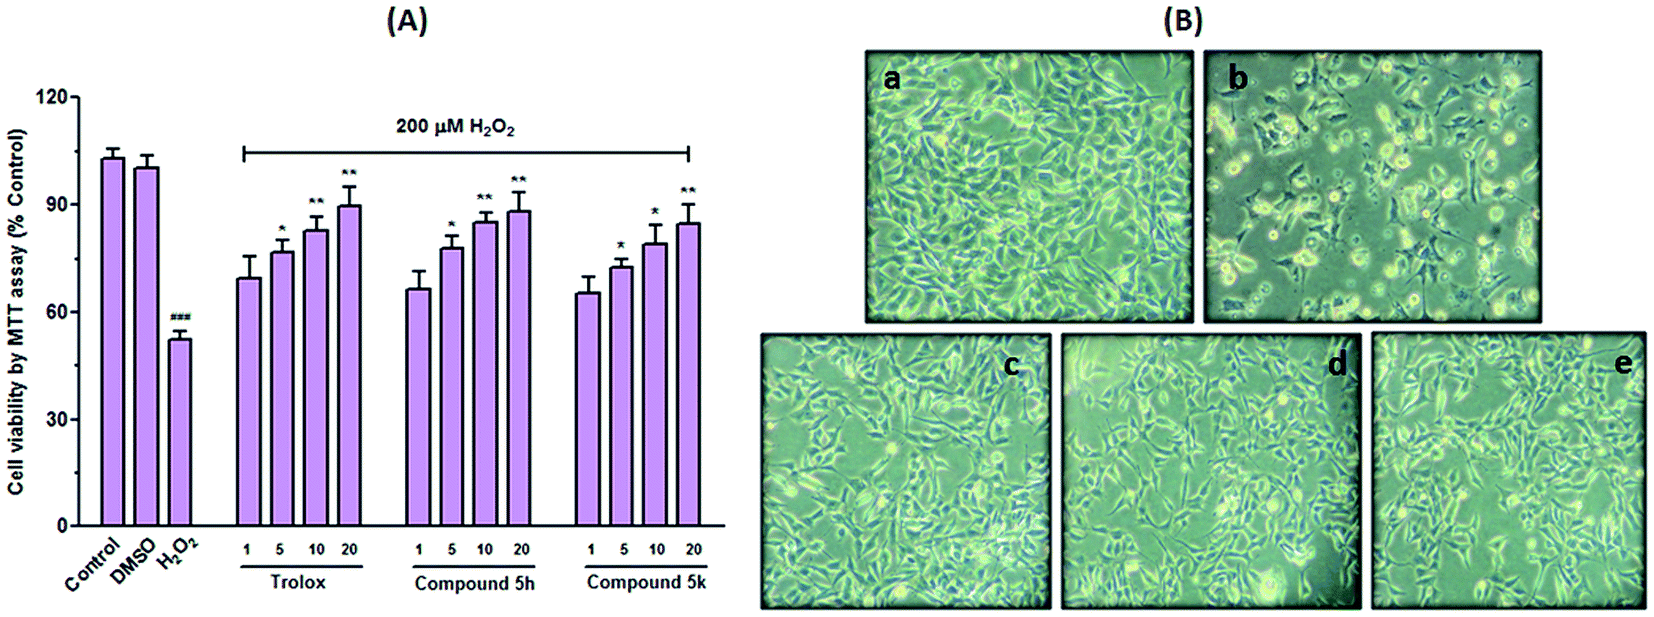
Cell death triggered by H2O2 presumably involves multiple steps following elevation of intracellular free radicals and perturbation of antioxidant defence system. All these events have been implicated in the pathogenesis of both normal ageing and neurodegenerative disease.42 Therefore, compounds 5h and 5k were also examined for their protective ability towards oxidative stress associated cell death induced by hydrogen peroxide (H2O2) in human SH-SY5Y neuroblastoma cells (Fig. 10). In this study, cells were pre-treated with different concentrations of test compounds (1–20 μM) for 24 h prior to the addition of 200 μM H2O2. As depicted in Fig. 10A, exposure of cells to H2O2 (200 μM) decreased cell viability by ∼52% (p < 0.001), compared with untreated control cells. This H2O2 concentration was selected as it correspond to the concentration that causes ∼50% loss in the ability of cells to reduce MTT (data not shown). However, compounds (5h and 5k) treatment significantly prevented cells from H2O2-induced damage as indicated by gradual increase in cell survival with respect to H2O2-stressed cells. The attenuated effect of test compounds was found to be dose dependent (Fig. 10A). Particularly, compound 5h showed higher protective capability better than trolox at the concentration of 10 μM. In addition, morphological alterations in these cells were also assessed by microscopic examination. Cells upon exposure to H2O2 exhibited completely altered morphology as indicated by fewer cell number with shrinked cell body, rounded cellular appearance, membrane blebbing and loss of adherence. All these morphological alterations clearly indicated H2O2 induced neurotoxicity in SH-SY5Y cells. However, 5h and 5k pretreatment mitigated these morphological changes similar to trolox at the tested concentration (10 μM) (Fig. 10B). These results hypothesized that neuroprotective effect of these benzylpiperidine derivatives might be related with their ability to, directly or indirectly, scavenge free radical species.
 |
| | Fig. 10 Neuroprotection against H2O2 toxicity. (A) Compounds 5h and 5k were tested for neuroprotective activity against H2O2 toxicity in SH-SY5Y cells. Trolox was used as the reference compound. Results are expressed as percent viability compared to cells not treated with H2O2. Data represent the mean ± SEM of three independent observations. ###p < 0.001 versus control cells, *p < 0.05, **p < 0.05 versus H2O2 treated cells. (B) Phase-contrast micrographs showing H2O2-induced neurotoxicity and neuroprotection of compounds in SH-SY5Y cells. (a) Cells without compound and H2O2 treatment showed healthy shapes, (b) H2O2 alone (200 μM) induced neurotoxicity, (c–e) compounds 5h, 5k and trolox (10 μM) were given for 24 h with H2O2 (200 μM) at 37 °C and co-treatment showed neuroprotection. | |
2.9. In vivo studies
Impairment of learning and memory, as the most characteristic manifestation of dementia, could be induced chemically in experimental animals by administration of scopolamine, a central muscarinic receptor antagonist known to interfere with ACh transmission in the central nervous system.43 Scopolamine induces dysregulation in cholinergic signalling pathway and memory circuits in the CNS, resulting in serious impairment in learning, acquisition, and short term retention of spatial memory tasks.44 In view of these facts, compounds 5h and 5k were also screened for their cognitive enhancing effect in scopolamine-induced amnesia model.
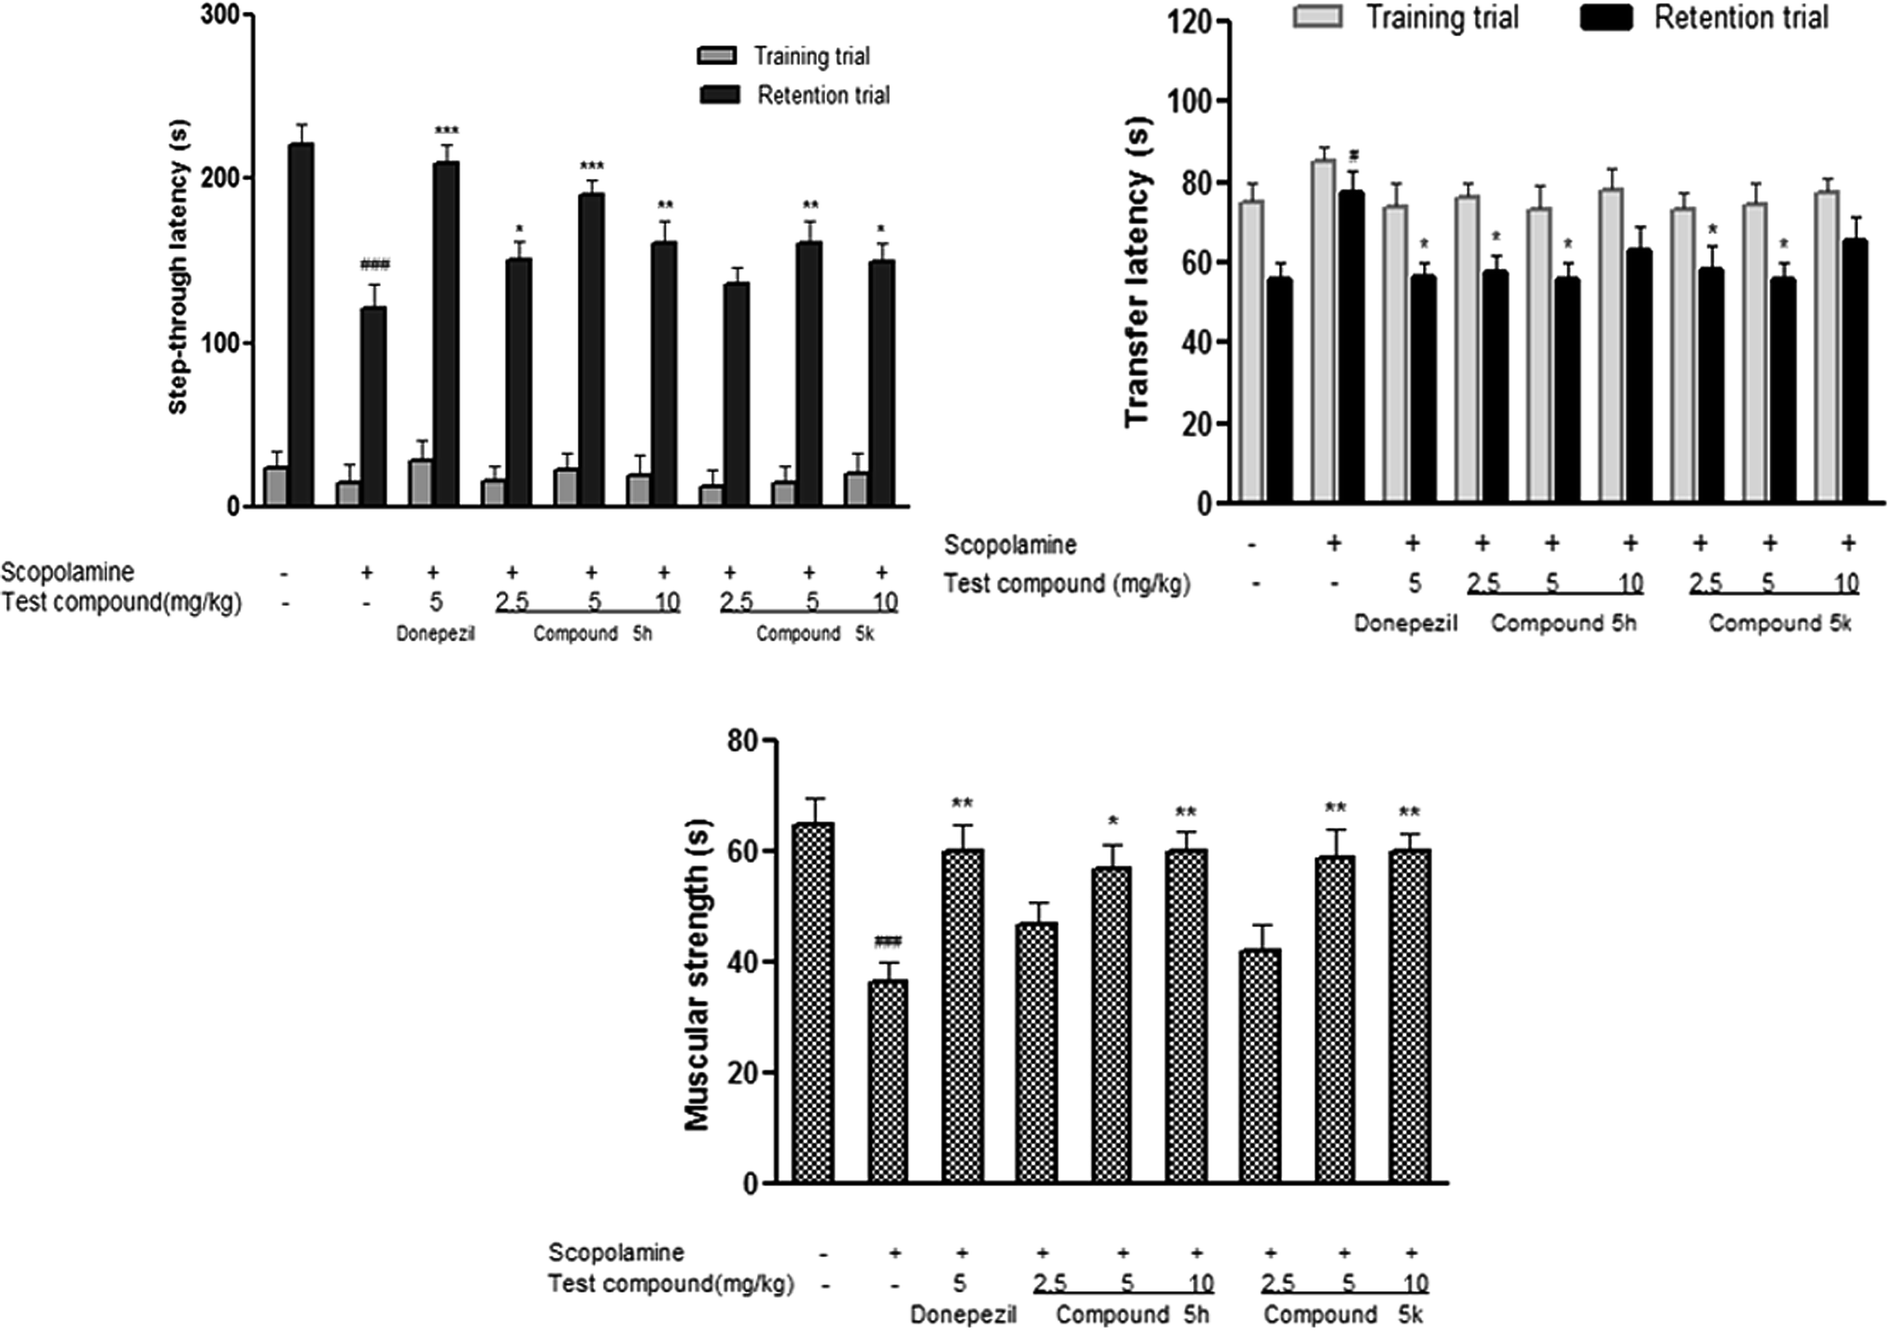
2.9.1. Effect of compounds 5h and 5k on step-through latencies in passive avoidance test. In passive avoidance test, measurement of step-through latency was used as criterion to assess learning and retention in experimental rats. During training trial, no significant differences in latencies were observed among test groups, which indicated that treatment with compounds 5h and 5k do not affect the general behaviour of experimental rats (Fig. 11A). However, scopolamine administration (1.5 mg kg−1) significantly reduced (p < 0.001) step-through latency during retention trial compared with saline treated control group. The decrease in retention latency indicates scopolamine induced memory impairment in passive avoidance task. Treatment with donepezil (5 mg kg−1) significantly prolonged (p < 0.001) the latency time in comparison to scopolamine treated group. Likewise, scopolamine induced memory deficits were successfully reversed by test compounds 5h and 5k as indicated by increased step-through latency with a bell-shaped dose–response curve and the maximum effect was observed at 5 mg kg−1 (p < 0.001, p < 0.01) and 10 mg kg−1 (p < 0.01, p < 0.05) dose level. Overall, our results suggested that benzylpiperidine derivatives 5h and 5k antagonized the scopolamine induced memory deficit in this behavioral model.
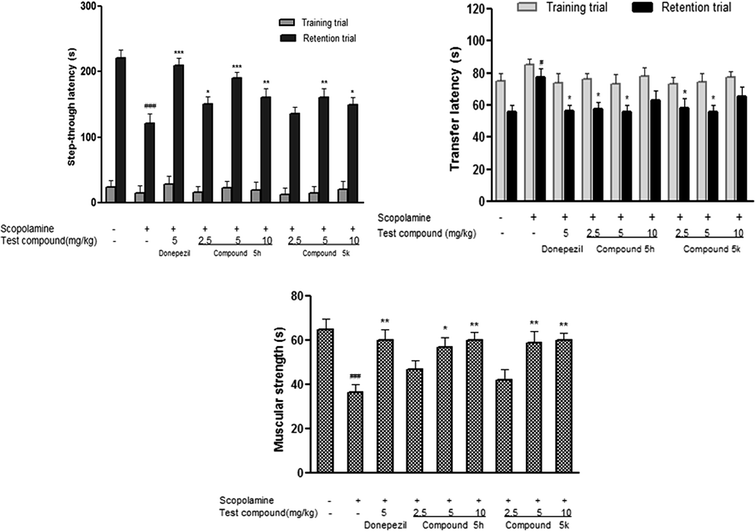 |
| | Fig. 11 Effect of test compounds 5h and 5k on neurobehavioral assays. (A) Treatment effect on the step-through latency (TL) in passive avoidance task in scopolamine induced model. (B) Treatment effect of on the transfer latency (TL) in elevated plus maze task in scopolamine induced model. (C) Treatment effect on the muscle strength and motor coordination in rota rod test in scopolamine induced model. Data are expressed as mean ± SEM of 6 animals. ##p < 0.01, ###p < 0.001 in comparison to untreated control rats, *p < 0.05, **p < 0.01 and ***p < 0.001 in comparison to scopolamine-treated rats. | |
2.9.2. Effect of compounds 5h and 5k on transfer latencies in EPM test. The compounds were also evaluated for antiamnesic activities in rat EPM model. This behavioral model is widely used for assessment of learning and memory that depends upon inherent tendency of rats to stay in closed spaces.45 In training session, no significant difference was found in the transfer latencies between different treatment groups in EPM i.e. all the rats entered the closed arm of the maze within stipulated time period. However, scopolamine treatment (1.5 mg kg−1), significantly increased this transfer latency time in comparison to control group (p < 0.05), indicating impairment of memory during retention trial (Fig. 11B). In contrast, donepezil (5 mg kg−1) treatment showed significant reduction in transfer latency (p < 0.05) which highlighted its ability to reverse memory impairment induced by scopolamine. Furthermore, co-administration of test compounds 5h and 5k significantly reversed the effects of scopolamine. Lower doses of test compounds 5h and 5k (2.5 and 5 mg kg−1) showed significant reductions of transfer latencies (p < 0.05) while higher dose (10 mg kg−1) did not produce any considerable change in transfer latency as compared to scopolamine treated group (Fig. 11B).
2.9.3. Effect of compounds 5h and 5k on muscular coordination in rotarod test. Rotarod test was conducted for evaluating the effect of test compounds (5h and 5k) on muscular strength of rats following scopolamine exposure. Scopolamine (1.5 mg kg−1) administration for a period of 22 days significantly (p < 0.01) impaired rotarod performance and reduced fall off time in scopolamine treated animals in comparison to control group (Fig. 11C). While treatment with donepezil resulted in significant (p < 0.01) improvement in motor coordination performance in experimental rats in comparison to scopolamine group. The test compounds administration 5h and 5k significantly increased fall off time (5 mg kg−1, p < 0.05, p < 0.01 and 10 mg kg−1, p < 0.01, p < 0.01), respectively on accelerating rotarod in a dose dependent manner (Fig. 11C) demonstrating improved grip strength in these animals.
2.10. Biochemical estimations
2.10.1. Effect of compounds 5h and 5k on brain AChE activity. AChE is a key marker of brain cholinergic pathways and its increased activity has been reported in cognitive impairment and behavioral disturbances associated with AD. Thus, inhibition of AChE activity can provide valuable information on cholinergic function. Numerous studies have indicated that scopolamine induces amnesia by increasing AChE activity in the brain, as well as by antagonizing the muscarinic receptor of AChE.46 Accordingly, we also observed increased AChE activity ∼ 83% (p < 0.001) in the brain samples of scopolamine (1.5 mg kg−1) treated animals with respect to normal control group (Fig. 12A). Donepezil (5 mg kg−1) treatment significantly reversed the elevated brain AChE activity by 45% (p < 0.001) compared to the corresponding scopolamine treated group. However, groups treated with test compound 5h (2.5, 5 and 10 mg kg−1) significantly attenuated AChE activity in dose dependent manner by ∼28% (p < 0.05), ∼37%, (p < 0.01) and ∼40% (p < 0.001), respectively, compared with scopolamine group (Fig. 12A). While in 5k treated group, significant reductions were observed only at low dose level of 2.5 mg kg−1 by ∼31% (p < 0.01) and 5 mg kg−1, ∼38% (p < 0.001). Moreover, 5k at the dose of 10 mg kg−1 did not produce any significant effect on the brain AChE activity. The findings of in vivo AChE inhibition further supported the in vitro inhibition potential of these targeted compounds against AChE enzyme.
 |
| | Fig. 12 (A) Effect of test compounds 5h and 5k on brain AChE activity in scopolamine-induced demented rats. (B) Effect of test compounds 5h and 5k on the Aβ1–42 production in scopolamine-induced amnesia model. Data are expressed as mean ± SEM of 6 animals. ##p < 0.01, ###p < 0.001 in comparison to untreated control rats, *p < 0.05, **p < 0.01 and ***p < 0.001 in comparison to scopolamine-treated rats. | |
2.10.2. Effect of treatment on scopolamine-induced Aβ42 accumulation in rat brain. Apart from causing cognitive deficit, repeated administration of scopolamine has been reported to replicate several molecular events of AD including accumulation of Aβ protein.47,48 In this context, we investigated the effect of test compounds (5h and 5k) on Aβ42 accumulation in brain tissue of scopolamine treated rats. There was a remarkable increase in rat brain Aβ load after scopolamine administration (∼2 folds, p < 0.001), in comparison with saline treated animals (Fig. 12B). On the contrary, concomitant administration of 5h and 5k, diminishes the elevated levels of Aβ42 in a dose dependant manner i.e., (5 mg kg−1, ∼29%, p < 0.05, 10 mg kg−1, ∼34%, p < 0.01) and (5 mg kg−1, ∼31%, p < 0.05, 10 mg kg−1, ∼34%, p < 0.01), respectively, as compared to scopolamine-treated group (Fig. 12B). Likewise, donepezil treatment also provided significant reduction (∼38%, p < 0.01) in the levels of Aβ42 after scopolamine treatment.
2.10.3. Effect of treatment on biochemical markers of oxidative stress. To further elucidate the biochemical mechanism of antiamnesic potential of test compounds in brain tissues, their effects on the markers of oxidative stress were determined after scopolamine exposure. Previous studies reported that scopolamine induced amnesia is associated with increased oxidative damage and altered levels of endogenous antioxidant enzymes including GSH in the brain.49 One of the suggested mechanism that leads to induction of oxidative stress following scopolamine exposure involves activation of a cascade of redox-sensitive cell signal pathways.50 As shown in Table 1, scopolamine treatment resulted in significant elevation of brain TBARS content by ∼2 folds (p < 0.001) as compared to saline treated control group. Whereas, simultaneous administration of donepezil considerably reduced the scopolamine mediated increase in TBARS content by (p < 0.001) in rat brain. Similarly, co-treatment with compound 5h has significantly normalized the elevated TBARS content at all respective doses (2.5, 5 and 10 mg kg−1) when compared with scopolamine group (Table 1). Meanwhile, compound 5k ameliorated scopolamine induced lipid peroxidation only at higher dose level (5 mg kg−1 and 10 mg kg−1), respectively. The levels of protein carbonyl were found to be increased about ∼2 folds (p < 0.01) following scopolamine exposure compared with normal control (Table 1). There was a marked reduction in protein carbonyl contents in 5h and 5k (5 and 10 mg kg−1) treated groups as compared to scopolamine group. Whereas at low dose (2.5 mg kg−1) test compounds failed to restored the elevated protein carbonyl contents in experimental rats. Furthermore, scopolamine (1.5 mg kg−1) induced dementia resulted in decreased brain GSH content by (p < 0.001) as compared to the control group. Meanwhile, the higher doses of test compounds significantly revert back the reduced GSH levels induced by scopolamine treatment.
Table 1 Effect of compounds 5h and 5k on scopolamine-induced oxidative stress parameters in rat braina
| Treatment (mg kg−1) |
TBARS levels (μmol mg−1 protein) |
Protein oxidation (nmol carbonyl per mg protein) |
GSH (μmol mg−1 protein) |
| Data are expressed as mean ± SEM (n = 6). ##p < 0.01, ###p < 0.001 significant in comparison to control. *P < 0.05, **p < 0.01, ***p < 0.001 significant in comparison to scopolamine treated group. |
| Control |
0.30 ± 0.05 |
4.15 ± 0.22 |
0.52 ± 0.064 |
| Scop |
0.59 ± 0.04### |
8.99 ± 1.36## |
0.23 ± 0.069### |
| Scop + donepezil (2.5 mg kg−1) |
0.32 ± 0.02*** |
3.80 ± 1.12** |
0.49 ± 0.021** |
| Scop + 5h (2.5 mg kg−1) |
0.41 ± 0.08* |
5.94 ± 0.76 |
0.35 ± 0.058 |
| Scop + 5h (5 mg kg−1) |
0.35 ± 0.03** |
4.11 ± 1.09** |
0.48 ± 0.094** |
| Scop + 5h (10 mg kg−1) |
0.37 ± 0.08** |
3.95 ± 0.84** |
0.50 ± 0.099** |
| Scop + 5k (2.5 mg kg−1) |
0.45 ± 0.09 |
5.94 ± 0.68 |
0.34 ± 0.062 |
| Scop + 5k (5 mg kg−1) |
0.41 ± 0.06* |
5.21 ± 0.85* |
0.45 ± 0.054* |
| Scop + 5k (10 mg kg−1) |
0.37 ± 0.02** |
5.03 ± 0.19* |
0.47 ± 0.031** |
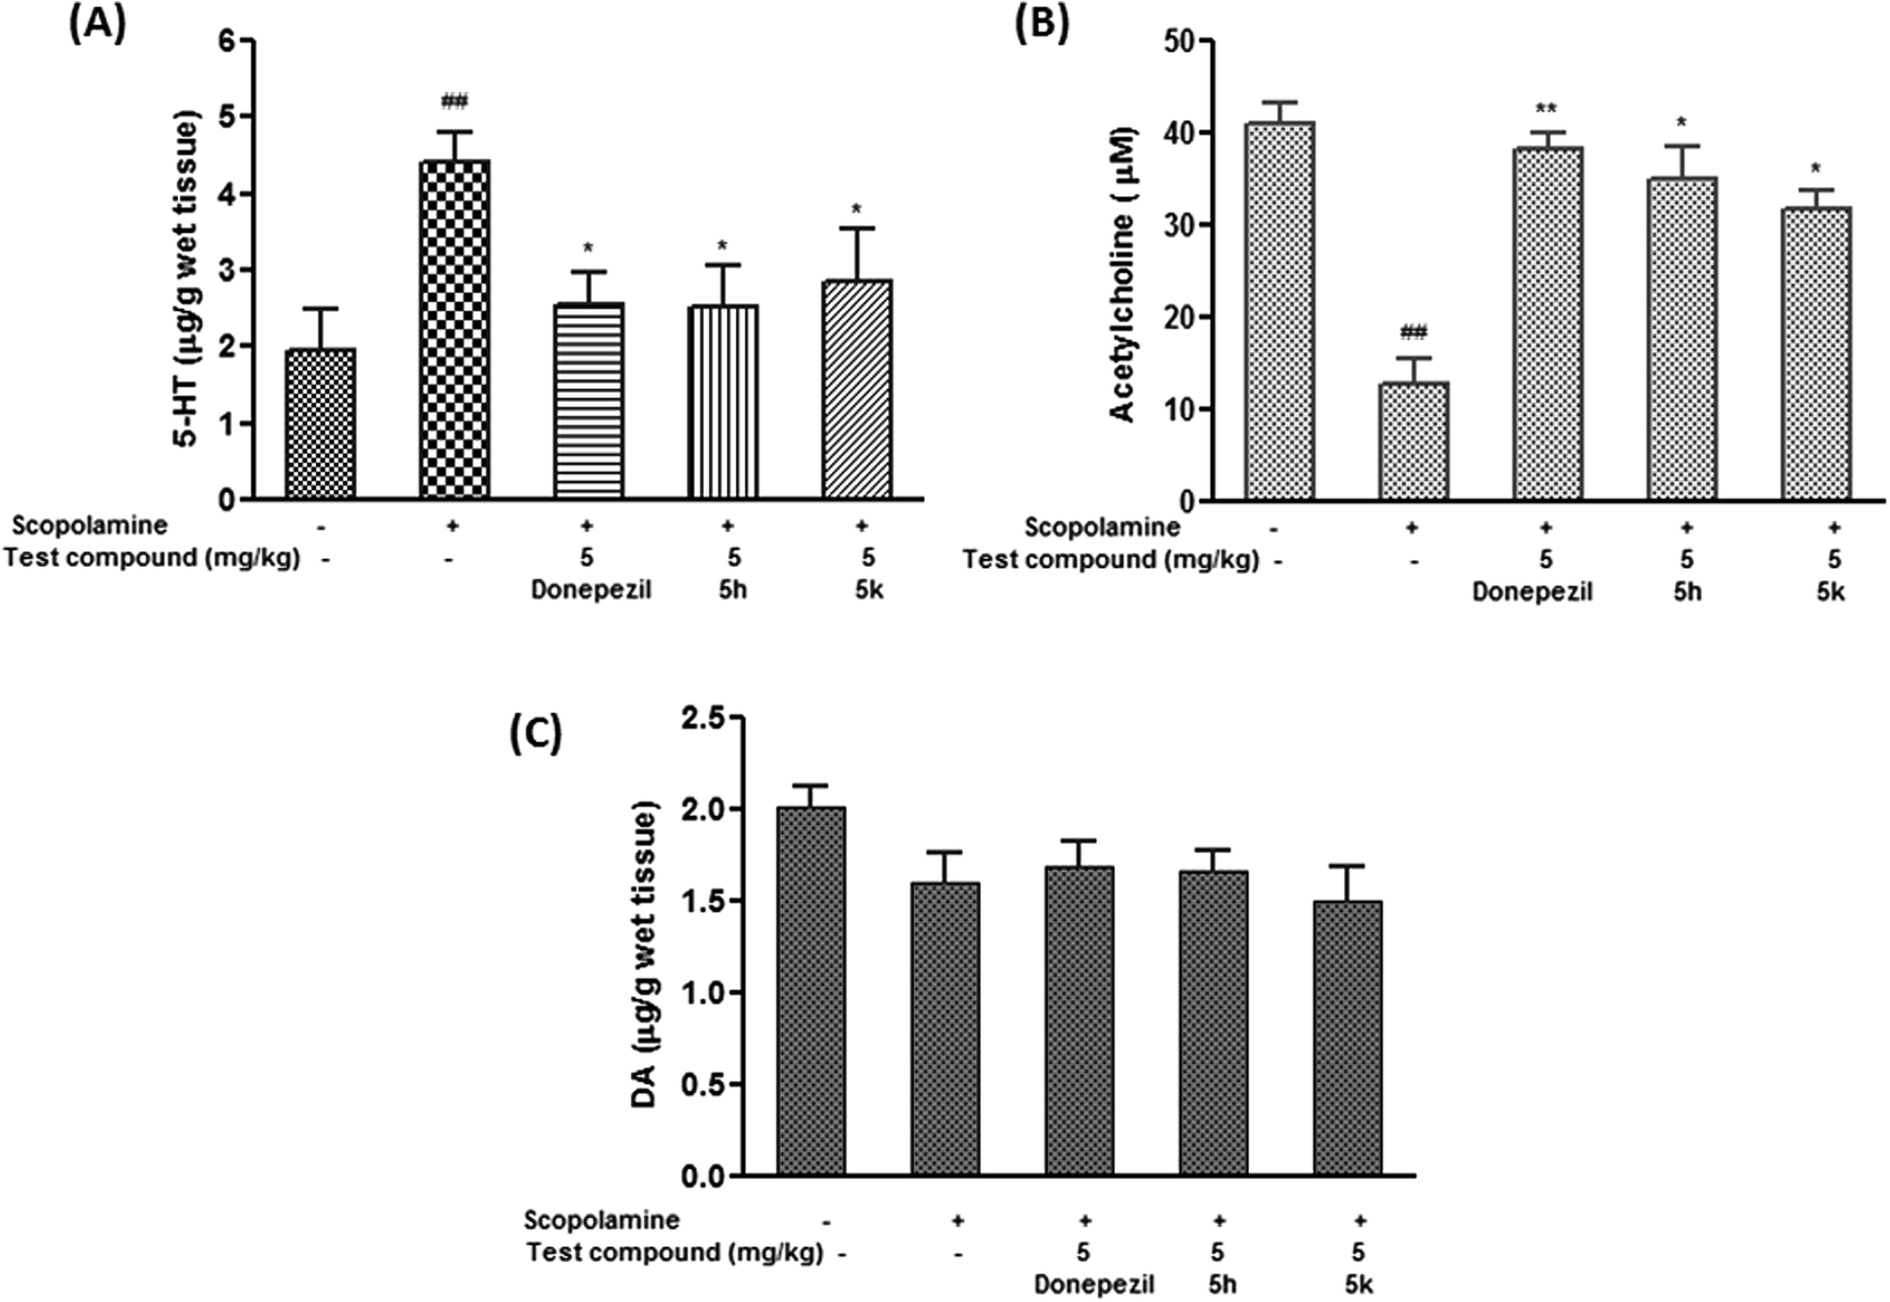
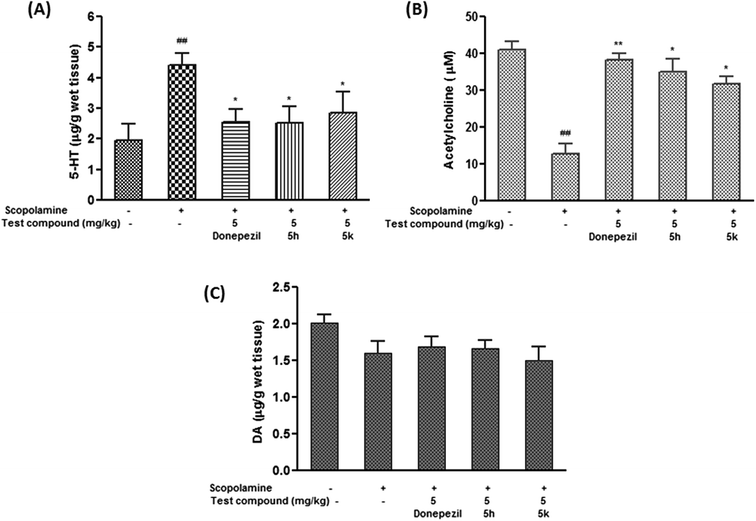
2.10.4. Effect of compounds 5h and 5k on brain neurotransmitter (5-HT, ACh and DA) levels. The neurochemical basis of learning and memory processes involve interactions between various neurotransmitter systems due to the complex network of neurons inside brain. Besides ACh, perturbations in other neurotransmitter levels negatively affect the cognitive functions. Observations from clinical studies suggest that extensive serotonergic denervation is of particular relevance to the neuropsychiatric aspects of AD. It has been hypothesized that serotonergic changes are secondary to cholinergic changes, as 5-HT has an inhibitory effect on cholinergic neurons, therefore decrease in the serotonergic tone may help maintain the cholinergic input in deficient cholinoceptive target areas.51 In the present investigation, scopolamine (1.5 mg kg−1) induced dementia resulted in considerable increase in extracellular serotonin levels in rat brain by 2.5 folds (p < 0.01) as compared to control group (Fig. 13A). It was evident from the results that donepezil and the test compounds (5h and 5k) at 5 mg kg−1 dose level significantly restored the altered serotonin levels by ∼53% (p < 0.05), ∼52% (p < 0.05) and ∼58% (p < 0.05) with respect to scopolamine treated group (Fig. 13A). Moreover, it was noted that extracellular serotonin levels after 5h (5 mg kg−1) treatment were found to be comparable with standard drug donepezil. Meanwhile, scopolamine treatment significantly brought down ACh levels in brain tissue (68.52%, p < 0.01) as compared to control group (Fig. 13B). In contrast, donepezil treatment resulted into marked increase in ACh levels by ∼3 folds (p < 0.01) when compared to scopolamine treated group. Furthermore, ACh levels were restored in the brain by compounds 5h (2.7 folds, p < 0.05) and 5k (2.5 folds, p < 0.05) as compared to scopolamine alone treated rats (Fig. 13B). In contrast, no significant changes were elicited in brain dopamine levels in scopolamine administered rats compared to normal group. Similarly, test compounds at their respective doses and time period, did not cause any significant alteration in levels of dopamine (Fig. 13C).
 |
| | Fig. 13 Effect of test compounds (5h and 5k) on brain monoamine concentration of (A) acetylcholine (ACh) (B) serotonin (5-HT) and (C) dopamine (DA) in scopolamine-induced demented rats. Data are expressed as mean ± SEM of 6 animals. #p < 0.05, ##p < 0.01 in comparison to untreated control rats. *P < 0.05, **p < 0.01 in comparison to scopolamine-treated rats. | |
2.11. Effect of treatment on histopathological changes in cortical and hippocampal tissue
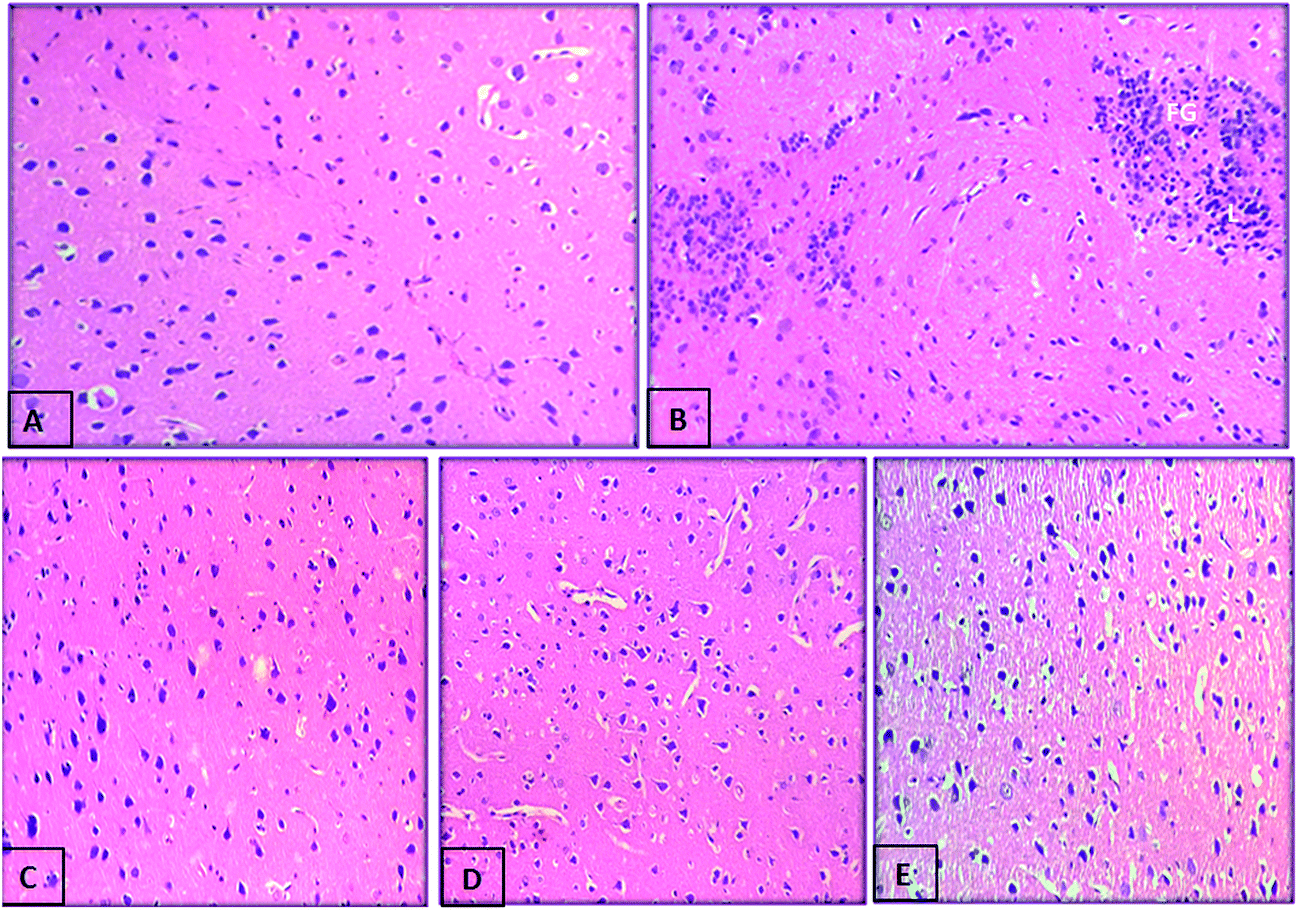
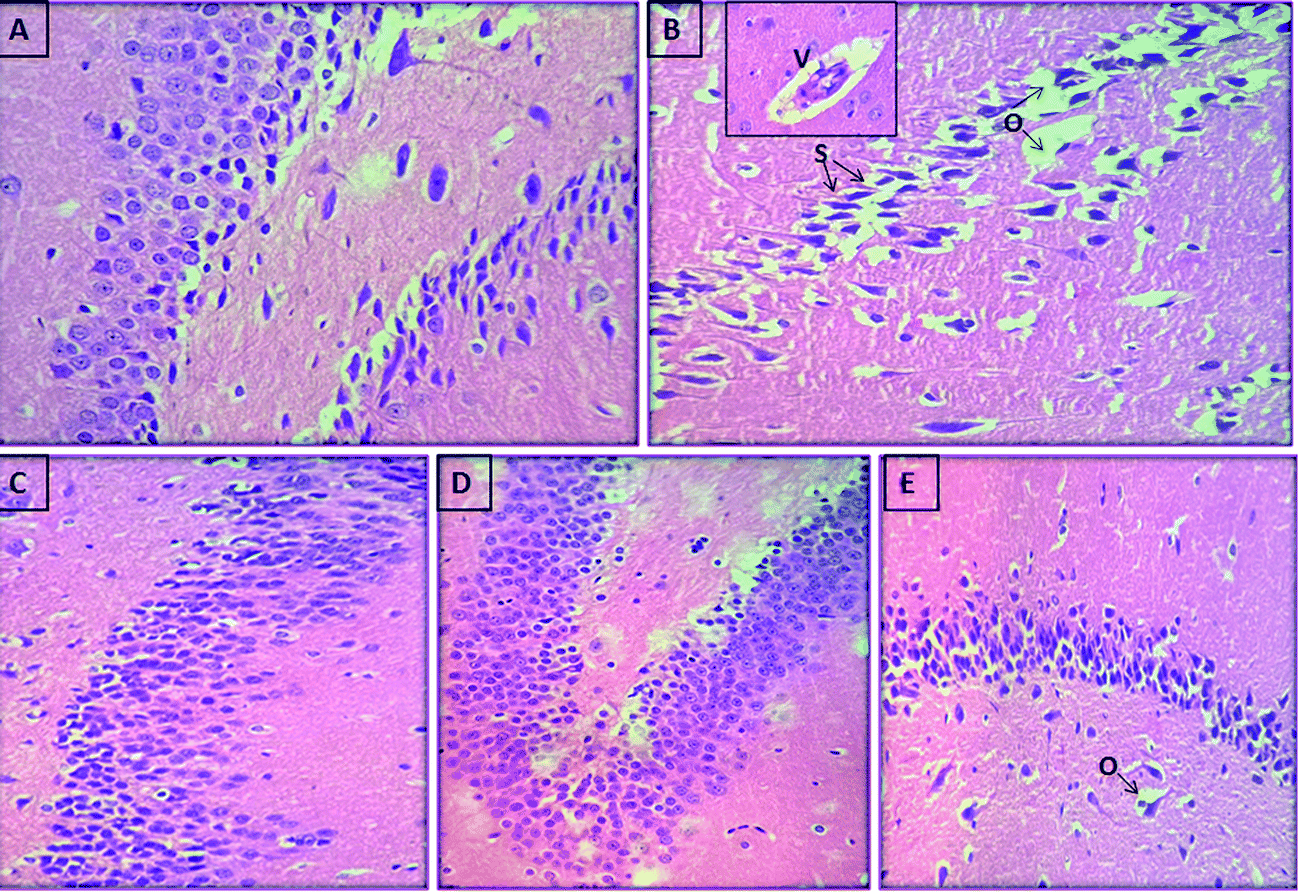
We further assessed whether compounds (5h and 5k) administration can protect against the histopathological changes in the brain of scopolamine treated rats. Photomicrographs revealed an intact architecture of the cortex and hippocampus tissues with normal morphological appearance in case of normal control rats (Fig. 14A and 15A). On the other hand, cortex of the scopolamine group showed focal gliosis and lymphocytic infiltrate (Fig. 14B), along with hippocampus damage which consisted of degenerative changes and atrophy of the neuronal cells as indicated by shrunken neurons with pyknotic nuclei, severe congestion in the blood capillaries with perivascular edema (Fig. 15B). Spongiosis was clearly spotted in these micrographs based on the appearance of vacuoles in the brain matrix. In addition, gliosis a characteristic feature of activated glial cells was observed following induction of dementia in scopolamine group. Treatment with compounds 5h (Fig. 14D and 15D) and 5k (Fig. 14E and 15E) (5 mg kg−1) provided marked protection against scopolamine-induced brain injury as revealed by partial restoration of induced damage in cortex tissues with only mild degenerative changes in the hippocampus. Similarly, donepezil treatment also reversed scopolamine-induced pathological changes as shown by normal histological appearance of the brain tissues (Fig. 14C and 15C).
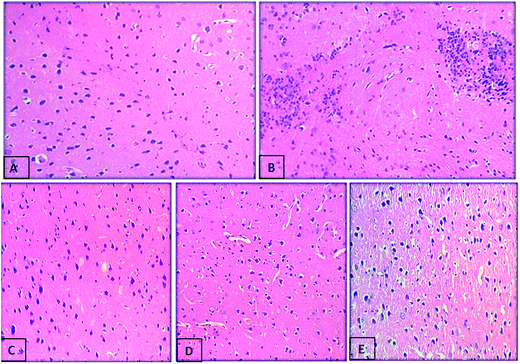 |
| | Fig. 14 Photomicrograph of sections of brain cortex tissue of (A) control rat showing the normal histological structure of cortex, (B) scopolamine-treated rat showing focal gliosis (g), (C) demented rat treated with donepezil (5 mg kg−1) showing nearly normal histological structure of cortex, (D) demented rat treated with compound 5h (5 mg kg−1) showing the normal histological structure of cortex and (E) demented rat treated with compound 5k (5 mg kg−1) showing the normal histological structure of cortex (H and E X 40). | |
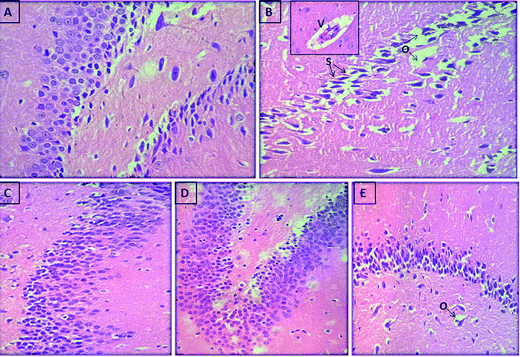 |
| | Fig. 15 Photomicrograph of sections of brain hippocampus tissue of (A) control rat showing the normal histological structure of hippocampus, (B) scopolamine-treated rat showing spongiosis (s) in hippocampal matrix with perivascular edema (o) and congestion in blood vessels (v) in the inset, (C) demented rat treated with donepezil (5 mg kg−1) showing normal histological structure, (D) demented rat treated with compound 5h (5 mg kg−1) showing the normal histological structure of hippocampus (E) demented rat treated with compound 5k (5 mg kg−1) showing mild edema in hippocampus (o) (H and E X 40). | |
2.12. Subacute toxicological studies with compounds 5h and 5k
In the present study, test group animals were found to be healthy as no signs of toxicity were recorded during the experimental period indicating that compounds 5h and 5k did not have any adverse effects on body weight (Table S1, ESI†). In addition, test compounds treatment did not produce any significant change in the levels of hepatotoxicity markers like AST and ALP as compared to control group (Table S2, ESI†). The normal levels of serum creatinine and urea further indicated that these compounds did not hamper with the renal integrity in experimental rats.
3. Conclusions
In conclusion, the present study aimed to gain better insights into the multitargeted potential of benzylpiperidine derivatives in modulating AD pathological events. The combined interpretation of extensive results from biophysical studies involving CD spectroscopy, ThT fluorescence assay and electron microscopy revealed that 5h and 5k could reduce or inhibit β-sheet aggregation and fibril formation, thus proved to be the strong inhibitors of Aβ1–42 fibrillogenesis. Moreover, molecular docking and dynamics simulations studies indicated that these compounds especially 5h, was found to be effective in inhibiting the toxic conformation of Aβ42. Furthermore, in vitro studies demonstrated that 5h and 5k possess significant protective effects against neurotoxicity induced by toxic Aβ aggregates. These compounds exerted their neuroprotective effects by reducing Aβ-induced cell death and ROS in SH-SY5Y cells. In vivo studies further illustrated the therapeutic potential of benzylpiperidine derivatives in improving spatial learning and memory in scopolamine induced model of dementia. In addition, compounds 5h and 5k showed multifaceted effects in attenuating the progression of scopolamine-induced AD-like pathology via decreasing AChE activity, suppression of Aβ levels and ameliorating oxidative stress. Moreover, the neuroprotective characteristic of these derivatives were well supported by neurochemical basis and histopathological findings. Together, the present findings and previous studies provide compelling preclinical evidence that benzylpiperidine derivatives have multiple functional roles in targeting the distinct key pathways of AD pathogenesis, thus making them promising disease-modifying therapeutic agents for AD treatment.
4. Experimental section
4.1. Materials
Aβ1–42 peptide, thioflavin-T (ThT), donepezil hydrochloride, 3-(4,5-dimethyl-2-thiazolyl)-2,5-diphenyltetrazolium bromide (MTT), 2′,7′-dichlorofluorescein diacetate (DCFH-DA), 5,5′-dithiobis(2-nitrobenzoic acid) (DTNB) were purchased from Sigma Chemical Co. All other reagents were of the highest grade of purity commercially available.
4.2. CD spectroscopic analysis
Commercially available lyophilized peptides were first dissolved in hexafluoroisopropanol (HFIP) (5 mg ml−1) and incubated at room temperature for 1 h. Next, the peptide solution was sonicated and aliquoted into small samples. The solvent was removed under a stream of nitrogen gas and the resulting peptide film was stored in an airtight vial at −20 °C until further analysis. For CD experiments, the Aβ stock solution was diluted with 20 mM phosphate buffer (pH 7.4) to 20 μM before use. A mixture of the peptide (10 μl, 20 μM, final concentration) with or without the tested compound (20 μM) was incubated at 37 °C for 3 days. CD spectra showing secondary structure of Aβ1–42 aggregates were recorded using a CD Jasco J-810 single beam spectropolarimeter. A quartz cell with 1 mm optical path was used. Spectra were recorded at 25 °C between spectral range of 190 and 260 nm with a bandwidth of 0.5 nm, a 3 s response time and scan speed of 10 nm min−1.
4.3. Transmission electron microscopy (TEM) assay
The Aβ1–42 peptide stock solution was diluted with 50 mM phosphate buffer (pH 7.4), which was incubated in the presence and absence of test compounds at 37 °C. The final concentrations of Aβ1–42 and test inhibitors were 25 μM, respectively. After 24 hours of incubation, aliquots (10 μl) of the samples were placed on carbon-coated copper/rhodium grid. Each grid was negatively stained with 2% uranyl acetate solution for 1 min at room temperature. After draining off the excess staining solution, the specimen was transferred for imaging in a transmission electron microscope (JEOL JEM-1400).52 All compounds were solubilised in the buffer which was used for the experiment.
4.4. Molecular docking studies
In order to get insight into the interaction mechanism of test compounds with Aβ1–42 peptide, molecular docking studies were performed by using AutoDock 4.2 program. Initial coordinates for Aβ1–42 used in docking studies were taken from the NMR structure (PDB ID: 1IYT), which comprises of two helix regions from residues 8–25 and residue 28–38, and a single turn region (residues 26, 27) connecting both the helix.53 The Aβ1–42 peptide was set up for docking with standard protocol. AutoDock tool (ADT), version 1.5.4, was used to add polar hydrogen atoms to amino acids residues and Gasteiger charges were assigned to all atoms of the peptide. The grid map with 60 × 60 × 60 points spaced equally at 0.375 Å was generated using AutoGrid program to evaluate the binding energies between the ligand and receptor. The docking simulation was performed using the Lamarckian Genetic Algorithm.54 To analyse binding energy in the docking step, three terms were considered, the van der Waals interaction represented as a Lennard-Jones 12-6 dispersion/repulsion term, the hydrogen bonding represented as a directional 12-10 term, and the coulombic electrostatic potential. At the end of the run, all docked conformations are clustered using a tolerance of 2 Å for root mean square deviation (RMSD) and the lowest energy conformation of the highest populated cluster was selected for analysis. Docked models of the ligand–receptor complex were visualized using PyMOL.
4.5. Molecular dynamics simulations
All MD simulations were performed with Gromacs 4.6.5 package, using GROMOS96 43A1 force field55 and spc216 water model. All the trajectory files were analyzed using GROMACS utilities: g_rmsd, g_rmsf, g_gyrate and g_sas to obtain the graphs of root mean square deviations (RMSD), root mean square fluctuation (RMSF), radius of gyration (Rg), and solvent accessibility surface area (SASA). The secondary structural analyses were performed for Aβ1–42 and Aβ1–42–5h complex models over the whole simulation period by using STRIDE program as implemented in VMD tools.37 The coordinate of each system was energy minimized with steepest descent method to remove bad contacts. Two independent MD simulations were carried out with standard protocol in water for Aβ1–42 and Aβ1–42–5h complex at 300 K, respectively to evaluate the structural changes, binding affinity and stability in course of simulation. GlycoBioChem PRODRG2 server was used to generate the topology file for ligand.56 The linear constraint solver (LINCS) algorithm was used to constraint all the bonds in complex system. For computing the long-range electrostatic interactions the Particle Mesh Ewald (PME) method were used. A 1.4 nm cut-off for van der Waal interactions and a 1.0 nm cut-off for columbic interactions were adopted in the simulation study. Analytical graphs were plotted using Grace (Graphing, Advanced Computation and Exploration) program.
4.6. Inhibition of AChE-induced Aβ1–42 peptide aggregation assay
The inhibitory potency of compounds on AChE-induced Aβ1–42 aggregation was determined by using thioflavin T (ThT) fluorescence method. For co-incubation experiments,57,58 aliquots of Aβ1–42 peptide and AChE from electric eel (E.C. 3.1.1.7), in the presence or absence of test compounds were incubated for 6 h at 37 °C. The final volume of each vial was 20 μl, and the final concentrations of Aβ (dissolved in DMSO and diluted with 0.215 M sodium phosphate buffer, pH 8.0) and AChE (dissolved in 0.1 M sodium phosphate buffer, pH 8.0) were 25 μM and 0.025 U, respectively. After co-incubation, to the mixture solutions of 20 μl was added 5 μM ThT 200 μl. To quantify the amyloid fibril formation, ThT fluorescence was measured at excitation λ, 450 nm and emission λ, 485 nm. The percent inhibition of the AChE-induced aggregation was calculated by the following expression: (1 − IFi/IFc) × 100%, where IFi and IFc are the fluorescence intensities obtained for Aβ1–42 plus AChE in the presence and absence of inhibitors, respectively, minus the fluorescence of respective blanks. Each assay was conducted in triplicate, and each reaction was repeated at least three independent times.
4.7. Cell culture and MTT assay
Human neuroblastoma SH-SY5Y cells were obtained from NCCS, Pune, India and grown in Dulbecco's modified Eagle's medium (DMEM) supplemented with 10% fetal calf serum (FCS, GIBCO), 2 mM glutamine, 50 U ml−1 penicillin, and 50 μg ml−1 streptomycin in a humidified atmosphere containing 5% CO2 at 37 °C. To examine possible toxic effects, SH-SY5Y cells were cultured in 96-well plates at a density of 2 × 10⁴ cells per well. Then cells were pretreated with different concentrations of test compounds (1–100 μM) for 24 h. The cell viability in terms of mitochondrial metabolic function was determined using MTT reduction assay.59 After treatment, cells were incubated with MTT reagent (5 mg ml−1 in PBS) for 3 h at 37 °C. After the removal of MTT, the coloured formazan crystals were solubilized by adding 150 μl DMSO. The absorbance of resulting colored solution was measured using a microculture plate reader at a test wavelength of 570 nm with 655 nm as a reference wavelength. The neuronal viability was expressed as a percentage of control cells.
4.8. Aβ1–42-induced cytotoxicity
SH-SY5Y cells were plated at appropriate density into 96-well plates. Then cells were preincubated with test compounds at the designated concentrations (5, 10, 25 μM) for 24 h, and subsequently treated with 25 μM Aβ1–42. At the end of the incubation period, cell viability was determined using the MTT assay as described above. Besides, morphological alterations in SH-SY5Y cells were observed by using an inverted phase-contrast microscope (Olympus, Japan).
4.9. ROS measurements under Aβ1–42-induced cellular stress
Intracellular ROS levels were assayed using the fluorescent probe DCFH-DA. In brief, SH-SY5Y cells were grown on 96-well plates and treated with Aβ1–42 (25 μM) in the presence or absence of compounds 5h and 5k (10 and 25 μM) for 24 h. Following drug treatment, the cells were treated with 10 μM DCFH-DA at 37 °C for 30 min. On incubation, DCFH-DA readily diffuses through the cells and enzymatically cleaved by cellular esterases to yield 2′,7′-dichlorofluorescein (DCFH). In the presence of intracellular ROS, DCFH is rapidly oxidized to highly fluorescent DCF compound. The fluorescence intensity of this product was monitored using ELISA plate reader (Tecan infinity 20) at an excitation and emission wavelength of 488 and 524 nm, respectively.
4.10. H2O2-induced cell death
To evaluate the protective effects of compounds against hydrogen peroxide (H2O2) induced neurotoxicity, the SH-SY5Y cells were plated at a density of 2 × 10⁴ cells per well on 96-well plates. As previously reported,23 the tested compounds were added to the cultured cells at different concentrations (1, 5, 10, 20 μM) for 24 h prior to the H2O2 insult. Trolox was used as the reference compound in the same concentration range. After 24 h of incubation, the cells were exposed to H2O2 (200 μM) for 2 h, and then replaced with fresh DMEM medium. Assay for cell viability was performed 24 h after cultured at 37 °C in fresh medium. SH-SY5Y cells cultured without test compound or H2O2 were taken as control group. Photomicrographs were also taken to characterize morphological alterations in SH-SY5Y cells.
4.11. In vivo studies
Healthy male wistar rats weighing 270 ± 20 g were procured from in-house animal facility of Dr B. R. Ambedkar Center for Biomedical Research, University of Delhi, Delhi, India. The animals were housed under standard environmental conditions of 12 h dark/light cycle at 25 ± 2 °C with 65 ± 5% relative humidity and allowed free access to food and water during entire study. All studies on animals were performed in accordance with the guidelines of the committee for the purpose of control and supervision of experiments on animals (CPCSEA), Ministry of Environment and Forest, Government of India, New Delhi. The experimental protocols were approved by the Institutional Animal Ethics Committee (Registration Number: CPSCEA/350/3rd Jan, 2001, approval number: ACBR/11/BCD/1887).
4.12. Drugs and experimental design
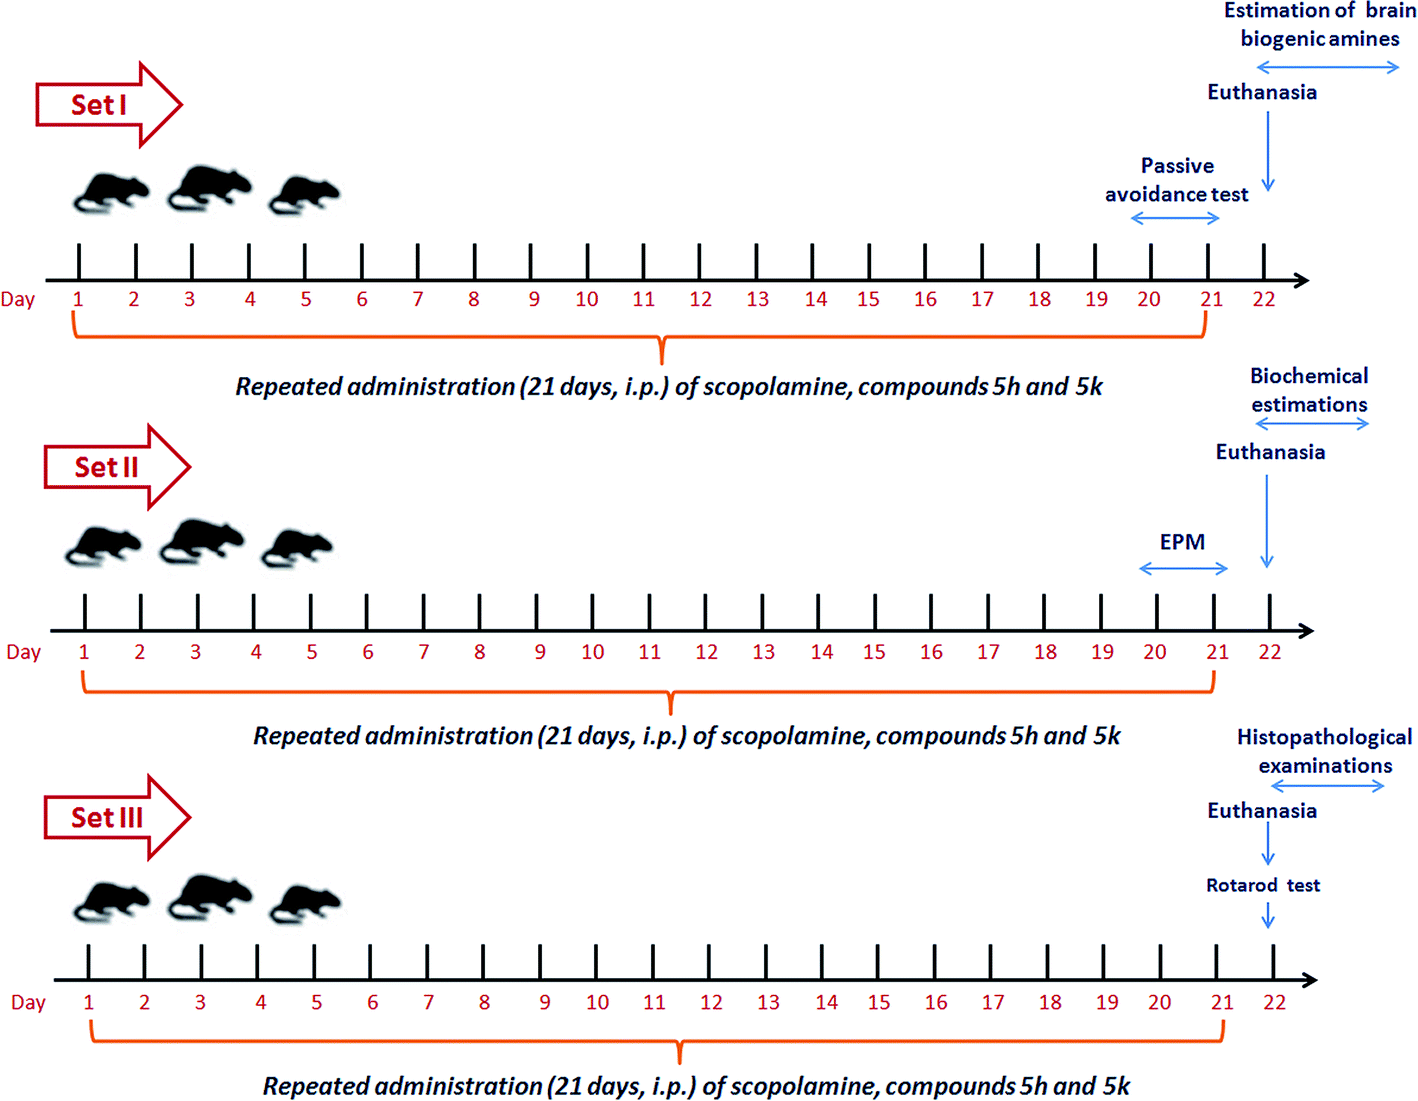
After one week of acclimatization, the animals were randomly divided into triplicate sets (S I, S II and S III) each consisting of nine groups with 6 animals each. These nine groups within each set were subjected to same drug treatment within the group. Group I served as normal controls and received normal saline (daily, i.p.). Animals in group II were administered scopolamine at a dose of 1.5 mg per kg b. wt per day, i.p.47,60 Group III animals were treated with standard drug donepezil (5 mg per kg b. wt per day, orally) along with scopolamine (1.5 mg per kg b. wt per day, i.p).61 In groups IV, V and VI, rats were given a combined treatment of scopolamine followed by treatment with compound 5h (2.5, 5 & 10 mg per kg b. wt per day, i.p.). Finally, groups VII, VIII and IX were received a combined treatment of scopolamine along with compound 5k (2.5, 5 & 10 mg per kg b. wt per day, i.p.). The doses of benzylpiperidine derivatives and donepezil were selected with reference to our previous studies61,62 and on the basis of pre-experiments standardized in our laboratory. All these respective treatments were followed daily for 21 consecutive days (3 weeks). At the end of treatment schedules, all animals were subjected to behavioral studies. The timeline of complete experimental scheme is shown in Fig. 16. After the completion of behavioral studies, animals were sacrificed and the whole brain was dissected out. The brain samples from each set were then processed accordingly for biochemical and histological examinations as illustrated in experimental design (Fig. 16).
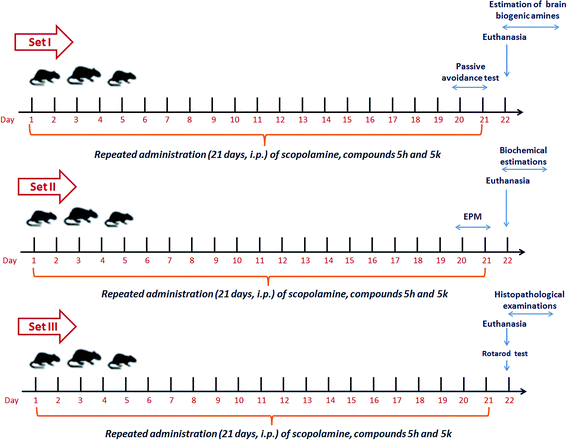 |
| | Fig. 16 Experimental protocol design for in vivo study. | |
4.13. Neurobehavioral studies
4.13.1. Passive avoidance task. Passive avoidance is a fear-aggravated test and has been widely used to assess learning and memory deficits in experimental animals.63 The apparatus consisted of a light compartment that was illuminated with a 60 W bulb, positioned 50 cm above the apparatus, and a dark compartment with an electrifiable metal floor. The two compartments were separated by a guillotine doorway in the centre. Each test consisted of two separate trials, an acquisition and retention trial. All test compounds were administered 60 min before the training trial. Each training trial was conducted 30 min after a scopolamine treatment (1.5 mg kg−1, i.p.). For training trial, each rat was initially placed in the illuminated compartment and allowed to explore it for 30 s. A door separating the compartment was opened and the latency to enter the dark compartment was measured as step-through latency (in seconds). When the rat entered into the dark compartment, a 0.5 mA electrical foot shock was delivered through the grid floor for 3 s. A retention trial was performed 24 h later, in which each rat was put into the illuminated compartment and the latency time to enter the dark compartment (retention latency) was recorded as a measure of memory retention. Cut-off time of 300 seconds were used for step-through latency.
4.13.2. Elevated plus maze. Elevated plus-maze is a well-established exteroceptive behavioral model to evaluate short-term memory in rodents.64 The plus maze apparatus used in the study was consisted of two open arms (50 cm × 10 cm) and two closed arms (50 cm × 10 cm × 30 cm) extended from a central platform (10 cm × 10 cm) that was elevated to a height of 50 cm above floor level. In the training trial (20th day of study), each rat was placed at the end of an open arm, facing away from the central platform, and the time taken by the animal to reach one of the enclosed arm was recorded as transfer latency (TL in seconds). Cut-off time for TL measurement was 90 seconds. If the animal failed to find the enclosed arm within 90 s, it was gently guided into the enclosed arm. The animal was allowed to explore the maze for 30 s and then returned to the home cage. Retention of this learned-task (memory) was measured after 24 h of the first day trial (21st day of treatment). The reduction in TL during retention trial is used as an indicator of memory improvement.
4.13.3. Rotarod test. Accelerating rotarod task is commonly used to assess possible defects in neuromuscular coordination that might occur in the chemically treated rats. It is an easily quantifiable test, in which animals maintain balance on a rotating rod with a diameter markedly smaller than their body length.65 The time at which each animal falls from the rotating rod is recorded. On the last day of treatment, all animals were evaluated for motor skill learning in the accelerated rotarod task. Experimental rats were given three initial training trials of 300 s to maintain posture on the rotarod before rotarod performance task. After the initial training trials, animals were again screened for their ability to remain on the rotating rod (speed 25 rpm, rod diameter 7 cm) individually for a fixed cut-off time of 180 s. Three separate test trials were conducted on each rat at 5 min time interval. The time each animal remained on the rotarod was recorded.
4.14. Biochemical estimations
After the completion of behavioral studies, animals were sacrificed and their brain tissues were immediately removed, rinsed with ice-cold isotonic saline and stored at −80 °C until use. Brain tissue was homogenized (10% w/v) in phosphate buffer (PB, 0.1 M, pH 7.4) containing 1 mM ethylene diamine-tetra-acetic acid (EDTA), 0.25 M sucrose, 10 mM potassium chloride (KCl) and 1 mM phenyl methyl sulfonyl fluoride (PMSF).66 The homogenates was centrifuged at 800 × g for 5 min at 4 °C to remove the cell debris and nuclear pellets. The supernatant obtained at this stage contained crude membranes that were used for the estimation of lipid peroxidation. The remaining supernatant was again centrifuged at 12365 × g for 15 min at 4 °C to obtain post-mitochondrial supernatant (PMS) which was used for the estimation of AChE, protein carbonyl and reduced glutathione (GSH) levels.
4.14.1. Measurement of tissue acetylcholinesterase (AChE) activity. The brain AChE activity was assessed following the colorimetric method of Ellman et al.67 with minor modifications.62
4.14.2. Quantification of brain Aβ42 levels. The levels of Aβ42 in brain tissue were quantified using double-antibody sandwich ELISA based assay kit. The assay was performed according to manufacturer's instructions (KinesisDX, USA). The concentration of Aβ42 in unknown rat brain samples was measured in duplicate and expressed as pg per mg of protein after plotting the absorbance of standards against the standard concentrations.
4.15. Oxidative stress markers
Lipid peroxidation: the quantitative measurement of lipid peroxidation was determined by measuring malondialdehyde (MDA) formation, using the thiobarbituric acid (TBA) assay as described by Ohkawa et al.68 Protein oxidation: protein carbonyl levels, as an index of protein oxidation, was measured by the method of Levine et al.69 Reduced glutathione (GSH): the reduced GSH level was estimated according to the method described by Jollow et al. with slight modification.62,70
4.16. Estimation of brain biogenic amines
4.16.1. Acetylcholine (ACh) levels. The ACh level in the brain was measured using an assay kit (Molecular Probes, Invitrogen, USA) in a 96 well plate reader. The method was based on the hydrolysis of ACh by AChE to choline which is turn oxidized by choline oxidase to betaine and H2O2. In the presence of horseradish peroxidase, H2O2 reacts with the Amplex Red reagent in a 1:1 stoichiometry to form a highly fluorescent pink colour product. The intensity of coloured product is measured at fluorescence emission maxima of approximately 585 nm, which directly corresponds to the ACh concentration in the sample.
4.16.2. Serotonin (5-HT) levels. For the estimation of serotonin neurotransmitter levels, a part of brain tissue from each rat was homogenized in 10 volume (w/v) of ice-cold 0.1 N perchloric acid (PCA).71 The homogenates were centrifuged at 12000 × g for 20 min at 4 °C. The pellets were discarded and an aliquot of 300 μl of supernatant was added to 150 μl of solution containing 0.2 M potassium citrate, 0.3 M di-potassium hydrogen phosphate and 0.2 M EDTA. The mixtures were kept on ice for 1 h and then centrifuged at 12000 × g for 20 min at 4 °C again. The resulting supernatant was further filtered through 0.25 μm membrane filters and then 20 μl of it was injected manually into high pressure liquid chromatography (HPLC, Perkin-Elmer, MA, USA) system equipped with fluorescence detector and a reverse phase C18 column (250 mm × 4.6 mm, ID 5 μm) for separation. The mobile phase consisted of 12.2 mM citric acid, 11.6 mM ammonium phosphate, 2.5 mM sodium octyl sulphate, 3.3 mM dibutylamine phosphate (pH 2.5), 1.1 mM disodium EDTA with final pH adjusted to 3.8. Separation was carried out with a flow rate of 1 ml min−1. The unknown concentration of serotonin in the sample was quantified by comparing retention time and peak area with known 5-HT standard (0.1–10 ng ml−1) solutions.
4.16.3. Dopamine (DA) levels. For the estimation of brain dopamine levels, experimental rats were sacrificed and their brains were dissected out. Weighed quantity of brain tissue was homogenized in 10 volume of acidified n-butanol for 1 min at 4 °C. 3.3 ml of aliquot was taken from the homogenized tissue and then centrifuged at 1000 × g for 5 min. 3 ml n-butanol layer of supernatant was removed and added to a tube containing 4.5 ml of n-heptane with 1 ml of distilled water. After gentle shaking, the samples were centrifuged at 1000 × g for 2 min. The upper organic layer was discarded and to 1 ml of lower aqueous phase was added 1.3 ml of 2 M sodium acetate buffer containing 0.2% EDTA and 100 mg alumina. The contents of the tubes were shaken for 5 min followed by centrifugation at 1000 × g for 5 min. The sedimented alumina which remained after the removal of the supernatant was shaken with 2.0 ml of water and then centrifuged at 1000 × g for 5. The resulting pellet was then mixed with 0.6 ml of sodium phosphate buffer (0.5 M, pH 6.0) containing 0.75% EDTA followed by 0.5 ml of 0.1 N iodine solution for oxidation. The reaction was stored after 2 min by addition of 0.1 ml freshly prepared alkaline sulphite solution. After 2 min, 0.1 ml of 5 M acetic acid was added. The solution was then heated to 100 °C for 2 min. After cooling the samples, excitation and emission spectra were recorded at 330–375 nm using fluorescence spectrophotometer. The values were expressed as fluorescent excitation spectral height intensity correspondence to the concentration of dopamine present in the sample.72
4.17. Histological examination of brain tissues
Histopathological studies were performed on cortex and hippocampal sections of rat brain from each experimental group after fixation with 10% formalin and embedded in paraffin wax. Coronal sections of 4–5 μm thickness were cut and stained with hematoxylin and eosin (H and E) to examine the pathological changes. The images were acquired under the light microscope fitted with camera (Leica Microsystems, Germany).
4.18. Subacute toxicity
The subacute toxicity studies were performed as per the OECD test guidelines with slight modifications (OECD TG 407).73 Healthy male wistar rats were allocated in three groups (n = 8 per group). The control group received only vehicle while other two groups received compounds (5h and 5k) intraperitoneally at an effective dose of 5 mg kg−1, i.p for 21 consecutive days. During the experimental period, animals were monitored for any kind of toxic manifestation, changes in behavioral pattern, mortality and the body weight changes. After the stipulated period, the animals were made to fast overnight, but allowed access to water ad libitum. For biochemical analysis, blood was collected by cardiac puncture and centrifuged at 1480 × g for 10 min to obtain serum for the estimation of aspartate aminotransferase (AST), alkaline phosphatase (ALP), blood urea nitrogen (BUN) and creatinine using commercially available assay kits.
4.19. Estimation of total brain protein
Protein content was determined by the method of Bradford using bovine serum albumin (BSA) as a standard.74
4.20. Statistical analysis
The statistical analysis was performed using Graph pad prism 5 software. Each data value is presented as the mean ± SEM. The data were analyzed statistically using analysis of variance (ANOVA) followed by Bonferroni's multiple comparison test. The data were considered to be statistically significant if the probability had a value of 0.05 or less.
Conflict of interest
The authors declare that there is no conflict of interest.
Abbreviations
| AD | Alzheimer's disease |
| AChE | Acetylcholinesterase |
| MTDL | Multi-target-directed ligand |
| ACh | Acetylcholine |
| AChE | Acetylcholinesterase |
| Aβ | Amyloid beta |
| ROS | Reactive oxygen species |
| TEM | Transmission electron microscopy |
| ThT | Thioflavin T |
| CD | Circular dichroism |
| EPM | Elevated plus maze |
| 5-HT | 5-Hydroxytryptamine |
Acknowledgements
The author Dr Manisha Tiwari wishes to acknowledge the Department of Science & Technology, Govt. of India (No. SR/SO/BB-0009/2012) for grant-in-aid to carry this work. We sincerely thank Prof. Vani Brahmachari for valuable scientific discussion. The authors gratefully acknowledge Dr Dipti Prasad, DIPAS, New Delhi, for providing necessary facilities to conduct behavioral experiments. Poonam Meena wishes to acknowledge the Senior Research Fellowship awarded by the University Grants Commission-Govt. of India. Vishal Nemaysh is thankful to C-DAC, Bioinformatics Resources & Applications Facility (BRAF), Pune, India, for providing supercomputing facility.
References
- C. P. Ferri, M. Prince, C. Brayne, H. Brodaty, L. Fratiglioni, M. Ganguli, K. Hall, K. Hasegawa, H. Hendrie and Y. Huang, Lancet, 2006, 366, 2112–2117 CrossRef.
- Y. Huang and L. Mucke, Cell, 2012, 148, 1204–1222 CrossRef CAS PubMed.
- X. Zhu, A. K. Raina, G. Perry and M. A. Smith, Curr. Alzheimer Res., 2006, 3, 393–396 CrossRef CAS PubMed.
- W.-H. Zheng, S. Bastianetto, F. Mennicken, W. Ma and S. Kar, Neuroscience, 2002, 115, 201–211 CrossRef CAS PubMed.
- M. Citron, Nat. Rev. Drug Discovery, 2010, 9, 387–398 CrossRef CAS PubMed.
- C. Haass and D. J. Selkoe, Nat. Rev. Mol. Cell Biol., 2007, 8, 101–112 CrossRef CAS PubMed.
- D. J. Selkoe, Nature, 1999, 399, A23–A31 CrossRef CAS PubMed.
- S. Oddo, A. Caccamo, M. Kitazawa, B. P. Tseng and F. M. LaFerla, Neurobiol. Aging, 2003, 24, 1063–1070 CrossRef CAS PubMed.
- D. J. Selkoe, J. Neuropathol. Exp. Neurol., 1994, 53, 438–447 CrossRef CAS PubMed.
- C. J. Pike, D. Burdick, A. J. Walencewicz, C. G. Glabe and C. W. Cotman, J. Neurosci., 1993, 13, 1676–1687 CAS.
- C. Zussy, A. Brureau, B. Delair, S. Marchal, E. Keller, G. Ixart, G. Naert, J. Meunier, N. Chevallier and T. Maurice, Am. J. Pathol., 2011, 179, 315–334 CrossRef CAS PubMed.
- D. J. Bonda, X. Wang, G. Perry, A. Nunomura, M. Tabaton, X. Zhu and M. A. Smith, Neuropharmacology, 2010, 59, 290–294 CrossRef CAS PubMed.
- M. Padurariu, A. Ciobica, R. Lefter, I. L. Serban, C. Stefanescu and R. Chirita, Psychiatr. Danubina, 2013, 25, 401–409 CAS.
- D. A. Butterfield, S. Griffin, G. Munch and G. M. Pasinetti, J. Alzheimer's Dis., 2002, 4, 193–201 CAS.
- B. S. Kristal, A. D. Conway, A. M. Brown, J. C. Jain, P. A. Ulluci, S. W. Li and W. J. Burke, Free Radicals Biol. Med., 2001, 30, 924–931 CrossRef CAS PubMed.
- X. Zhu, M. A. Smith, K. Honda, G. Aliev, P. I. Moreira, A. Nunomura, G. Casadesus, P. L. Harris, S. L. Siedlak and G. Perry, J. Neurol. Sci., 2007, 257, 240–246 CrossRef CAS PubMed.
- K. Chopra, S. Misra and A. Kuhad, Expert Opin. Pharmacother., 2011, 12, 335–350 CrossRef PubMed.
- I. Melnikova, Nat. Rev. Drug Discovery, 2007, 6, 341–342 CrossRef CAS PubMed.
- R. Morphy and Z. Rankovic, J. Med. Chem., 2005, 48, 6523–6543 CrossRef CAS PubMed.
- A. Cavalli, M. L. Bolognesi, A. Minarini, M. Rosini, V. Tumiatti, M. Recanatini and C. Melchiorre, J. Med. Chem., 2008, 51, 347–372 CrossRef CAS PubMed.
- P. Meena, V. Nemaysh, M. Khatri, A. Manral, P. M. Luthra and M. Tiwari, Bioorg. Med. Chem., 2015, 23, 1135–1148 CrossRef CAS PubMed.
- A. Manral, V. Saini, P. Meena and M. Tiwari, Bioorg. Med. Chem., 2015, 23, 6389–6403 CrossRef CAS PubMed.
- J. Kumar, P. Meena, A. Singh, E. Jameel, M. Maqbool, M. Mobashir, A. Shandilya, M. Tiwari, N. Hoda and B. Jayaram, Eur. J. Med. Chem., 2016, 119, 260–277 CrossRef CAS PubMed.
- M. Maqbool, A. Manral, E. Jameel, J. Kumar, V. Saini, A. Shandilya, M. Tiwari, N. Hoda and B. Jayaram, Bioorg. Med. Chem., 2016, 24, 2777–2788 CrossRef CAS PubMed.
- R. León, A. G. Garcia and J. Marco-Contelles, Med. Res. Rev., 2013, 33, 139–189 CrossRef PubMed.
- M. Shaquiquzzaman, G. Verma, A. Marella, M. Akhter, W. Akhtar, M. F. Khan, S. Tasneem and M. M. Alam, Eur. J. Med. Chem., 2015, 102, 487–529 CrossRef CAS PubMed.
- M. Baumann and I. R. Baxendale, Beilstein J. Org. Chem., 2013, 9, 2265–2319 CrossRef PubMed.
- P. Pratim Bose, U. Chatterjee, C. Nerelius, T. Govender, T. Norström, A. Gogoll, A. Sandegren, E. Göthelid, J. Johansson and P. I. Arvidsson, J. Med. Chem., 2009, 52, 8002–8009 CrossRef PubMed.
- J. Laurén, D. A. Gimbel, H. B. Nygaard, J. W. Gilbert and S. M. Strittmatter, Nature, 2009, 457, 1128–1132 CrossRef PubMed.
- N. J. Greenfield, Nat. Protoc., 2006, 1, 2876–2890 CrossRef CAS PubMed.
- H.-M. Fan, R.-X. Gu, Y.-J. Wang, Y.-L. Pi, Y.-H. Zhang, Q. Xu and D.-Q. Wei, J. Phys. Chem. B, 2015, 119, 11196–11202 CrossRef CAS PubMed.
- J. A. Lemkul and D. R. Bevan, ACS Chem. Neurosci., 2012, 3, 845–856 CrossRef CAS PubMed.
- A. Lorenzo and B. A. Yankner, Proc. Natl. Acad. Sci. U. S. A., 1994, 91, 12243–12247 CrossRef CAS.
- C. Soto, E. M. Castaño, R. A. Kumar, R. C. Beavis and B. Frangione, Neurosci. Lett., 1995, 200, 105–108 CrossRef CAS PubMed.
- K. L. Sciarretta, D. J. Gordon, A. T. Petkova, R. Tycko and S. C. Meredith, Biochemistry, 2005, 44, 6003–6014 CrossRef CAS PubMed.
- D. A. Butterfield and D. Boyd-Kimball, Biochim. Biophys. Acta, Proteins Proteomics, 2005, 1703, 149–156 CrossRef CAS PubMed.
- W. Humphrey, A. Dalke and K. Schulten, J. Mol. Graphics, 1996, 14, 33–38 CrossRef CAS PubMed.
- Y. Masuda, S. Uemura, R. Ohashi, A. Nakanishi, K. Takegoshi, T. Shimizu, T. Shirasawa and K. Irie, ChemBioChem, 2009, 10, 287–295 CrossRef CAS PubMed.
- E. E. B. Guisasola, S. A. Andujar, E. Hubin, K. Broersen, I. M. Kraan, L. Méndez, C. M. Delpiccolo, M. F. Masman, A. M. Rodríguez and R. D. Enriz, Eur. J. Med. Chem., 2015, 95, 136–152 CrossRef PubMed.
- G. V. De Ferrari, M. A. Canales, I. Shin, L. M. Weiner, I. Silman and N. C. Inestrosa, Biochemistry, 2001, 40, 10447–10457 CrossRef CAS PubMed.
- L. Agholme, T. Lindström, K. Kågedal, J. Marcusson and M. Hallbeck, J. Alzheimer's Dis., 2010, 20, 1069–1082 CAS.
- M. F. Beal, Free Radicals Biol. Med., 2002, 32, 797–803 CrossRef CAS PubMed.
- T. Liu, Z. Xia, W.-W. Zhang, J.-r. Xu, X.-X. Ge, J. Li, Y. Cui, Z.-B. Qiu, J. Xu and Q. Xie, Pharmacol., Biochem. Behav., 2013, 104, 138–143 CrossRef CAS PubMed.
- A. Blokland, Scopolamine Rev., 2005, 1–76 Search PubMed.
- A. C. Sharma and S. K. Kulkarni, Prog. Neuro-Psychopharmacol. Biol. Psychiatry, 1992, 16, 117–125 CrossRef CAS PubMed.
- T. Ahmed and A.-H. Gilani, Pharmacol., Biochem. Behav., 2009, 91, 554–559 CrossRef CAS PubMed.
- S. W. Bihaqi, A. P. Singh and M. Tiwari, Indian J. Pharmacol., 2012, 44, 593 CrossRef PubMed.
- D.-Y. Choi, Y.-J. Lee, S. Y. Lee, Y. M. Lee, H. H. Lee, I. S. Choi, K.-W. Oh, S. B. Han, S.-Y. Nam and J. T. Hong, Arch. Pharmacal Res., 2012, 35, 1279–1286 CrossRef CAS PubMed.
- E. J. Jeong, K. Y. Lee, S. H. Kim, S. H. Sung and Y. C. Kim, Eur. J. Pharmacol., 2008, 588, 78–84 CrossRef CAS PubMed.
- Y. Fan, J. Hu, J. Li, Z. Yang, X. Xin, J. Wang, J. Ding and M. Geng, Neurosci. Lett., 2005, 374, 222–226 CrossRef CAS PubMed.
- P. T. Francis, M. J. Ramírez and M. K. Lai, Neuropharmacology, 2010, 59, 221–229 CrossRef CAS PubMed.
- J.-S. Choi, J. J. Braymer, R. P. Nanga, A. Ramamoorthy and M. H. Lim, Proc. Natl. Acad. Sci. U. S. A., 2010, 107, 21990–21995 CrossRef CAS PubMed.
- O. Crescenzi, S. Tomaselli, R. Guerrini, S. Salvadori, A. M. D'Ursi, P. A. Temussi and D. Picone, Eur. J. Biochem., 2002, 269, 5642–5648 CrossRef CAS PubMed.
- J. Fuhrmann, A. Rurainski, H. P. Lenhof and D. Neumann, J. Comput. Chem., 2010, 31, 1911–1918 CAS.
- X. Daura, A. E. Mark and W. F. Van Gunsteren, J. Comput. Chem., 1998, 19, 535–547 CrossRef CAS.
- A. W. SchuÈttelkopf and D. M. Van Aalten, Acta Crystallogr., Sect. D: Biol. Crystallogr., 2004, 60, 1355–1363 CrossRef PubMed.
- P. Munoz-Ruiz, L. Rubio, E. García-Palomero, I. Dorronsoro, M. del Monte-Millán, R. Valenzuela, P. Usán, C. de Austria, M. Bartolini and V. Andrisano, J. Med. Chem., 2005, 48, 7223–7233 CrossRef CAS PubMed.
- M. Bartolini, C. Bertucci, V. Cavrini and V. Andrisano, Biochem. Pharmacol., 2003, 65, 407–416 CrossRef CAS PubMed.
- S. J. Pollack, I. I. Sadler, S. R. Hawtin, V. J. Tailor and M. S. Shearman, Neurosci. Lett., 1995, 184, 113–116 CrossRef CAS PubMed.
- X. Wang, Z.-H. Wang, Y.-Y. Wu, H. Tang, L. Tan, X. Wang, X.-Y. Gao, Y.-S. Xiong, D. Liu and J.-Z. Wang, Mol. Neurobiol., 2013, 47, 373–381 CrossRef CAS PubMed.
- A. Manral, P. Meena, V. Saini, F. Siraj, S. Shalini and M. Tiwari, Neurotoxic. Res., 2016, 1–20 Search PubMed.
- P. Meena, A. Manral, V. Saini and M. Tiwari, Neurotoxic. Res., 2015, 27, 314–327 CrossRef CAS PubMed.
- C. Mondadori, B. Hengerer, T. Ducret and J. Borkowski, Proc. Natl. Acad. Sci. U. S. A., 1994, 91, 2041–2045 CrossRef CAS.
- M. Vasudevan and M. Parle, Phytomedicine, 2006, 13, 677–687 CrossRef CAS PubMed.
- M. M. Buitrago, J. B. Schulz, J. Dichgans and A. R. Luft, Neurobiol. Learn. Mem., 2004, 81, 211–216 CrossRef PubMed.
- S. W. Bihaqi, M. Sharma, A. P. Singh and M. Tiwari, J. Ethnopharmacol., 2009, 124, 409–415 CrossRef CAS PubMed.
- G. L. Ellman, K. D. Courtney, V. Andres and R. M. Featherstone, Biochem. Pharmacol., 1961, 7, 88–95 CrossRef CAS PubMed.
- H. Ohkawa, N. Ohishi and K. Yagi, Anal. Biochem., 1979, 95, 351–358 CrossRef CAS PubMed.
- R. L. Levine, D. Garland, C. N. Oliver, A. Amici, I. Climent, A.-G. Lenz, B.-W. Ahn, S. Shaltiel and E. R. Stadtman, Methods Enzymol., 1990, 186, 464–478 CAS.
- D. Jollow, J. Mitchell, N. A. Zampaglione and J. Gillette, Pharmacology, 1974, 11, 151–169 CrossRef CAS PubMed.
- M. Khatri, S. K. Rai, S. Alam, A. Vij and M. Tiwari, Bioorg. Med. Chem., 2009, 17, 1890–1897 CrossRef CAS PubMed.
- G. Metcalf, Anal. Biochem., 1974, 57, 316–320 CrossRef CAS PubMed.
- P.-B. T. Guideline, The Hershberger, 2001, 601.
- M. M. Bradford, Anal. Biochem., 1976, 72, 248–254 CrossRef CAS PubMed.
Footnote |
| † Electronic supplementary information (ESI) available. See DOI: 10.1039/c6ra24017h |
|
| This journal is © The Royal Society of Chemistry 2016 |
Click here to see how this site uses Cookies. View our privacy policy here.