A resistive-type humidity sensor based on polypyrrole and ZnO nanoparticles: hybrid polymers vis-a-vis nanocomposites†
Reza Najjar* and
Samira Nematdoust
Polymer Research Laboratory, Faculty of Chemistry, University of Tabriz, 5166616471, Tabriz, Iran. E-mail: najjar@tabrizu.ac.ir; Fax: +98-41-33340191
First published on 21st November 2016
Abstract
Fabrication of resistive-type humidity sensors based on either hybrid polymers of polypyrrole(PPy)–ZnO nanoparticles or their nanocomposites is reported. Hybrid polymers with different ZnO content (14, 19, 32 and 46%) were synthesized via oxidative polymerization of free pyrrole monomer with pyrrole moieties covalently bonded on the surface of ZnO nanoparticles. Moreover, nanocomposites consisting of the above mentioned ZnO content were prepared by efficient mixing of PPy homopolymer with ZnO nanoparticles. The products were characterized via FTIR, TGA, XRD and SEM techniques. The surfaces of the sensing films were characterized with AFM showing uniform and continuous films. Sensors with the highest sensitivity were obtained using hybrid polymers with higher ZnO content and lower particle sizes. Compared to ZnO–PPy nanocomposite sensors, the hybrid polymer sensors showed higher sensitivity and more linear response (R2 = 0.9879–0.9921) over a wide range of relative humidity (11–75%) at room temperature. It was concluded that the covalent bonding of PPy chains with ZnO nanoparticles in a hybrid polymer results in a p–n junction which, in contrast to the one in nanocomposites has a chemical nature. The p–n junction with such a nature enhances the charge transfer between PPy and ZnO nanoparticles in hybrid polymers compared to nanocomposite samples, and hence, imparts higher sensitivity to hybrid polymer based sensors. Investigation of the response–recovery behavior of sensors in 180 seconds of response period indicated a high repeatability and recovery time of 60 seconds without a noticeable hysteresis.
1. Introduction
Owing to the significant effects of monitoring and control of humidity on human health, agriculture, industry, medicine and economic aspects of human life,1–4 the fabrication of inexpensive, light, small, sensitive, reliable sensors operative in a wide range of temperatures is a very interesting topic.5,6 Materials, such as ceramics,7 polymers and composites, with their own advantages and disadvantages are used as sensing materials for humidity sensor fabrication.2,5 Despite the cheapness, ease of use, applicability at low temperatures and longer lifetimes, low sensitivity is the main disadvantage of sensors based on polymeric materials.8 Because of its excellent electrical, thermal and mechanical properties, polypyrrole is suitable for sensor applications.9–12 On the other hand, nanomaterials such as nanostructured ZnO in the various forms like nanoparticles, nanotubes, nanofibers and etc., with their high surface to volume ratio, high sensitivity and fast response has been used earlier for humidity sensing.13–16Hybrid polymers as a new class of materials, made from polymers covalently bonded to the inorganic compounds,17 combine and enjoy the often dissimilar properties of both components in one material, showing more polymer-like behavior as the main component.18,19 Hence, they can be shaped in any forms, viz. bulk and film. The types of interactions between the organic and inorganic components play an important role in the properties exhibited by hybrid materials.20 In contrast to the weak interactions (like only physical interactions), the strong covalent bonds formed between two components in hybrid polymer can prevent dynamic phenomena and significant material changes in long times, such as aggregation, phase separation or leaching out of one of the components.21,22 To the best of our knowledge this is the first report wherein hybrid polymers were used as sensing material.
In this work, novel hybrid polymers of polypyrrole (PPy)–ZnO nanoparticles with different ZnO content were prepared. Pyrrole bonded ZnO nanoparticles were prepared by chemical surface modification and subsequent chemical oxidative polymerization with pure pyrrole monomer lead to the formation of hybrid polymers. Also, ZnO–PPy nanocomposites with the same ZnO content were prepared. The products were characterized and confirmed by FT-IR, XRD, TGA, SEM and AFM techniques. Resistive-type humidity sensors based on the prepared ZnO–PPy hybrid polymers and also ZnO–PPy nanocomposites were fabricated and their performance in different relative humidities was studied and compared.
2. Experimental
2.1. Materials
Spherical ZnO nanoparticles (Tecnan Spain, diameter of 25 nm), 2,4-toluenediisocyanate (TDI, Merck, 99%) pyridine (Merck, 99%) and FeCl3·6H2O (Merck, 98%) were used as received without any further purifications. Pyrrole (Merck, 99%) was distilled under reduced pressure and used as fresh. N-Methylpyrrolidone (NMP), toluene, acetonitrile and tetrahydrofuran (THF) were purified using procedures reported in the literature.23 All of the inorganic salts (LiCl, MgCl2, Mg(NO3)2, NaCl, KCl, and KNO3) were of high purity grade and were used as received.2.2. Surface modification of ZnO-nanoparticles
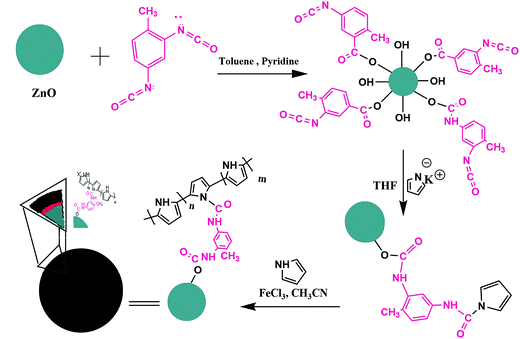
In a 250 ml flask, 1.0 g of nano-ZnO, 2 ml of pyridine and 100 ml of dry toluene were mixed and stirred at room temperature for 15 min. In another flask, under argon atmosphere, 1.5 ml (10.5 mmol, excess) of 2,4-toluenediisocyanate (TDI) was dissolved in 20 ml of dry toluene and stirred at room temperature for a while. Then, TDI solution was added at once onto the solution containing nanoparticles and heated to 110 °C under argon atmosphere. The reaction was continued for 6 h. Afterwards, the precipitate was filtered and washed with toluene and acetone and dried in vacuum at 40 °C for 2 h.2.3. Preparation of pyrrole–ZnO monomer
To prepare the pyrrole monomer attached onto the nanoparticles, firstly, potassium pyrrole salt was prepared. For this purpose, under the argon atmosphere the excess amount of potassium metal was added to 1 ml of pyrrole in dry THF at room temperature and the reaction was performed for 4 h. The white to gray precipitate of potassium pyrrole salt thus obtained was transferred onto the adequate amount of surface modified ZnO in dry THF and stirred at room temperature under argon atmosphere for 24 h. Subsequently, the ZnO–TDI–Py nanoparticles thus formed were filtered and washed with dry THF and finally, dried in vacuum oven at 30 °C for 1 h.2.4. Preparation of ZnO–PPy hybrid polymers
Hybrid polymer was synthesized by polymerization of pyrrole monomer and ZnO–TDI–Py nanoparticles in the presence of FeCl3·6H2O as an oxidant by chemical oxidation polymerization method under the argon atmosphere at room temperature using acetonitrile as solvent. By using different amounts of ZnO–TDI–Py and pyrrole monomers hybrid polymers with different ratios of inorganic to organic parts were obtained (Table 1).| Sample name | ZnO–TDI–Py (g) | ZnO% |
|---|---|---|
| HP-1 | 0.1 | 14 |
| HP-2 | 0.4 | 19 |
| HP-3 | 0.7 | 32 |
| HP-4 | 1.0 | 46 |
2.5. Preparation of ZnO–PPy nanocomposites
Polypyrrole homopolymer was obtained via chemical oxidative polymerization method in acetonitrile as solvent at room temperature by using of FeCl3·6H2O as oxidant under the argon atmosphere.24ZnO–PPy nanocomposite samples were prepared by the following procedure: about 50 mg of polypyrrole was dispersed in 1 ml of NMP, sonicated in an ultrasonic bath at 70 °C for 60 minutes. Afterwards, a known amount of ZnO nanoparticles were added into the mixture to obtain desired composition (Table 2) and sonication and agitation steps were repeated again for another 60 minutes to obtain a homogenous paste which was then used for sensor film preparation.
| Sample name | ZnO (mg) | ZnO% |
|---|---|---|
| NCP-1 | 8.2 | 14 |
| NCP-2 | 11.8 | 19 |
| NCP-3 | 23.6 | 32 |
| NCP-4 | 42.6 | 46 |
2.6. Characterization of materials and sensing films
FT-IR measurements on the samples were carried out on a Tensor 27 Bruker spectrometer (Bruker AG, Germany) as KBr pellets.Thermal behavior of the samples were studied using thermal gravimetric analysis (TGA) using a Linseis thermoanalyzer instrument model SAT-PT 1000 in the nitrogen atmosphere.
Scanning electron microscope (SEM) (LEO 1430VP, from Germany/UK) was used to study the morphology of materials. The surface of samples were covered by a thin layer of gold using sputtering technique.
An atomic force microscope (AFM) model Mobile S from Nanosurf Company, Switzerland was used to investigate the surface morphology and thickness of the sensing film. The experiments were performed in tapping mode using a silicone probe AFM tip (model Tap 190Al-G, resonant frequency – 190 kHz, force constant – 48 N m−1).
The X-ray diffraction investigations were carried out by employing a Bruker XRD diffractometer, model D8-Advance (Bruker, Germany) using Cu Ka radiation.
2.7. Fabrication of humidity sensor and measurement of humidity
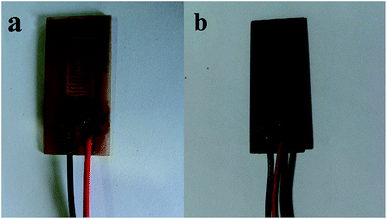
The humidity sensor was fabricated using a procedure similar to the one previously reported in the literature.24,25A paste of hybrid polymer was prepared by mixing an adequate amount of hybrid polymer sample with N-methylpyrrolidone (NMP). Typically, about 20 mg of the hybrid polymer was dispersed in 1 ml of NMP at 40 °C, stirred for 5 minutes and sonicated in an ultrasonic bath for 30 minutes to obtain a well-mixed and homogenous paste. Teflon substrates (1 cm × 2 cm) printed with interdigitated Cu electrodes were used as electrodes. The surface of substrates were cleaned and dried in vacuum for 4 h. Then, the hybrid polymer paste was directly coated on the surface of Cu electrodes by solution dripping technique and dried under vacuum at room temperature overnight. The images of interdigitated bare and hybrid polymer coated Cu electrodes are depicted in Fig. 1.
In the case of ZnO–PPy nanocomposites; the as-prepared paste of nanocomposite was immediately used for preparation of sensing film on the Teflon substrates printed with interdigitated Cu electrodes.
In order to obtain environments with a controlled level of humidity, the closed systems saturated with the vapor of the aqueous solutions of some known salts were used. The saturated aqueous solutions of LiCl, MgCl2, Mg(NO3)2, NaCl, KCl, and KNO3 in a closed glass container make up an environment with relative humidity of 11, 32, 54, 75, 85 and 95%, respectively.26 Then, the hybrid polymer coated electrode was placed in the chamber with known humidity level and then the sensor response was measured and recorded.
The sensor was connected in series with a digital multimeter with an internal resistance of 10 MΩ and the assembly was connected to a DC power supply of 40 volts. Voltage drop on the digital voltmeter is inversely proportional to the resistance of the sensor exposed to a given humidity condition. Ohmic resistance of the sensors can be calculated using the eqn (1):
| Rx = 10(V0 − V)/V | (1) |
3. Results and discussion
The hybrid polymers of ZnO–PPy were synthesized according to the procedure indicated schematically in Fig. 2. The product of each step was characterized and its structure was confirmed by the appropriate methods.For the purpose of comparison, the ZnO–PPy nanocomposites were prepared with the same ZnO content as synthesized hybrid polymer samples. The characterization of ZnO–PPy nanocomposites with various techniques have been already performed and reported in the literature.24
3.1. FT-IR measurements
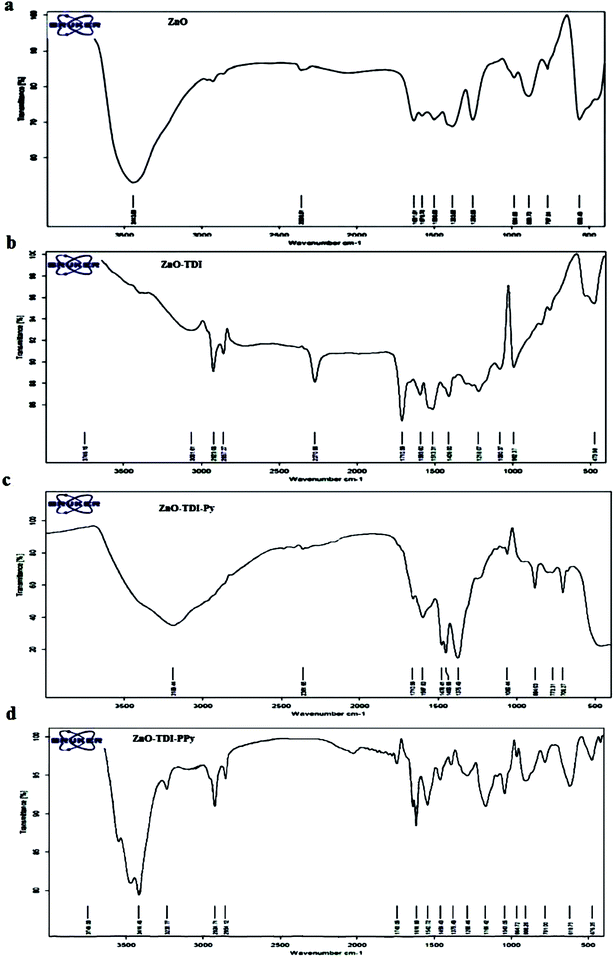
Fourier transform infrared (FT-IR) spectra of ZnO, ZnO–TDI, ZnO–TDI–Py and ZnO–TDI–PPy samples were recorded in the wavenumber range of 400–4000 cm−1 as KBr pellets and depicted in Fig. 3. The strong absorption band appeared at 2270 cm−1 in the spectra of surface modified ZnO (ZnO–TDI) was attributed to the remaining isocyanate group.Absorption band at 1060 cm−1 is related to the stretching vibrations of the C–O bond in CO–O of urethane group formed by the reaction of surface –OH groups on ZnO nanoparticles with one of the isocyanate groups of TDI. In the FT-IR spectra of ZnO nanoparticles a broad peak belonging to the hydroxyl groups of the ZnO nanoparticles was observed in the 3443 cm−1 region. This peak has disappeared in the spectra of surface modified ZnO nanoparticles (ZnO–TDI), indicating that the main part of the hydroxyl groups reacted with the isocyanate groups.
In the FT-IR spectra of ZnO–TDI–Py, there is a strong absorption band for stretching vibrations of carbonyl group (C![[double bond, length as m-dash]](https://www.rsc.org/images/entities/char_e001.gif) O) of urea at 1735 cm−1. The absorption band at 2270 cm−1 related to the remaining isocyanate group (N
O) of urea at 1735 cm−1. The absorption band at 2270 cm−1 related to the remaining isocyanate group (N![[double bond, length as m-dash]](https://www.rsc.org/images/entities/char_e001.gif) C
C![[double bond, length as m-dash]](https://www.rsc.org/images/entities/char_e001.gif) O) which was present in the spectra of ZnO–TDI nanoparticles disappeared in the spectra of ZnO–TDI–Py nanoparticles. This shows that the potassium pyrrole salt has reacted with, and connected to the TDI group.
O) which was present in the spectra of ZnO–TDI nanoparticles disappeared in the spectra of ZnO–TDI–Py nanoparticles. This shows that the potassium pyrrole salt has reacted with, and connected to the TDI group.
After polymerization, in the spectra of ZnO–TDI–PPy a strong absorption at 1743 cm−1, related to the urea carbonyl group appeared. The absorption band observed at 1285 cm−1 is attributed to the stretching vibrations of C–O bond in C(![[double bond, length as m-dash]](https://www.rsc.org/images/entities/char_e001.gif) O)–O– of urethane groups. Absorption band appearing at 1166 cm−1 is related to the C–N bond stretching vibrations of pyrrole ring, and band of stretching vibrations of C
O)–O– of urethane groups. Absorption band appearing at 1166 cm−1 is related to the C–N bond stretching vibrations of pyrrole ring, and band of stretching vibrations of C![[double bond, length as m-dash]](https://www.rsc.org/images/entities/char_e001.gif) C in pyrrole ring appeared as strong absorption at 1616–1542 cm−1.
C in pyrrole ring appeared as strong absorption at 1616–1542 cm−1.
3.2. Thermal Gravimetric Analysis (TGA)
Thermal stability of the pure PPy, pure ZnO nanoparticles and other synthesized materials were studied via thermal gravimetric analysis to determine relative ratios of the organic and inorganic portions of the products. According to the TGA thermogram of pure ZnO nanoparticles depicted in Fig. 4a, it is evident that with increasing of the temperature upto 750 °C, a weight loss of 5.4% was observed, indicating the amount of moisture absorbed by the nanoparticles.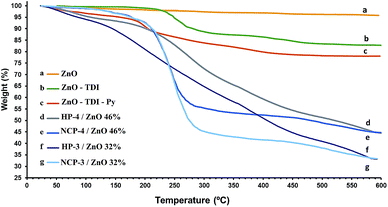 | ||
| Fig. 4 TGA diagram of: (a) bare ZnO nanoparticles (b) ZnO–TDI (c) ZnO–TDI–Py (d) HP-4 (46% ZnO) (e) NCP-4 (46% ZnO) (f) HP-3 (32% ZnO) (g) NCP-3 (32% ZnO). | ||
TGA diagram of the ZnO nanoparticles, surface modified by toluene 2,4-diisocyanate (ZnO–TDI) shows a 15.9% weight loss until 700 °C (Fig. 4b). This indicates that the 15.9% of these materials (ZnO–TDI) is composed of volatile and organic compounds, i.e. moisture and TDI moieties. On the other hand, the presence of 5.4% humidity in the ZnO nanoparticles was revealed by TGA diagram shown in Fig. 4a. Hence, in the TGA diagram of the ZnO–TDI nanoparticles, the rest of observed weight loss (10.5%) was related to the TDI moieties bonded onto the surface of ZnO nanoparticles. Calculations using these values indicated that dried ZnO–TDI nanoparticles was composed of 88.9 weight percent ZnO and 11.1 weight percent of TDI molecules bonded onto the surface of ZnO nanoparticles, and roughly for every 41 ZnO units, one TDI unit is present in the product. Taking into account the diameter and bulk density of ZnO nanoparticles, the number of ZnO units in each ZnO nanoparticle, as well as ratio of TDI to ZnO nanoparticles was calculated. Finally, using the literature values for the radius of the O2− and Zn2+ ions in the crystal structure,26 the approximate surface area covered by the TDI molecules on each ZnO nanoparticles was calculated. These calculations reveal that about 49.5% of the surface of ZnO nanoparticles was covered by TDI molecules. Detailed calculations can be found in ESI† section.
ZnO–TDI nanoparticles were reacted with the potassium salt of pyrrole to obtain ZnO–TDI–pyrrole (ZnO–TDI–Py) nanoparticles as monomer. TGA diagram of ZnO–TDI–Py nanoparticles (Fig. 4c) revealed a 22.4% weight loss occurring until 600 °C. In the temperature range of 50 to 100 °C, a weight loss of 4.2% was observed which is attributed to the removal of moisture and residual solvents. The rest of weight loss, 18.2% was related to the removal of TDI and pyrrole moieties bonded over the ZnO nanoparticles. In comparison with the TGA diagrams of ZnO–TDI nanoparticles, this is indicating that because of the reaction of potassium salt of pyrrole with the remaining –NCO group on the TDI molecules bonded onto the ZnO nanoparticles the relative amount of organic part of ZnO–TDI–Py nanoparticles was increased by 8%. This was further confirmed by the comparison of FT-IR spectra of the ZnO–TDI and ZnO–TDI–Py nanoparticles. The strong absorption band of remaining –NCO group was observed in the FT-IR spectra of ZnO–TDI nanoparticles at 2270 cm−1, while this absorption band has disappeared in the FT-IR spectra of the ZnO–TDI–Py nanoparticles, indicating that the remaining –NCO group has reacted with potassium salt of pyrrole and converted into the urea function. According to this data the ZnO–TDI–Py nanoparticles contained 19% of organic and 81% of ZnO portions.
In order to cover the prepared ZnO–TDI–Py nanoparticles with polypyrrole shell, they were polymerized together with pyrrole monomer via chemical oxidation polymerization method at room temperature. The polymerization reactions were carried out using different relative amounts of the ZnO–TDI–Py nanoparticles and pyrrole as monomers in the polymerization feed to fabricate shell with different thicknesses. Four mixtures with different ratios of the ZnO–TDI–Py nanoparticles to pyrrole monomers, as given in Table 1, were polymerized in acetonitrile as solvent at room temperature. The products were then characterized by thermal gravimetric analysis and the inorganic and organic portions were calculated. The results are presented in Table 1.
As an example, the TGA thermograms of the “HP-3” and “HP-4” samples, are illustrated in Fig. 4d and f showing 68% and 54% weight loss until 600 °C, respectively. Comparison of the TGA thermograms of the hybrid polymer samples (HP-3 and HP-4; Fig. 4d and f, respectively) with the nanocomposite samples (NCP-3 and NCP-4; Fig. 4e and g, respectively) containing the same ZnO content indicate that the hybrid polymer samples have a bit higher thermal stability than nanocomposite samples. Similar TGA diagrams were already reported for the nanocomposites of PPy.27
TGA diagrams of the other samples were also recorded and the relative ratios of their organic and inorganic portions were extracted determined using their thermograms. As given in Table 1, the results revealed that by increasing the relative amount of pyrrole to ZnO–TDI–Py nanoparticles in the polymerization feed the relative ratio of the organic portion has decreased. These results also showed that the hybrid polymers of polypyrrole with ZnO have higher thermal stability than pure PPy samples.
3.3. Scanning Electron Microscopy (SEM)
SEM images of the synthesized nanomaterials are shown in Fig. 5. According to the SEM images of the surface modified ZnO nanoparticles with TDI (ZnO–TDI) (Fig. 5a), as well as ZnO–TDI nanoparticles connected with pyrrole (ZnO–TDI–Py) (Fig. 5b), the particles have a spherical shape with a uniform size distribution, almost similar to pure ZnO nanoparticles. The size of the nanoparticles were measured using the SEM images to be around 40–50 nm for ZnO–TDI (Fig. 5a), and 50–60 nm for ZnO–TDI–Py nanoparticles (Fig. 5b). On the other hand, the SEM images of the hybrid polymer samples prepared with different percentages of ZnO nanoparticles showed that the formation of the polypyrrole shell over the ZnO nanoparticles via polymerization with pyrrole monomer didn't affect their spherical shape and uniform distribution (Fig. 5c and d). Meanwhile, it can be seen from the SEM images that, the size of produced hybrid polymer nanoparticles increased by the increase of the relative ratio of the pyrrole monomer to ZnO–TDI–Py nanoparticles in the polymerization feed mixture. The size of nanoparticles in the sample HP-4 which is produced using pyrrole monomer to ZnO–TDI–Py nanoparticles weight ratio equal to unity, is 60–70 nm (Fig. 5c). Meanwhile, the size of final nanoparticles in HP-1 sample which is produced using a feed mixture containing 10 times higher pyrrole monomer weight than ZnO–TDI–Py nanoparticles, is 80–100 nm (Fig. 5d). These observations were explained as follows: the Py moieties bonded onto the surface of ZnO–TDI nanoparticles, were polymerized with pyrrole monomers added to the reaction mixture. Hence, a PPy polymer layer was formed onto the surface of ZnO nanoparticles to produce a core–shell (ZnO@PPy) structure. Attempts were made to remove the probably formed PPy homopolymer from the hybrid polymer samples by washing the final products with methanol. As the polymerization conditions were kept constant, it is expected that the amount of the produced PPy polymer must be increased by increasing the weight ratio of the pyrrole monomer to the ZnO–TDI–Py nanoparticles in the starting reaction feed mixture, i.e., the amount of produced PPy polymer must show an increasing trend from sample 4 to 1. On the other hand, as the amount of ZnO–TDI–Py nanoparticles present in the reaction medium as core components is decreased from sample 4 to 1, hence the size of shell formed on the ZnO nanoparticles were increased from sample 4 to sample 1, which is clearly seen on the SEM images.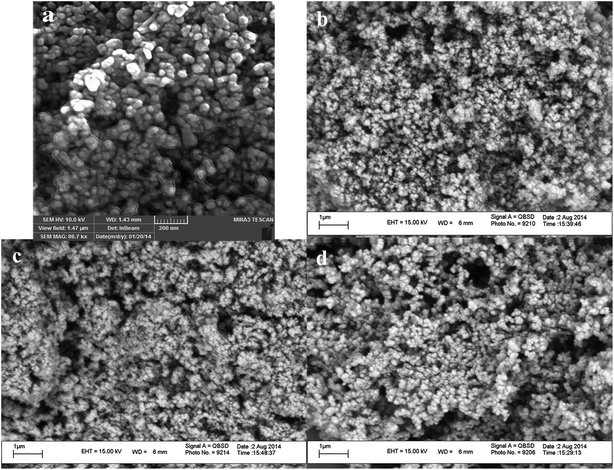 | ||
| Fig. 5 SEM images of (a) ZnO nanoparticles surface modified with TDI (ZnO–TDI), (b) ZnO–TDI–Py nanoparticles (c) HP-4 sample (ZnO–TDI–PPy) containing 46% of ZnO, and (d) HP-1 sample with 14% ZnO. | ||
3.4. XRD characterization of the materials
Fig. 6a–d shows the XRD patterns for the ZnO, ZnO–TDI–Py, ZnO–TDI–PPy hybrid polymer (HP-4) and ZnO–PPy nanocomposite (NCP-4) samples. The XRD pattern for pure ZnO nanoparticles is shown in Fig. 6a, in which the main peaks resulting from mentioned reflections are appeared at 2θ values of about 32°(100), 34.5°(002), 36°(101), 47.5°(102), 56.5°(110), 63°(103), 66.5°(200), 68°(112) and 69°(201). These data are in agreement with the literature data for ZnO.28 According to the Fig. 6b, the main peaks of ZnO can be seen in the XRD pattern of the ZnO–TDI–Py nanoparticles, which is indicating that the surface modification of the ZnO has imparted no effect on the crystal structure of the ZnO nanoparticles. On the other hand, the XRD pattern of the HP-4 hybrid polymer sample (containing 46% of ZnO) (Fig. 6c) was contained only a broad peak around 2θ = 25° which is indicating the amorphous structure of PPy.29 The disappearance of all peaks of ZnO in the XRD pattern of HP-4 sample (Fig. 6c) implies that ZnO nanoparticles are completely covered by the PPy polymer. Meanwhile, as can be seen in Fig. 6d, the XRD pattern of ZnO–PPy nanocomposite sample with 46% ZnO (NCP-4) shows all peaks of crystalline ZnO and amorphous PPy contents, which is in accordance with the previous report for the composites with high ZnO contents.30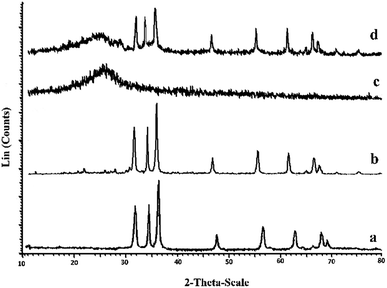 | ||
| Fig. 6 XRD patterns for the (a) pure ZnO nanoparticles (b) ZnO–TDI–Py (c) HP-4 (46% ZnO) (d) NCP-4 (46% ZnO). | ||
3.5. Study of humidity sensing
The surface morphology of sensing film prepared by sample HP-4 was determined by AFM imaging in Fig. 7a, which was indicating an almost uniformly distributed spheres in the polymer matrix. AFM images indicate that a continuous film was formed on the substrate.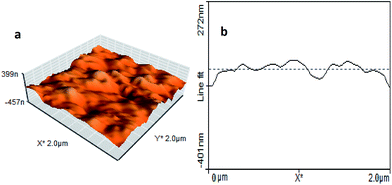 | ||
| Fig. 7 (a) Typical 3D AFM image and (b) AFM cross-section indicating the profile of sensing film surface, prepared using sample HP-4. | ||
The interactions of water molecules in water vapor with surface molecules of the sensing material of the sensor change the electrical resistance or capacitance14,31 of the sensing film, which can be used as sensor response for change in relative humidity.32 Capacitive or resistive types of sensing were used as main mechanisms in the chemical sensors developed for the monitoring and measurement of the humidity. In the resistive type of sensors the resistance of the sensing materials, such as polymer film and etc., is measured against relative humidity. The relative humidity (RH) which depends on the temperature and pressure is defined as the ratio of the partial pressure to the equilibrium vapor pressure of water at the same conditions. The humid environments were prepared according to the fact that the saturated aqueous solutions of special inorganic salts in a closed system at any given temperature produce a constant humidity in equilibrium.26 Table 3 shows the employed inorganic salts and relative humidities (RH) produced by their saturated aqueous solutions at 25 °C.
| Salt | LiCl | MgCl2 | Mg(NO3)2 | NaCl | KCl | KNO3 |
|---|---|---|---|---|---|---|
| RH (%) | 11 | 32 | 54 | 75 | 85 | 95 |
The diagrams of sensor response (or normalized response, NR%) versus relative humidity of the exposed environment for the prepared sensors in this study were constructed. The response exhibited by the sensor as a result of its resistance in any exposed environment was measured and normalized to show the relative difference of the sensor response when exposed to the special humid environment and ambient atmosphere. The normalized responses (NR%) was calculated as mentioned in the Experimental section.
The sensors fabricated using the hybrid polymers of ZnO–PPy synthesized in this work were exposed to the humid environments with a known relative humidity. The resistances exhibited by the sensor at ambient atmosphere and/or exposed to the known humid environments with a wide range of humidity (11–95%) were monitored with time (Section 2.5 above). Because of n-type semiconductor character of the used ZnO the conductivity of the sensors were increased with increasing the humidity. Also, regarding to the well described proton exchange mechanism of humidity sensing by PPy33 owing to increase of the humidity in the exposed environment, the resistivity of the hybrid polymer sample must be decreased.
As an example, the response versus time diagrams for the sensor fabricated using HP-4 and NCP-4 samples (both containing 46% ZnO), in the environments with relative humidities of 11%, 32% and 75%, is depicted in Fig. 8. According to the Fig. 8, after 420 seconds of exposure to the humid environment the response of the both type of sensors made using hybrid polymer and ZnO–PPy nanocomposite samples has reached a maximum response (Rmax) which remained almost constant for further exposure times. Also, it was observed that after removal of the sensor from the humid environment to the ambient atmosphere, it has taken about 300 seconds after removal from the humid environment to recover back to the response in ambient atmosphere (Ramb). Meanwhile, Fig. 8 illustrates that the response of sensor made using hybrid polymer has much higher intensity than sensors fabricated using ZnO–PPy nanocomposite with the same ZnO content.
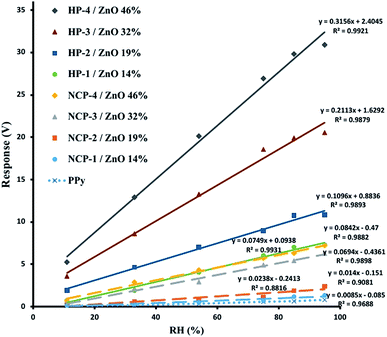
Response versus relative humidity diagrams for the sensors prepared using ZnO–PPy hybrid polymers and ZnO–PPy nanocomposites with different ZnO nanoparticles contents are presented in Fig. 9.
As it can be seen in the Fig. 9, the response of all of the sensors prepared using pure PPy, hybrid polymer or ZnO–PPy nanocomposite samples with different percentages of ZnO nanoparticles, indicated a linear increase with the relative humidity. The best lines fitted to the experimental data showed a high linear regression coefficients of R2 = 0.9688 for the sensor made by using pure PPy, R2 = 0.9879–0.9921 for the sensors of hybrid polymers, and R2 = 0.8816–0.9931 for the sensors fabricated with ZnO–PPy nanocomposite samples. However, the slope of the lines fitted to experimental data obtained from different sensors, were increased by increasing the percentage of ZnO nanoparticles in both of the hybrid polymers and ZnO–PPy nanocomposites used as sensing material in the sensor, and the lowest slope was observed for the sensor made by using of pure PPy. This implies that the sensitivity of the sensors has increased by increase of the ZnO content of the present sensing materials, i.e. ZnO–PPy hybrid polymers or ZnO–PPy nanocomposite. The increase of the sensor response by increasing of the relative humidity in the exposing environment was attributed to the increased amounts of the water molecules which were absorbed onto the sensor surface, and consequently, the more intensive decrease in sensor resistivity and increase in its response were observed.
On the other hand, the increase of the sensor response by increasing of the ZnO content in the hybrid polymers was attributed to the increase in the amount of surface available for the water molecules to absorb and interact with PPy polymer. As revealed by the SEM images, the size of ZnO–PPy hybrid polymer nanoparticles was decreased by increasing of the ZnO content of the hybrid polymers, i.e., size of hybrid polymer nanoparticles were decreased from “HP-1”to“HP-4” sample, inversely by increase of the ZnO content. By decreasing the size of hybrid polymer nanoparticles, their surface to volume ratio increased dramatically. Consequently, more water molecules could be absorbed on the surface of hybrid polymer nanoparticles and impart more decrease in the sensor resistivity, and hence higher increase in its response was observed.
However, the increase in the slope of the response versus relative humidity diagram with ZnO content for the hybrid polymer based sensors has been significantly higher than that of ZnO–PPy nanocomposite based sensors. As both of the hybrid polymer and nanocomposite samples has the same relative amounts of PPy and ZnO nanoparticles as sensing materials, it was expected that they will have almost the same hydrophilic and hydrophobic properties, so, their ability to absorb water molecules must be similar. Hence, it is postulated that the higher sensitivity of the sensors fabricated using hybrid polymers should be related to the formation covalent bonds between ZnO nanoparticles and PPy polymer chains. It is well known that, in contrast to the PPy which is a p-type semiconductor,34 the most of ZnO nanoparticle samples show a n-type semiconductor behavior.35 Therefore, it is concluded that the covalent bond formed between ZnO nanoparticles and PPy chains causes a better electronic connection between these two semiconductors, and consequently much more intensive responses to the absorption of the water molecules on the surface of hybrid polymer based sensors will be observed. However, the connections between ZnO nanoparticles and PPy polymer chains in nanocomposites are only through physical interactions, which can only provide a weaker electronic connection between the two components of the nanocomposites, and responses with a lower intensity than hybrid polymer based sensors will be expected. In the other words, the covalent bonds formed between organic (PPy polymer chains) and inorganic part (ZnO nanoparticles) of the hybrid polymer makes a p–n junction between these two components36 which is of chemical interaction nature and indeed resembles a p–n homo junction, especially by the absorption of water molecules on the surface of PPy, that may act as dopant. Meanwhile, the interface of organic and inorganic parts in ZnO–PPy nanocomposites is a p–n heterojunction possessing mainly physical interaction nature, which obviously acts with some barrier effects on the charge transfer between the two components.37 The p–n junction with such a nature enhances the charge transfer between the PPy and ZnO nanoparticles in hybrid polymers compared to ZnO–PPy nanocomposite samples, so imparts higher sensitivity to ZnO–PPy hybrid polymer based sensors. In the same way, the absence of any type of p–n junctions (homo or hetero) in the sensors made eider by pure PPy or pure ZnO nanoparticles38 was considered as the main reason for the lower sensitivity of these sensors compared with ZnO–PPy hybrid polymer or nanocomposites based sensors. In the case of pure ZnO based sensors use of different types of nanostructured ZnO such as nanorods or nanowires enhances the sensitivity of sensor, but the problems associated with the higher cost, lower stability and lower lifetime of these type of sensors in comparison with the nanocomposite or hybrid polymer ZnO sensors, still remain as their main disadvantage.20
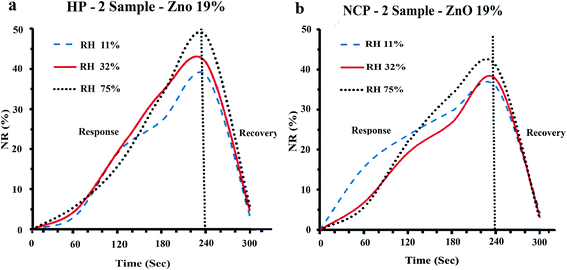
The response–recovery behavior of the fabricated sensors was investigated. The sensors were periodically exposed to the ambient atmosphere and environment with special humidity and their response were recorded with time. Typically, the response of sensor which was in the laboratory atmosphere (ambient atmosphere) was measured and recorded as Ramb. Then, sensor was exposed to the environment with known humidity for 240 seconds and without removing from that humid environment its response was recorded in every 60 seconds. Afterwards, the sensor was removed from the humid environment to the ambient atmosphere and its response was measured in every 60 seconds until a constant response (Ramb) was observed. The response–recovery behavior of the sensors fabricated using HP-2 and NCP-2 samples in the environments with relative humidities (RH) of 11%, 32% and 75% is shown in the Fig. 10(a) and (b). The normalized response (NR%) values of the sensors were calculated as described above. As it can be seen in Fig. 10(a) and (b), after 180 seconds of exposure to the special humid environment the sensors made using HP-2 and NCP-2 samples, have indicated almost 56–70% and 65–82% of their maximum response, respectively. This indicates that the hybrid polymer based sensor (HP-2, Fig. 10a) exhibits a more intensive response than nanocomposite based sensor (NCP-2, Fig. 10b). Also, the Fig. 10(a) and (b) indicates that only 60 seconds after removal of the sensors from the humid environment into the ambient atmosphere their response in ambient humidity (Ramb) was observed. Regarding the recovery behavior of the sensors no significant difference between two types of sensors has been observed. In other words, the sensors fabricated here using hybrid polymer samples have presented a response and recovery times of 180 and 60 seconds, respectively. The presented times are shorter than or comparable to many of the previously reported values in the literature.
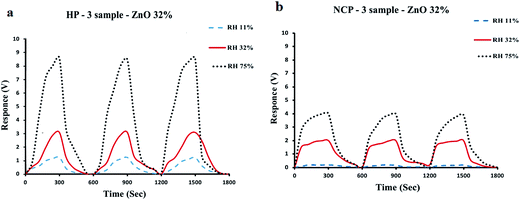
Fig. 11(a) and (b) indicated that the repeatability of the consecutive response–recovery cycles of the sensors in the environments with 11%, 32% and 75% relative humidity is very high. The response–recovery periods were repeated three times for the sensors fabricated using HP-3 and NCP-3 samples and plotted in Fig. 11(a) and (b). As in Fig. 11(a) and (b), both of the sensors were exposed to the humid environment for 300 seconds (response time), and subsequently to the ambient atmosphere, and it was observed that they could recover to the ambient response (Ramb) in about 60 seconds after removal to the ambient atmosphere. These investigations showed no remarkable hysteresis for the sensor responses. So it was concluded that the fabricated sensors have a good sensitivity and high stability, and give reliable results with high repeatability. Considering the fact that the components of sensing material, i.e. ZnO nanoparticles and PPy polymer chains are covalently bonded to each other, so theoretically no phase separation in long usage times was expected for them, and a higher stability can be observed for the hybrid polymer based sensors. In the meantime the higher sensitivity of the hybrid polymer based sensors is obvious from the Fig. 11(a) and (b).
Many works have been reported on the fabrication and investigation of the humidity sensing properties of the polypyrrole and/or its composites with other inorganic materials. The results of some of the reports found in the literature are summarized in Table 4.
| Sensor type | Sensing material | Fabrication method | Measurement range | Response | Ref. |
|---|---|---|---|---|---|
| Resistive-type | Hybrid polymer PPy–ZnO | Solution dripping | 11–95% RH | 5.9–32.4 V/%RH for the ZnO 46% | This paper |
| Resistive-type | PPy/ZrO2 | Preparing compact disks | 24–95.8% RH | 144–483 Ω | 1 |
| Resistive-type | PPy/MoO3 | Preparing compact disks | 20–90% RH | 2.7 MΩ to 71.5 MΩ for the PPy/MoO3 (50%) | 2 |
| Impedance-type | PPy/quaternized | PPy paste applied on sensor surface and in situ reacted with dibromobutane | 11–95% RH | 106 to 103 Ω | 3 |
| Impedance-type | PPy/graphene | Dip-coating | 12–90% RH | 2112.3 to 153.3 kΩ impedance of 10%graphene/PPy composite | 4 |
| Capacitance-type | PPy | Complementary metal oxide semiconductor (CMOS)process | 25 to 85%RH | 38.5 to 32.2 MHz/%RH | 7 |
According to the data given in Table 4, the results obtained in the present work are comparable and in some aspects are superior to the previous reports. As the organic and inorganic moieties are covalently bonded together in the present work it is expected to give better long term stabilities than other reports. The present sensors responded linearly in wider humidity ranges than previously reported sensors.
4. Conclusions
A resistive-type humidity sensor was prepared using hybrid polymers of ZnO–PPy nanoparticles and also ZnO–PPy nanocomposites with different amounts of ZnO, and their performance was compared. The sensors fabricated using hybrid polymers of ZnO–PPy nanoparticles presented higher sensitivity and linear response over the wide range of humidities, compared to the ZnO–PPy nanocomposites based sensors. Hence, it is concluded that the covalent bond between ZnO and PPy polymer chains (hybrid polymers) enhances the electrical connection and charge transfer between these components, so, compared to the situation without covalent bond (in ZnO–PPy nanocomposites) a more intensive response for the exposure of these sensors to humidity was observed. It is postulated that the covalent bond between ZnO and PPy in hybrid polymer changes the p–n heterojunction of ZnO–PPy in nanocomposites into a more like p–n homojunction especially by water absorption. A quick response–recovery behavior with a high repeatability of the results, exhibited by the fabricated sensors indicated that these sensors can be further considered for real time humidity monitoring. It is expected that these sensors can show a very high stability in longer times, with a very low degradation and phase separation in the sensing materials.Acknowledgements
Authors would like to thank Dr Iraj Ahadzadeh and Dr MirGhasem Hosseini for their generous help in preparation of the printed electrodes and performing electrochemical tests. The financial support of Postgraduate Studies Office of the University of Tabriz and Iranian Nanotechnology Initiative Council is gratefully acknowledged.References
- B. V. Chaluvaraju, S. K. Ganiger, V. Uma and M. V. Murugendrappa, Int. J. Sci. Technol., 2014, 44, 69–76 Search PubMed
.
- B. V. Chaluvaraju, S. K. Ganiger and M. V. Murugendrappa, Int. J. Biol. Macromol., 2015, 5, 1–6 Search PubMed
.
- X. Z. Li, S. R. Liu and Y. Guo, RCS Adv., 2016, 6(68), 63099–63106 CAS
.
- W. D. Lin, H. M. Chang and R. J. Wu, Sens. Actuators, B, 2013, 181, 326–331 CrossRef CAS
.
- R. Nohria, R. K. Khillan, Y. Su, Y. Lvov and K. Varahramyan, Nano Sci. Technol., 2005, 2, 422–425 CAS
.
- A. Erol, S. Okur, N. Yağmurcukardeş and M. C. Arıkan, Sens. Actuators, B, 2011, 152, 115–120 CrossRef CAS
.
- B. M. Kulwicki, J. Am. Ceram. Soc., 1991, 74, 697–708 CrossRef CAS
.
- M. I. Azmer, Q. Zafar, Z. Ahmad and K. Sulaiman, RCS Adv., 2016, 42, 35387–35393 Search PubMed
.
- X. F. Yan, D. M. Li, C. C. Hou, X. Wang, W. Zhou, M. Liu and T. C. Ye, Sens. Actuators, B, 2012, 161, 329–333 CrossRef CAS
.
- H. K. Jun, Y. S. Hoh, B. S. Lee, S. T. Lee, J. O. Lim, D. D. Lee and J. S. Huh, Sens. Actuators, B, 2003, 96, 576–581 CrossRef CAS
.
- D. P. Hansora, N. G. Shimpi and S. Mishra, RSC Adv., 2015, 130, 107716–107770 RSC
.
- L. Geng, Y. Zhao, X. Huang, S. Wang, S. Zhang, W. Huang and S. Wu, Synth. Met., 2006, 156, 1078–1082 CrossRef CAS
.
- N. M. Kiasari, S. Soltanian, B. Gholamkhass and P. Servati, Sens. Actuators, A, 2012, 182, 101–105 CrossRef
.
- M. V. Sreelekshmi, S. Gupta and K. Chidambaram, Int. J. Appl. Eng. Res., 2013, 8, 2361–2363 Search PubMed
.
- Y. Wan, J. Liu, X. Fu, X. Zhang, F. Meng, X. Yu, Z. Jin, L. Kong and J. Liu, Talanta, 2012, 99, 394–403 CrossRef CAS PubMed
.
- A. Z. Sadek, W. Wlodarski, K. Kalantar-Zadeh and S. Choopun, Sensors, 2005, 1326–1329 CAS
.
- Y. D. Premchand, M. L. Di Vona and P. Knauth, Nanocomposites, Springer US, 2008, vol. 10, pp. 71–117 Search PubMed
.
- P. Gomez-Romero, Adv. Mater., 2001, 13, 163–174 CrossRef CAS
.
- M. A. Chougule, D. S. Dalavi, S. Mali, P. S. Patil, A. V. Moholkar, G. L. Agawane, J. H. Kim, S. Sen and V. B. Patil, Measurement, 2012, 45, 1989–1996 CrossRef
.
- G. Kickelbick, Introduction to Hybrid Materials, in Hybrid Materials: Synthesis, Characterization, and Applications, ed. G. Kickelbick, Wiley-VCH Verlag GmbH & Co. KGaA, Weinheim, Germany, 2007 Search PubMed
.
- T. Fei, K. Jiang, S. Liu and T. Zhang, RSC Adv., 2014, 41, 21429–21434 RSC
.
- D. Zhang, J. Tong and B. Xia, Sens. Actuators, B, 2014, 197, 66–72 CrossRef CAS
.
- W. L. F. Armarego and C. Chai, Purification of Laboratory Chemicals, Butterworth-Heinemann, Boston, 7th edn, 2013 Search PubMed
.
- W. C. Geng, N. Li, X. T. Li, R. Wang, J. C. Tu and T. Zhang, Sens. Actuator, B, 2007, 125, 114–119 CrossRef CAS
.
- Y. Li and M. J. Yang, Sens. Actuators, B, 2002, 85, 73–78 CrossRef CAS
.
- D. R. Lide, CRC Handbook of Chemistry and Physics, CRC Press, 90th edn, 2010 Search PubMed
.
- W. D. Lin, H. M. Chang and R. J. Wu, Sens. Actuators, B, 2013, 181, 326–331 CrossRef CAS
.
- H. Shao, X. F. Qian and B. C. Huang, Mater. Lett., 2007, 61, 3639–3643 CrossRef CAS
.
- A. Batool, F. Kanwal, M. Imran, T. Jamil and S. A. Siddiqi, Synth. Met., 2012, 161, 2753–2758 CrossRef
.
- K. B. Yazhini and H. G. Prabu, RSC Adv., 2015, 5, 49062–49069 RSC
.
- S. P. Chang, S. J. Chang, C. Y. Lu, M. J. Li, C. L. Hsu, Y. Z. Chiou, T. J. Hsueh and I. C. Chen, Superlattices Microstruct., 2010, 47, 772–778 CrossRef CAS
.
- R. Aneesh and S. K. Khijwania, Appl. Opt., 2011, 50, 5310–5314 CrossRef CAS PubMed
.
- S. Jain, S. Chakane, A. B. Samui, V. N. Krishnamurthy and S. V. Bhoraskar, Sens. Actuators, B, 2003, 96, 124–129 CrossRef CAS
.
- L. Jiang, H.-K. Jun, Y.-S. Hoh, J.-O. Lim, D.-D. Lee and J.-S. Huh, Sens. Actuators, B, 2005, 105, 132–137 CrossRef CAS
.
- A. Janotti and C. G. Van de Walle, Rep. Prog. Phys., 2009, 72, 126501 CrossRef
.
- H. Al-Dmour and D. M. Taylor, Appl. Phys. Lett., 2009, 94, 223309 CrossRef
.
- C. Nguyen Van and K. Potje-Kamloth, Thin Solid Films, 2001, 392, 113–121 CrossRef CAS
.
- A. Erol, S. Okur, B. Comba, O. Mermer and M. C. Arıkan, Sens. Actuators, B, 2010, 145, 174–180 CrossRef CAS
.
Footnote |
| † Electronic supplementary information (ESI) available. See DOI: 10.1039/c6ra24002j |
| This journal is © The Royal Society of Chemistry 2016 |

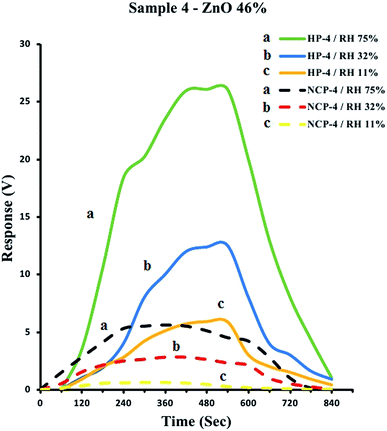
![[dash dash, graph caption]](https://www.rsc.org/images/entities/char_e091.gif) , NCP-4) samples containing 46% ZnO in the environments with relative humidities (RH) of 75% (a), 32% (b) and 11% (c).
, NCP-4) samples containing 46% ZnO in the environments with relative humidities (RH) of 75% (a), 32% (b) and 11% (c).