DOI:
10.1039/C6RA23957A
(Paper)
RSC Adv., 2016,
6, 114396-114404
Effects of cytotoxicity of erythromycin on PAH-degrading strains and degrading efficiency
Received
27th September 2016
, Accepted 23rd November 2016
First published on 24th November 2016
Abstract
The toxicity and degradation effects of erythromycin on a phenanthrene degrading strain of Sphingomonas sp. GY2B and a pyrene degrading strain of Mycobacterium gilvum CP13 were investigated. The minimum inhibitory concentration (MIC) of erythromycin to GY2B was 0.25 mg L−1, but the MIC of erythromycin to CP13 was 16 mg L−1. Total superoxide dismutase (SOD) activity and lactate dehydrogenase (LDH) activity were significantly reduced when the erythromycin concentration exceeded the MIC. Erythromycin also reduced the growth of the strains and the biodegradation of polycyclic aromatic hydrocarbons (PAHs). Addition of erythromycin decreased GY2B phenanthrene removal efficiency by 0.81–86.03% compared to the control. Erythromycin also reduced CP13 pyrene degradation. The lowest pyrene removal efficiency was 10.78% when the erythromycin concentration was 256 mg L−1. The toxicity of erythromycin inhibited the growth of both GY2B and CP13.
1. Introduction
Polycyclic aromatic hydrocarbons (PAHs) are ubiquitous persistent organic pollutants containing two or more aromatic rings. PAHs are environmental contaminants with hydrophobic, carcinogenic, persistent, and bio-accumulative properties. PAHs are a hazard to human health and ecosystems, and cause great public concern.1–3 Microbial bioremediation is highly efficient, low-cost, and simple compared to other methods. It is a clean and versatile method for PAH treatment.4,5
Large amounts of antibiotics are used to treat diseases and infections of humans and animals. The main pharmacological categories of antibiotics are aminoglycosides, β-lactams, macrolides, sulfonamides, quinolones, and tetracycline.6 Antibiotics are commonly used at sub-therapeutic levels to livestock to prevent diseases and promote growth. As a result of incomplete metabolism and absorption, up to 85% of administered antibiotics, including the parent compound and metabolites, can be excreted into the environment via animal manure and human waste. These chemicals may then move to, and contaminate, soil and water systems.7 Antibiotics have been detected in urban waste water, soil, surface water and drinking water in both at home and abroad. The total antibiotics usage in the United States in 2000 was 16
200 t, 70% of which was used for animal veterinary drugs and 30% used in human medicine.8–10 Most antibiotics are antimicrobials that kill microbes directly or inhibit their growth. Antibiotics can influence the composition of environmental microbial communities and, by doing so, upset the ecological balance and food chain and compromise human health.11 Ecological and toxicology effects of antibiotics in the environment have been well studied. Trimethoprim and two kinds of sulfonamides (sulfamethoxazole and sulfamethazine) in soil were toxic to plant growth and addition of these antibiotics to soil at concentrations of 1–300 mg kg−1 significantly affected soil phosphatase activity.12 Li and Shi studied the development of advanced photo-catalysts with visible-light response for photocatalytic degradation of antibiotic wastewater.13 Sanderson et al. documented the toxic effects of antibiotics on algae, fish and other organisms, and used a pharmacodynamic assessment ranking.14 Kong et al. found that carbon source utilization diversity decreased with increasing levels of terramycin and Wang et al. noted that the soil nitrogen cycle can be inhibited by high levels of tetracycline.15,16 Presence of antibiotics in the environment can perturb ecosystem components including bacteria, other soil and water microorganisms, and plants. Antibiotics can also increase the proliferation of antibiotic resistant pathogens and pose an environmental threat to both aquatic and terrestrial ecosystems.
Erythromycin is a secondary metabolite synthesized by Saccharopolyspora erythraea. It is a broad spectrum macrolide antibiotic. Antibiotics are commonly found in the environments of bacteria that degrade environmental pollutants, and this can hinder the natural degradation of contaminants. Erythromycin might therefore inhibit microorganism growth, so knowledge of the toxicity and biological effects of erythromycin are needed.
Sphingomonas can degrade aromatic persistent organic pollutants (such as PAHs),17 and they are used for phenanthrene degradation in many studies.18–20 Pyrene degradation by Mycobacterium sp. has also been extensively studied.21–24 We selected erythromycin, phenanthrene, and pyrene as a representative antibiotic and representative PAH compounds, respectively. Sphingomonas sp. GY2B and Mycobacterium gilvum CP13 are used as degrading bacteria for phenanthrene and pyrene. Our overall goal was to study the toxic effects of erythromycin on GY2B and CP13 and their degrading efficiency. The results will help in understanding the effects of antibiotics on pollutant degrading bacteria.
2. Materials and methods
2.1. Materials
2.1.1. Preparations of bacterial strains. Sphingomonas sp. GY2B and Mycobacterium gilvum CP13 were used in this study. The two strains are preserved in our laboratory (Gen Bank sequence number: DQ139343 and KF378755).
2.1.2. Cultivation of bacterial strains. GY2B is a Gram-negative bacterium isolated from petroleum-contaminated soil in Guangdong Province, China. The strain was pre-cultivated in the mineral salt medium (MSM) with 100 mg L−1 phenanthrene as the sole carbon source on a gyratory shaker (150 rpm) at 30 °C for 48 h. The cultivation solution was combined with an adequate volume of phenanthrene stock solution (20 g L−1) dissolved in acetone; autoclaved MSM was also added.25CP13 is a Gram-positive bacterium isolated from activated sludge in a coking wastewater plant in Shao guan, Guangdong Province, China.26 The strain was cultivated in mineral salt medium (MSM) with 20 mg L−1 pyrene as the sole carbon source on a gyratory shaker (150 rpm) at 30 °C for 72 h. The cultivation solution was spiked with an adequate volume of pyrene stock solution (4 g L−1) dissolved in acetone; autoclaved MSM was also added.
The strains were harvested by centrifugation at 3500g for 10 min, then washed three times with sterile distilled water. Harvested cell were stored at −4 °C and used for further studies.
2.1.3. Media. The mineral salts medium (MSM) consisted of following ingredients (per liter): 5 mL phosphate buffer solution (KH2PO4, 8.5 g L−1; K2HPO4·H2O, 21.75 g L−1; Na2HPO4·12H2O, 33.4 g L−1; NH4Cl, 5.0 g L−1); 3.0 mL MgSO4 solution (22.5 g L−1); 1.0 mL FeCl3 solution (0.25 g L−1); 1.0 mL CaCl2 solution (36.4 g L−1); 1.0 mL trace element solution (MnSO4·H2O, 39.9 mg L−1; ZnSO4·H2O 42.8 mg L−1; (NH4)6Mo7O24·4H2O, 34.7 mg L−1). The medium solution was prepared with distillated water and autoclaved at 1 atm for 15 min. The final pH of MSM was adjusted to 7.0 by HCl and NaOH solutions.Nutrient broth: 10 g tryptone, 5 g beef extract, 5 g NaCl, 15 g agar, 1 L distilled water, pH 7.0.
MH medium: casein hydrolysate (Mueller-Hinton) medium was purchased from Guangzhou Chemical Reagent Factory, China.
2.1.4. Chemicals. Phenanthrene and pyrene (purity ≥ 98%) were purchased from Sigma Aldrich (St. Louis, MO, USA) and selected as the representative PAHs. Erythromycin was obtained from Guangzhou Hua Qisheng biotechnology company, China. The erythromycin E-test strip was purchased from bio-Merieux, France. CCK-8 reagent was purchased from the Chemical Research Institute, Japan. The SOD and LDH kit were purchased from Nanjing Jian Cheng Bioengineering Institute, China. Methanol and acetone (HPLC grade) were obtained from ANPEL Laboratory Technologies (Shanghai, China) Inc. All other reagents (KH2PO4, K2HPO4, CaCl2, etc.) were of the highest purity available and purchased from Guangzhou Chemical Reagent Factory, China.
2.2. Methods
2.2.1. MIC determinations of erythromycin on GY2B and CP13 (MIC E-test method). MICs of GY2B and CP13 of erythromycin were determined using the E-test (bioMerieux, Marcy l'Etoile, France) on Mueller-Hinton agar plates (Oxoid, Basingstoke, United Kingdom) according to manufacturer instructions.27 The two species of bacterial suspensions in logarithmic growth phase were adjusted to 0.5 McFarland turbidity (cell density ≈ 108 CFU mL−1), 1 mL of each bacteria liquid was taken to coat evenly in 150 mm Petri dish containing 4 mm thick MH culture medium, labeled with an erythromycin E-test strip and placed in 37 °C constant temperature incubator for 24 h. The MIC results were read from the junction between oval ring readout and scale inhibition tangent, the unit was mg L−1. Triplicate Petri dishes were performed for each strain. Interpretation guidelines for the E-test followed the American Association of Clinical and Laboratory Standards.
2.2.2. Antibacterial curves of erythromycin on GY2B and CP13 growth determination. The effects of erythromycin on GY2B and CP13 proliferation were determined using 96-well plates and three replications. The medium for the antibacterial curve determination had no PAH. The bacterial suspensions in logarithmic growth phase were adjusted to proper concentration with fresh sterilization of nutrient broth, respectively. For GY2B, the erythromycin concentration ranged from low concentrations of 0.001–1.0 mg L−1 and high concentrations of 5–50 mg L−1, with four wells used per sample. At 24 h and 48 h after inoculation, CCK-8 reagent was added to each well, cultivated 30 minutes at 37 °C, then OD450 was measured by a Synergy 2 Multi-function microplate reader (U.S. BioTek). For CP13, the erythromycin concentrations ranged from 2–256 mg L−1 and cultivated times were 24 h, 48 h, 72 h and 96 h. The following operation was the same as that used for GY2B. The solvent control group (0.1% ethanol solution) and blank control group (nutrient broth culture medium containing bacteria) were established. Mean values were used in calculations for all experiments. The growth inhibition rate was calculated as in eqn (1): |
 | (1) |
The inhibition ratio (%) is the growth inhibition rate, blank is the nutrient broth culture medium containing bacteria, solvent is the 0.1% ethanol solution, test is the bacteria broth with different concentrations of erythromycin. OD450 is the value at a 450 nm wavelength.
2.2.3. The assays of total SOD activity and LDH activity. The determination of erythromycin on total SOD activity of the strain was measured using a SOD kit and conducted according to manufacturer instructions. The experiment was read by a Synergy 2 Multi-function microplate reader (U.S. BioTek, VT) with 96-well plates. The bacterial suspension in logarithmic growth phase were adjusted to 0.5 McFarland turbidity, adding configured erythromycin solution to the concentration gradient, solvent control group, and blank control group. The experiments were conducted three times and the mean values were used in calculations. SOD activity was measured 24 h and 48 h after inoculation at a constant temperature of (37 °C) and calculated using formula (2): |
 | (2) |
The LDH activity test was the same as the test for total SOD activity, measured after 24 h and 48 h inoculation at 37 °C and calculated using formula (3):
|
 | (3) |
2.2.4. Effects of erythromycin on phenanthrene and pyrene biodegradation experiments. GY2B and CP13 were harvested during the exponential growth phase in MSM with phenanthrene and pyrene used as sole carbon sources, respectively. Before the degradation experiments, the strains were washed with 0.02 M phosphate buffer solution (PBS) (0.02 M K2HPO4, 0.02 M KH2PO4) three times and then re-suspended in MSM to obtain a cell concentration of about 108 colony forming units (CFU) mL−1. The experiments were carried out in 100 mL autoclaved Erlenmeyer flasks. Phenanthrene and pyrene solutions were added to each flask to obtain final concentrations of 100 mg L−1 and 20 mg L−1, respectively. Then MSM, cell suspension, and erythromycin stock solution were added to the flasks one by one after the solvent (acetone) evaporated on the bottom. The final erythromycin concentrations were 0, 0.25, 1, 5, 10, 25 mg L−1 for phenanthrene degradation and 0, 2, 8, 16, 32, 64, 128, 256 mg L−1 for pyrene degradation. All flasks were incubated on a reciprocating shaker at 150 rpm and 30 °C in continuous darkness to avoid photo-degradation. At specific time intervals, the residual phenanthrene in the flasks was extracted with methanol and filtered through 0.22 μm Teflon filter units to detect concentration. Samples from the biodegradation experiments were analyzed by an Agilent 1260 series HPLC with an Agilent Eclipse XDB-C18 column (4.6 × 150 mm2, 5 μm particle size) and an UV-vis detector using a methanol and water mixture (v/v, 90
:
10) as the mobile phase at a flow rate of 1 mL min−1. All samples were determined in triplicate. The excitation wavelength of phenanthrene was 250 nm, while the retention time was 3.2 min; the wavelength of pyrene was 234 nm and retention time was 4.5 min.
2.2.5. Effect of erythromycin on bacterial cell biomass. Growth of strains GY2B and CP13 in the presence of different concentrations of erythromycin (listed in Section 2.2.4) was studied on solid agar plates (1.8% agar). At specific time intervals, 1 mL of culture solution was removed from the reaction system (20 mL) of each flask. Three dilution gradients were set up for each culture and each diluent repeated in triplicate. Plates were then incubated at 30 °C for 72 h and the number of colonies was recorded.
2.2.6. Statistical analyses. All experimental data were analyzed with Origin 8.0. Means and standard values of triplicates were calculated. SPSS 19.0 was used for statistical evaluation. The results were conducted with three-way analysis of variance (ANOVA). Significance P value was calculated to assess statistical differences between diversity variables (the strains, times, and erythromycin concentrations) and total SOD activity and LDH activity. Evaluations were based on a 5% significance level. A P value of <0.05 was considered statistically significance.
3. Results and discussion
3.1. MICs of erythromycin on GY2B and CP13 proliferation
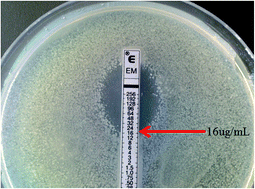
MIC was reported as the lowest concentration of antibiotic that inhibited 99.9% visible bacterial growth after overnight incubation.27,28 The range of antibiotic concentrations used for determining MIC was achieved by doubling-dilution steps up and down from 1 mg L−1 as required.29 The MIC values of erythromycin on GY2B and CP13 were, respectively, 0.25 mg L−1 (Table 1) and 16 mg L−1 (Fig. 1) as measured in the E-test susceptibility experiment. Five other antibiotics were also used in susceptibility testing and the results are presented in Table 1. The MIC of GY2B (0.25 mg L−1) indicated that GY2B was sensitive (susceptible, S) according to the American Society of Clinical and Laboratory Standards Institute (CLSI) guidance and standards (S ≤ 0.5 mg L−1, R ≥ 8 mg L−1) while the CP13 result (16 mg L−1) indicated resistance (resistant, R). The results also showed that erythromycin had toxic effects on the strains at concentrations higher than the MICs.
Table 1 Resistance and MIC of GY2B on 6 antibioticsa
Antibiotic strip (mg L−1) |
MIC (mg L−1) |
S |
R |
Sensibility |
S stands for sensitive, R stands for resistance. |
Erythromycin (0.016–256) |
0.25 |
≤0.5 |
≥8 |
S |
Chloromycetin (0.016–256) |
8 |
≤8 |
≥32 |
S |
Gentamycin (0.016–256) |
3 |
≤4 |
≥8 |
S |
Norfloxacin (0.016–256) |
2 |
≤4 |
≥16 |
S |
Ofloxacin (0.002–32) |
0.5 |
≤2 |
≥8 |
S |
Tetracycline (0.016–256) |
0.5 |
≤4 |
≥16 |
S |
 |
| Fig. 1 The MIC of erythromycin to CP13. | |
3.2. Antibacterial curves
The proliferation of GY2B at low and high erythromycin concentrations is shown in Fig. 2. The inhibition effect is not obvious at less than 0.25 mg L−1 concentration, but the inhibition rate increased notably as erythromycin concentration increased to 50 mg L−1. Between 0.25 mg L−1 to 50 mg L−1 erythromycin, inhibition showed significant concentration–effect relationship for its ecological toxicity. A similar dose-related inhibitory effect of erythromycin on Synechocystis sp. was observed by Pomati.30 The effect of erythromycin concentrations on inhibition at 48 h was somewhat less than at 24 h. This may relate to the adaptability of GY2B in the erythromycin environment. GY2B inhibition rate is 99.9% at 25 mg L−1 erythromycin after culture for 24 h. According to CLSI standards, GY2B is sensitive to erythromycin when exposure time is 24 h but the sensitivity declines at longer times. The effect of different concentrations of erythromycin on inhibition rate at 48 h is lower than at 24 h indicating that the therapeutic properties will weaken over time. The biomass of GY2B was seriously inhibited at 24 h due to erythromycin toxicity, but growth increased relatively quickly at 24–48 h, which was also consistent with LDH activity (see Section 3.4). This result is consistent with the adaptability of GY2B to erythromycin environments, as reported by Abraham et al.31
 |
| Fig. 2 Effect of erythromycin concentration on GY2B growth after 24 h and 48 h. | |
The inhibition rate of CP13 was closely related to erythromycin concentration, demonstrating a significant concentration–effect relationship (Fig. 3). Consistent with increased time, the inhibition of CP13 was significantly increased with the increasing erythromycin concentration. However, the inhibition effect was in the following order (low to high): 96 h < 72 h < 48 h < 24 h. Two factors may have influenced this finding: (1) erythromycin efficacy gradually declined, over time, at room temperature; (2) erythromycin was unstable in acidic conditions. Wu et al. reported that a variety of intermediate products such as 4,5-dihydroxypyrene, 4-phenanthrenecarboxylic acid, 4-phenanthrenol, 3,4-dihydroxyphenanthrene, 1-naphthol etc. are released during the biodegradation of pyrene by CP13.26 The accumulations of intermediate acid products promoted erythromycin decomposition over time. When the erythromycin concentration arrived at a maximum concentration (256 mg L−1), the inhibition rate of CP13 was only 85.7% (far less than the 99.9% MIC level) after 24 h incubation. Therefore CP13 has strong erythromycin resistance, which was very different from GY2B. This may be because CP13 possessed an erythromycin resistance gene selected during long-term exposure to adverse environment conditions (coking wastewater pollution). In contrast, GY2B was isolated from pure crude oil contaminated soil and lacked a resistant gene. Drug resistance of microorganisms is closely related to the presence of resistance genes. Resistance genes will increase significantly during long-term population exposure to environments with antibiotic stress. Furushita et al. and Heß et al. showed that microbes could obtain resistance genes through a variety of ways from surroundings.32,33 Microorganism with resistance genes could have increased drug tolerance and ultimately become drug-resistant strains.
 |
| Fig. 3 Effect of erythromycin concentration on growth of CP13 after 24 h, 48 h, 72 h and 96 h. | |
3.3. Effect of erythromycin on total SOD activity of GY2B and CP13
SOD is widely distributed in animals, plants and microorganisms and is important for in vivo antioxidant enzymes superoxide anion radicals.34 Analysis of total SOD activity was used to determine the effect of erythromycin on strain ability to resist toxic effects. As were displayed in total SOD activity was constant (8.05–8.7 U mL−1) and showed no obvious fluctuation at erythromycin concentrations within 0.25 mg L−1 for 24 h (Fig. 4a). This indicated that there was no significant effect on SOD expressed in GY2B when the erythromycin concentration was less than the MIC (0.25 mg L−1), including the antioxidant ability and resistance to decline. However, the total SOD activity decreased sharply to 0.96 U mL−1 from 8.84 U mL−1 at high erythromycin concentrations (Fig. 4b). Reactive oxygen species (ROS) are produced in the process of cellular metabolism and the generation and elimination of intracellular reactive oxygen species tends to reach a dynamic balance in normal cell proliferation and metabolism. An imbalance will lead to oxidative stress, which could cause reversible and irreversible damage to biofilms and enzymes and even cause cellular death.35 A comparison between the 48 h experiment group with 24 h showed that the total SOD at 48 h was greater than at 24 h within 1 mg L−1 erythromycin stresses. This may have resulted from proliferation of bacteria that remained dominant at low concentrations of erythromycin, and having little influence on SOD enzyme synthesis. However, the total SOD activity at 48 h was lower than 24 h inoculation at 1–50 mg L−1 erythromycin stress, which may be due to the inhibition of SOD synthesis at higher concentrations of erythromycin. Ribosomes are the sites of protein synthesis in both prokaryotic and eukaryotic cells. If ribosome function is damaged, proteins cannot be effectively synthesized and this will lead to cell death. Erythromycin can inhibit ribosomal translation and protein synthesis by preventing extension of block peptidyl tRNA (ptRNA) from the ribosome A site to the P-bit transposition, blocking ptRNA from the ribosome, and inhibiting the formation of the 50S ribosomal subunit.36 Therefore, the reduction of total SOD activity under erythromycin stress is the result of an inhibited ribosome translation process, which causes bacterial damage. CP13 also showed a similar relationship (Fig. 4c). A concentration-dependent relationship was demonstrated between reduced total SOD activity and erythromycin concentration. A higher erythromycin concentration was needed to decrease the SOD activity of CP13. These results are consistent with those described in Section 3.2 because the strains have different erythromycin MICs. GY2B is a sensitive strain and CP13 is a resistant strain. The SOD activity reduction indicates that the biotic community completed the logarithmic growth phase and entered a declining growth phase. The difference between the two strains illustrates the diversity of species survival abilities. To analyze SOD activity results, a three-way ANOVA was conducted using strain, time and erythromycin concentration. The results showed that all three factors produced significant effects (P < 0.05).
 |
| Fig. 4 Effects of erythromycin on total SOD activity of GY2B under low concentration of erythromycin (a) and high concentration of erythromycin (b), the total SOD activity of CP13 in a series of erythromycin concentrations (c). | |
3.4. Effect of erythromycin on LDH activity of GY2B and CP13
LDH is an enzyme that catalyzes lactate dehydrogenase into pyruvate and enters the tricarboxylic acid cycle. It plays a regulatory role in a series of respiratory reactions within the cell. LDH can adjust the ratio of NAD and NADH, in organisms whose survival depends on aerobic respiration. A series of aerobic biochemical reactions are influenced in the cell during the first stage.37 LDH activity at different erythromycin concentrations was measured to study the impact of antibiotics on aerobic respiration of microbes. LDH activity did not change significantly within 0.25 mg L−1 erythromycin (Fig. 5a), however, with increased erythromycin concentration, the LDH activity of GY2B after 24 h decreased sharply from 113.57 U L−1 to 55.98 U L−1 and the result of 48 h result was similar to that at 24 h. The LDH activity decreased from 150 U L−1 to 56.54 U L−1. LDH activity at 48 h was generally higher than at 24 h, probably because reasonable GY2B growth continued during the second day (24–48 h) under erythromycin stress and DNA replication requires more energy (ATP), leading to an increase of the LDH activity. The difference between total SOD activity and LDH activity reflects the selectivity of enzyme activity inhibition. In the process of inhibiting the translation of ribosomes, the erythromycin action site on the ribosomes is specific so that not all enzyme synthesis will be significantly inhibited.38 Erythromycin can interfere with glycolysis in aerobic respiration by reducing the LDH activity, but this effect can weaken over time. For pyrene degrading bacteria CP13 (Fig. 5b), the LDH activity gradually declined as erythromycin increased. As the erythromycin concentration exceeded 25 mg L−1, the LDH activity decreased sharply, but the value was still 60 U L−1 even when the erythromycin level reached 256 mg L−1. This demonstrated a strong ability to survive under the stress of high erythromycin concentration. For LDH activity, a three-way ANOVA was conducted using strain, time and erythromycin concentration. The results showing the three factors all had significant effects (P < 0.05).
 |
| Fig. 5 Effect of different concentration erythromycin on LDH activity of GY2B (a) and CP13 (b). | |
3.5. Effect of erythromycin on biomass of GY2B and phenanthrene degradation rate
CFU counts were made after direct exposure to different erythromycin doses. Fig. 6a illustrates the effect of erythromycin on GY2B biomass during the process of phenanthrene degradation. At 12 h, the growth of GY2B was little affected by erythromycin, probably because the growing bacteria were of the adaptive phase. However, cell growth decreased with increasing erythromycin concentrations after 12 h (Fig. 6a), probably due to the toxic effects of erythromycin that directly inhibited bacterial growth. Nie et al.,39 observed that erythromycin was highly toxic to microalgae like Pseudokirchneriella subcapitata in aquatic environments. Intermediate products in the phenanthrene degradation process such as 1-hydroxy-2-naphthoic acid, salicylic acid, and pyrocatechol may also be detrimental to GY2B growth as Tao reported.40 Moreover, the removal efficiencies of phenanthrene also decreased. The degradation rate of GY2B with no erythromycin (control group) was almost completely removed at 100 mg L−1 phenanthrene after 48 h, a result consistent with studies by Tao et al.,25 and suggesting that GY2B activity is good without exposure to erythromycin. However, the phenanthrene removal ratio decreased when the erythromycin concentration increased from 0 to 25 mg L−1 (Fig. 6b). Removal efficiencies of phenanthrene in the biodegrading system with 0.25, 1, 5, 10, 25 mg L−1 erythromycin were 97.85%, 85.48%, 79.84%, 57.53% and 12.63% at 48 h, which were decreases of 0.81–86.03% compared to the control (98.66%). These results clearly indicated that erythromycin inhibited phenanthrene degradation of GY2B. This may have resulted from two factors: (1) toxicity inhibited the growth of bacteria and the small number of active cells resulted in a lower degradation rate; (2) erythromycin impeded the translation process of ribosomes and protein expression was reduced. At the same time, total SOD and LDH activities also decreased, and thus the ribosome translation process may have been inhibited, reducing the expression of related proteins and diminishing the degradation ability of the bacteria.36
 |
| Fig. 6 Effect of erythromycin dosage on biomass of GY2B (a) and phenanthrene degradation (b). | |
3.6. Effect of erythromycin on biomass of CP13 and pyrene degradation rate
CP13 was used to study the effect of erythromycin on the biomass and biodegradation of pyrene. The cell densities at different concentrations of erythromycin are shown in Fig. 7a. The biomass of CP13 was inversely proportional to the erythromycin concentration. The SOD and LDH activities were similarly decreased (Fig. 4c and 5b), indicating that the cells were injured and growth was reduced by the antibiotic. The effect of erythromycin on pyrene degradation is illustrated in Fig. 7b. Degradation of 20 mg L−1 pyrene in the control group (no erythromycin) was 81.94% at 3 d incubation. Pyrene is more difficult to degrade than phenanthrene, so the growing cycle length and the degradation period of CP13 were longer than for GY2B. Increasing erythromycin concentration reduced the degradation rate of pyrene. When the concentration was 2–8 mg L−1, the degradation rate remained above 50%. At 16–256 mg L−1 erythromycin, degradation was less than 50%, but the degradation rate was 11.0% at 256 mg L−1 after 3 d. CP13 has good ability to degrade pyrene. We speculated that the mode of action of erythromycin on these two bacterial strains may differ. In addition to ecological toxicity, the action of erythromycin on GY2B was mainly via inhibition of physiological effects and related protein expression. For CP13, excessive levels of erythromycin seemed to hinder the solubilization and absorption of pyrene. The solubilization relationship between antibiotics and PAHs is a physical inhibition rather than physiological suppression.41 Physical tolerance of erythromycin in CP13 was ten times higher than GY2B, which indicates resistance genes that developed over long exposure to the multi-drug environment occupied by CP13. The tolerance differences between the two strains were discussed in Sections 3.2 and 3.3. Studies have reported that bacteria carrying resistance genes may migrate and transfer this resistance to different species via chromosomes, plasmids and other genetic factors.42 The spread of resistance genes indicates that the integrity and resistance of microbial communities could become significantly weaker as indigenous microorganisms are gradually replaced by antibiotic-resistant strains that evolved under the environmental antibiotic exposure.43–45
 |
| Fig. 7 Effect of different erythromycin concentrations on biomass of CP13 (a) and pyrene biodegradation (b). | |
4. Conclusions
The MIC of erythromycin to GY2B was 0.25 mg L−1 and the inhibition rate of GY2B growth was 99.9% in 25 mg L−1 erythromycin. Long-term exposure to less than 25 mg L−1 erythromycin reduced GY2B drug resistance. The MIC of erythromycin to CP13 was 16 mg L−1 and CP13 was very resistant to erythromycin. The concentration of erythromycin required to significantly inhibit pyrene degradation was higher than that needed to inhibit phenanthrene degradation. Reactive oxygen species caused cell damage by reducing bacterial SOD activity, which may be caused by erythromycin cytotoxicity. Erythromycin reduced the overall level of bacteria LDH activity and aerobic respiration. When erythromycin concentrations exceeded 16 mg L−1, the total SOD activity and LDH activity decreased, but the effect on CP13 was less than that on GY2B. Under erythromycin stress, GY2B biomass was reduced and phenanthrene degradation ability weakened illustrating concentration-dependent characteristics. CP13 and GY2B responses showed some similarities but the erythromycin modes of action on the two strains were differed. GY2B was sensitive to erythromycin but CP13 was considerably more resistant.
Acknowledgements
The authors are grateful to the National Natural Science Foundation of China (No. 41173104), the Science and Technology Planning Project of Guangdong Province, China (2016B020242004), and the Hi-Tech Research and Development Program of China (2013AA062609) for financial support of this study.
References
- K. D. Vandermeer and A. J. Daugulis, Biodegradation, 2007, 18, 211–221 CrossRef CAS PubMed.
- Z. Cui, G. Xu, W. Gao, Q. Li, B. Yang, G. Yang and L. Zheng, Int. Biodeterior. Biodegrad., 2014, 91, 45–51 CrossRef CAS.
- Y. Yang, N. Zhang, M. Xue, S. Lu and S. Tao, Environ. Pollut., 2011, 159, 591–595 CrossRef CAS PubMed.
- C. E. Cerniglia, Biodegradation, 1992, 3, 351–368 CrossRef CAS.
- O. Ojo, Afr. J. Biotechnol., 2006, 5, 333 CAS.
- S. Schwarz and E. Chaslus-Dancla, Vet. Res., 2001, 32, 201–225 CrossRef CAS PubMed.
- Q.-X. Zhou, Y. Luo and M. E. Wang, Asian J. Ecotoxicol., 2007, 2, 243–251 CAS.
- R. Hirsch, T. Ternes, K. Haberer and K.-L. Kratz, Sci. Total Environ., 1999, 225, 109–118 CrossRef CAS PubMed.
- M. Meyer, J. Bumgarner, J. L. Varns, J. Daughtridge, E. Thurman and K. A. Hostetler, Sci. Total Environ., 2000, 248, 181–187 CrossRef CAS PubMed.
- E. A. Frick, A. K. Henderson, D. M. Moll, E. T. Furlong and M. T. Meyer, Presence of pharmaceuticals in wastewater effluent and drinking water, metropolitan Atlanta, Georgia, 1999, p. 282 Search PubMed.
- M. H. Beare, R. W. Parmelee, P. F. Hendrix, W. Cheng, D. C. Coleman and D. Crossley, Ecol. Monogr., 1992, 62, 569–591 CrossRef.
- F. Liu, G.-G. Ying, R. Tao, J.-L. Zhao, J.-F. Yang and L.-F. Zhao, Environ. Pollut., 2009, 157, 1636–1642 CrossRef CAS PubMed.
- D. Li and W. Shi, Chin. J. Catal., 2016, 37, 792–799 CrossRef CAS.
- H. Sanderson, R. A. Brain, D. J. Johnson, C. J. Wilson and K. R. Solomon, Toxicology, 2004, 203, 27–40 CrossRef CAS PubMed.
- W.-D. Kong, Y.-G. Zhu, B.-J. Fu, P. Marschner and J.-Z. He, Environ. Pollut., 2006, 143, 129–137 CrossRef CAS PubMed.
- J. Wang, J. Liu, Z. Chen and Y. Kuang, Acta Ecol. Sin., 2005, 25, 279–282 CAS.
- E. Yabuuchi, I. Yano, H. Oyaizu, Y. Hashimoto, T. Ezaki and H. Yamamoto, Microbiol. Immunol., 1990, 34, 99–119 CrossRef CAS.
- M. Tauler, J. Vila, J. M. Nieto and M. Grifoll, Appl. Microbiol. Biotechnol., 2016, 100, 3321–3336 CrossRef CAS PubMed.
- B. She, X. Tao, T. Huang, G. Lu, Z. Zhou, C. Guo and Z. Dang, Ecotoxicol. Environ. Saf., 2016, 125, 35–42 CrossRef CAS PubMed.
- H.-P. Zhao, L. Wang, J.-R. Ren, Z. Li, M. Li and H.-W. Gao, J. Hazard. Mater., 2008, 152, 1293–1300 CrossRef CAS PubMed.
- M. A. Heitkamp, J. P. Freeman, D. W. Miller and C. Cerniglia, Appl. Environ. Microbiol., 1988, 54, 2556–2565 CAS.
- Y. Liang, D. R. Gardner, C. D. Miller, D. Chen, A. J. Anderson, B. C. Weimer and R. C. Sims, Appl. Environ. Microbiol., 2006, 72, 7821–7828 CrossRef CAS PubMed.
- A. Rein, I. K. Adam, A. Miltner, K. Brumme, M. Kästner and S. Trapp, J. Hazard. Mater., 2016, 306, 105–114 CrossRef CAS PubMed.
- J. Ma, L. Xu and L. Jia, Bioresour. Technol., 2013, 140, 15–21 CrossRef CAS PubMed.
- X. Tao, China Environ. Sci., 2006, 25, 190–195 CAS.
- F. Wu, M. Zhang, C. Guo, M. Chen and Z. Dang, Effect of sources on screening and degradation ability of PAHs-degrading bacteria, Chin. J. Environ. Eng., 2014, 8, 3511–3518 CAS.
- M. Popowska, M. Rzeczycka, A. Miernik, A. Krawczyk-Balska, F. Walsh and B. Duffy, Antimicrob. Agents Chemother., 2012, 56, 1434–1443 CrossRef CAS PubMed.
- L. Slaney, H. Chubb, A. Ronald and R. Brunham, J. Antimicrob. Chemother., 1990, 25, 1–5 CrossRef CAS PubMed.
- A. Pridmore, D. Burch and P. Lees, Vet. Microbiol., 2011, 151, 409–412 CrossRef CAS PubMed.
- F. Pomati, A. G. Netting, D. Calamari and B. A. Neilan, Aquat. Toxicol., 2004, 67, 387–396 CrossRef CAS PubMed.
- E. Abraham, D. Callow and K. Gilliver, Nature, 1946, 158, 818–821 CrossRef CAS PubMed.
- M. Furushita, T. Shiba, T. Maeda, M. Yahata, A. Kaneoka, Y. Takahashi, K. Torii, T. Hasegawa and M. Ohta, Appl. Environ. Microbiol., 2003, 69, 5336–5342 CrossRef CAS PubMed.
- S. Heß, F. Lüddeke and C. Gallert, Water Sci. Technol., 2015, 69, 243–251 Search PubMed.
- P. A. Belinky, D. Goldberg, B. Krinfeld, M. Burger, N. Rothschild, U. Cogan and C. G. Dosoretz, Enzyme Microb. Technol., 2002, 31, 754–764 CrossRef CAS.
- R. Mittler, Trends Plant Sci., 2002, 7, 405–410 CrossRef CAS PubMed.
- J. Retsema and W. Fu, Int. J. Antimicrob. Agents, 2001, 18, 3–10 CrossRef.
- R. Lapworth and A. C. Tarn, Ann. Clin. Biochem., 2006, 43, 17–22 CrossRef PubMed.
- J. Usary and W. S. Champney, Mol. Microbiol., 2001, 40, 951–962 CrossRef CAS PubMed.
- X.-P. Nie, B.-Y. Liu, H.-J. Yu, W.-Q. Liu and Y.-F. Yang, Environ. Pollut., 2013, 172, 23–32 CrossRef CAS PubMed.
- X. Q. Tao, G. N. Lu, Z. Dang, C. Yang and X. Y. Yi, Biochemistry, 2007, 42, 401–408 CAS.
- T. Loftsson and M. E. Brewster, J. Pharm. Sci., 1996, 85, 1017–1025 CrossRef CAS PubMed.
- A. W. Brown, S. C. Rankin and D. J. Platt, FEMS Microbiol. Lett., 2000, 191, 145–149 CrossRef CAS PubMed.
- R. P. Novick, Ann. N. Y. Acad. Sci., 1981, 368, 23–60 CrossRef CAS PubMed.
- G. W. Sundin, D. E. Monks and C. L. Bender, Can. J. Microbiol., 1995, 41, 792–799 CrossRef CAS PubMed.
- S. W. Mamber and S. E. Katz, Appl. Environ. Microbiol., 1985, 50, 638–648 CAS.
|
This journal is © The Royal Society of Chemistry 2016 |
Click here to see how this site uses Cookies. View our privacy policy here.