DOI:
10.1039/C6RA23933A
(Paper)
RSC Adv., 2016,
6, 112340-112355
An integrated salinity-driven workflow for rapid lipid enhancement in green microalgae for biodiesel application
Received
26th September 2016
, Accepted 21st November 2016
First published on 21st November 2016
Abstract
A laboratory based integrated approach was undertaken for improvement of lipid accumulation in green microalgae under sodium chloride (NaCl) stress. The maximum biomass yields (1.22 ± 0.04 g L−1 in Chlorella and 1.31 ± 0.04 g L−1 in Chlorococcum) were obtained in the media with initial NaCl concentrations at 2 g L−1 (for Chlorella) and 0.05 g L−1 (for Chlorococcum) after 14 days of culture. Interestingly, maximum lipid accumulation obtained was 45.8 ± 0.4% w/v for Chlorella (on day eight) and 36.33 ± 0.56% w/v for Chlorococcum (on day ten) at an exposure of 5 g L−1 and 1.5 g L−1 NaCl concentrations, respectively. Fatty acid profiles of methyl esters for neutral and polar lipid fractions showed the presence of myristic (C14:0), palmitic (C16:0), palmitoleic (C16:1), oleic (C18:1) and linoleic (C18:2) acids as major fatty acids. Fluorescence intensities (% positive Nile red stained cells) of neutral and polar lipid fractions were also higher in NaCl stress conditions. A significant correlation between polar lipid and neutral lipid was found in both Chlorella (r2 = 0.979) and Chlorococcum (r2 = 0.972). Flow cytometric study demonstrated a positive fluorescence signal for neutral and polar lipid bodies related to Nile red fluorescence. Associated biochemical changes, like those in total chlorophyll, carotenoid, carbohydrate and protein contents, were determined under variable NaCl concentrations. The elemental compositions (CHNS) and CO2 fixation rate were assessed using high lipid yielding cells under optimum NaCl concentrations. Biodiesel fuel properties were obtained from high lipid yielding cells of the test microalgae and compared with Indian and international diesel standards. Finally large-scale cultivation of Chlorella ellipsoidea was performed in a hybrid photobioreactor (800 L capacity) and the highest biomass and lipid content obtained was 1.66 ± 0.09 g L−1 (at 8 days) and 54.73 ± 1.78% w/v (at 10 days) at 5 g L−1 NaCl respectively. This optimized NaCl concentration makes it an economical substitute for biodiesel production on a large scale.
Introduction
Lipids form an important group of macromolecules, playing vital roles in cellular organization and structure, energy resources, signal transduction, cell trafficking and sorting of other macromolecules to specific target sites.1,2 Microalgae are able to synthesize a variety of lipids, including storage and structural lipids. These structural lipids are mainly composed of membrane phospholipids and glycolipids. The storage lipids occur in the form of triacylglycerol (TAGs) that can be converted to biodiesel as fatty acid methyl esters (FAMEs) through transesterification.3 Microalgae can synthesize and accumulate lipids up to 50–70% of dry cell weight. Applying biotic and abiotic stresses such as limitation of nutrients, pH, temperature, light and dark cycle, and salinity stress can increase total lipid content, as well as the accumulation of TAGs. Nutrient starvation is one of the key factors regulating lipid metabolism in microalgae. TAG accumulation in microalgae was found to be influenced by nutrient factors such as nitrogen, phosphorous, sulphur, silicon, iron and copper, and heavy metals such as cadmium.4,5 Several researchers also reported salinity-induced lipid accumulation and other biochemical changes in microalgae (Table 1). Overall biochemical profiles of microalgal cells are influenced by several environmental factors, viz. light intensity, temperature, pH, nutrients and salinity level. In addition to growth rate and lipid productivity, other biochemical parameters like protein, carbohydrate, chlorophyll, carotenoids are also affected by different stress factors. Salinity is one of the most important factors regulating total cellular metabolism and growth in microalgae and plants.11,12
Table 1 Examples of salinity-induced variations in biochemical compositions of algal cells
| Algal taxa |
Salinity (NaCl) |
Result |
Reference |
| Dunaliella tertiolecta |
1.0 M |
67–70% oil accumulation |
6 |
| Dunaliella sp. |
|
Higher SFAs + MUFAs |
7 |
| Lower PUFAs |
| Nitzschia laevis |
10–20 g L−1 |
Higher degrees of unsaturation in polar and neutral lipids |
8 |
| Higher production of eicosapentanoic acid [20:5 (n − 3)] |
| Crypthecodinium cohnii |
5 g L−1 |
Higher production of total free sterols and DHA (131.55 mg L−1) |
9 |
| Scenedesmus obliquus |
0.3 M |
Oil production maximizing at 36% dcw after 15 days of growth |
10 |
| Thalassiosira weissflogii |
25 psu |
Protein-352 mg g−1 |
12 |
| Carbohydrate-256 mg g−1 |
| Lipid-249 mg g−1 |
| Scenedesmus quadricauda |
1 mM |
Protein-0.027 mg mL−1 |
13 |
| Carbohydrate-0.069 mg mL−1 |
| 0.0 mM |
Chlorophyll-20.04 μg mL−1 |
The effect of salinity on algal elemental composition (CHNS) has not been studied so far. Dineshkumar et al.14 reported elemental compositions of Chlorella minutissima in sparged CO2 and flue gas aerated culture. In the present investigation optimum concentration of NaCl was used to analyze the elemental composition. The CO2 fixation rate in microalgae is one of the most important criteria for CO2 mitigation. Carbon di-oxide mitigation strategy using microalgae has been studied by several researchers.14,15 However, the study presented herein demonstrated salinity induced CO2 fixation by microalgae, a topic not previously reported on.
Several analytical methods are applicable to analyze microalgal lipids. Such methods include gravimetric determination, Nile red (9-diethylamino-5H-benzo[a]phenoxazine-5-one) and BODIPY (4,4-difluoro-1,3,5,7-tetramethyl-4-bora-3a,4a-diaza-s-indacene) staining methods, fluorescence activated cell sorting (FACS), thin-layer chromatography (TLC), capillary gas chromatography-flame ionization detection (GC-FID), liquid chromatography-mass spectrometry (LC-MS), high-performance liquid chromatography (HPLC), ultra-performance liquid chromatography mass-spectrometry (UPLC-MS) etc.5,16–18 Flow cytometry is considered to be the most promising tool for its ability to provide information of living single cells. It uses a fluorescent probe with an excitation and an emission signals to detect the cell complexity and morphology. Nile red is the most commonly used lipophilic fluorescent probe to detect neutral lipid bodies in microalgal cells.4,5 The cellular features correlate with the scattering signals, viz., forward scatter (FSC) and side scatter (SSC) signals. Fourier transform infrared spectroscopy (FTIR) is another spectroscopic method for rapid screening of biochemical components in algae. It is fast, direct and non-destructive compared to other traditional chemical extraction methods.19 The FTIR analysis of algal biomass has been successfully used in nurturing biochemical changes in microalgae.20 In the present investigation we used high lipid containing algal biomass to detect the presence of lipid classes and furthermore protein, carbohydrate etc., in the stressed sample. We demonstrated FTIR for rapid screening of functional groups of lipids and other bioactive molecules in salinity stressed microalgae. The FTIR spectra obtained for each algal species provided a distinct “fingerprint” for unique biochemical composition.
Different concentrations of NaCl were applied on cells (log exponential phase) of two green microalgae Chlorella ellipsoidea and Chlorococcum infusionum to observe the accumulation of enhanced neutral and polar lipid. An integrated approach, including chemical extraction, spectroscopy, chromatography, confocal-microscopy and cytometry, was conducted to analyze changes in cellular lipid content. Nile red dye was used as a fluorescent probe to visualize accumulated neutral lipids in cell cytoplasm and polar lipid in the membrane. This process was non-destructive, and required less energy, time and biomass material than conventional methods. Profiling of lipophilic pigments, biochemical and elemental compositions, and diesel fuel properties of the cellular contents were conducted under variable NaCl concentrations. Subsequently the CO2 fixation rate was determined at elevated NaCl concentrations. Photobioreactors (PBRs) or open raceway ponds, commonly used for large-scale cultivation of microalgae such as Chlorella vulgaris and C. sorokiniana for biodiesel production,21,22 are advantageous for several reasons, the most important being controlled environment, optimum space utilization and integrated feeding/harvesting process.23 Based on the present findings, optimized NaCl stress condition was applied to an open-closed hybrid PBR of 800 L capacity for large scale cultivation of C. ellipsoidea for biodiesel production.
Materials and methods
Algal strains and culture conditions
Two microalgae Chlorella ellipsoidea and Chlorococcum infusionum were collected from distinct habitats of Sundarbans Biosphere Reserve of the Indian sub-continent and isolated in axenic cultures under controlled laboratory conditions.4 Chlorella and Chlorococcum were respectively cultured in Zarrouk's medium and modified Bold Basal Medium (BBM).24,25 Both the cultures were maintained at 22 °C in 16![[thin space (1/6-em)]](https://www.rsc.org/images/entities/char_2009.gif) :8 light–dark cycles under vigorous shaking of 120 rpm in Eyla horizontal shaker-incubator (Eyla, Japan) for 2–3 hours per day.
:8 light–dark cycles under vigorous shaking of 120 rpm in Eyla horizontal shaker-incubator (Eyla, Japan) for 2–3 hours per day.
Preparation of culture media
To investigate the effect of salinity on growth and lipid accumulation, modified Zarrouk's and BBM media with ten different concentrations of NaCl was used in this study including 0, 0.025, 0.05, 0.1, 0.5, 1, 1.5, 2, 2.5 and 5 g L−1 for Chlorella and Chlorococcum respectively. For determination of growth and lipid accumulation under various concentrations of NaCl, the microalgal cells were harvested at 2 days interval for 30 days.
Growth at different concentrations of NaCl
Growth was measured in terms of dry cell weight (dcw). Aliquots of 50 mL of culture were harvested at 2 days intervals for 30 days. The microalgal cells were centrifuged at 10000 rpm for 5 min and pellet was washed 2–3 times with double distilled water to remove excess salts. The pellets were then dried into pre-weighed vials in hot air oven at 70 °C until the water was completely removed, indicated by attainment of constant pellet weight. The biomass yield was calculated by gravimetric method in terms of g L−1.3
Lipid extraction and quantification
Lipids accumulated by microalgal strains under control and treated conditions were analyzed in two fractions viz., neutral and polar. Gravimetric extraction and quantification of lipid classes were carried out according to the methods described by Satpati et al. and Alves Sobrinho et al.3,5,26 All experiments were performed in triplicate. The extracted lipid was quantified by calculating the difference between the weights of the original and final tubes.
In mass cultivation, volumetric productivity of cellular lipid was calculated as
| p = (Ct × Bt − Ct-2 × Bt-2)/2 |
where Ct and Ct-2 are cellular lipid contents (% dcw) after and before day intervals; and, Bt and Bt-2 are corresponding biomass concentrations (g L
−1).
Fatty acid profiling
The lipid sample was first converted to FAMEs by transesterification reaction according to the standardized method described in previous studies.3,5,26,27
Staining procedure
The microalgal cells were stained with lipophilic fluorescent probe Nile red (Sigma-Aldrich, St. Louis, MO) using optimized protocol of our previous work.4,5
Flow cytometric analysis
The cytosolic neutral lipids were analyzed by FACS Verse flow cytometer (Beckton Dickinson Instrument). The fluorescence for both the unstained and Nile red stained cells were measured using excitation wavelength of 488 nm solid state argon-ion laser. The optical system used in the cytometer collects emission of light spectrum at PE-A and PerCP-A signals for both neutral and polar lipids. These wavelengths are similar to the Nile red emission in neutral (580–586 nm) and in polar lipid fractions (610–700 nm). Single cell information including granularity, cell size and morphology were determined from the scattered plot of PE-A (on y-axis) vs. PerCP-A (on x-axis) for both neutral and polar lipids. The data were expressed as fluorescence arbitrary units and % fluorescence intensity (% grandparent) of positive stained cell populations.
Lipids fluorescence intensity in green microalgae
The fluorescence intensity of cytosolic neutral lipid and membrane polar lipid distribution in microalgal cells were examined by staining with Nile red fluorescent dye using FACS Verse flow cytometer at PE-A and PerCP-A signal. The percentage of positively stained cells (% fluorescence intensity) was calculated using Flow view statistical software.
Confocal microscopy
Both the cellular neutral and polar lipids were observed by confocal microscope (Olympus IX 81) equipped with Flow view 1000 software. The excitation and emission wavelengths were set to 470 nm and 530–630 nm range for neutral lipid. Simultaneously, for polar lipid, the excitation and emission length was set to 470 nm and 600–700 nm. The slides were prepared using 10% glycerin (v/v) and observed under the microscope. The photographs of bright and colored fields were taken in 20×, 40× and 100× objectives.
FTIR analysis
Algal biomass containing highest lipid was taken for FTIR analysis. The samples were prepared according to the optimized protocol of Satpati et al.5 All spectra were collected in Perkin Elmer Spectrum Express, Version 1.03.00 (Perkin Elmer, USA).
Analytical procedures
Total chlorophyll. The total chlorophyll was extracted using chilled methanol (80%, v/v) and estimated according to Arnon.28
Total carotenoid. The total carotenoid content was extracted and estimated according to Davies' absorbance method.29
Total carbohydrate and protein. Total carbohydrate content was estimated by anthrone–sulfuric acid method against standard glucose solution.30 Lowry conducted the estimation of total protein with Folin–Ciocalteau's reagent.31
Elemental analysis. High lipid containing microalgal biomass was taken for elemental composition (CHNS) analysis using a Vario MACRO Cube elemental analyzer (Elementar Analysensysteme GmbH, Germany make). The empirical chemical formula used for microalgal biomass is CH1.83N0.11O0.48P0.01.32
Carbon dioxide (CO2) fixation rate. The carbon dioxide fixation rate in high lipid containing microalgal biomass was determined by the equation:14
| CO2 fixation rate (g L−1 d−1) = carbon content (%) × biomass productivity (g L−1 d−1) × 44/12 |
Determination of diesel fuel properties
Iodine value. The titrimetric method described by American Oil Chemist's Society (AOCS) was used to determine iodine value (IV) in the test microalgae.32
Cetane number. The cetane number (CN) was calculated using the formula described by Krisnangkura.33
Acid value. The acid value (AV) was calculated using titrimetric method followed by European standard EN14104.34
Calorific value. The calorific value was determined by bomb calorimeter (Oxygen Bomb Calorimeter – ATB-07, Eastern Instruments, Kolkata, India) in association with ASTM D 240-02 standard.35
Saponification value. The saponification value (SV) was calculated by titrimetric method as described by Vicente et al.36
Ash content. The ash content was calculated by the formula given in ASTM D 482-74.35
Water content. Water content of biodiesel was determined by Karl Fischer titrimetric method using Karl Fischer titrant solution.37
Determination of viscosity. The kinetic viscosity was determined using a Cannon Fensky viscometer tube in a kinetic viscometer bath.
| Kinetic viscosity (V) = C × t, |
where C = calibration constant of the viscometer (0.0336 cSt s−1) and t = flow time.
Determination of density. The density was calculated using the standardized protocol described in ASTM D 4052-96.35
Cultivation of Chlorella in open-closed hybrid PBR
Zarrouk's medium modified with 5 g L−1 NaCl was prepared to cultivate Chlorella in large-scale reactor. The pH of the medium was adjusted to 8.2. The culture was inoculated at 30–40% (v/v) into the hybrid PBR of 800 L capacity and the final volume was made up to 300 L. The headspace of 500 L was kept to prevent contamination. In this study, we standardized that 70% open headspace (here 500 L) gave maximum growth for green microalgae. The light could also been penetrated better in small culture working volume. A stainless steel paddle was fixed at the level of 500–600 L culture volume for proper mixing of the culture and air present in the headspace region of the reactor. The hybrid photobioreactor is an open-closed modified cost-effective reactor, which can be used for both open (raceway pond) and closed (PBR) culture system. In this reactor, a folding lid was made to make it open or closed. The system was designed so far for proper light penetration in a control way. It prevents excessive heat or cold during cultivation technique. The paddle was set to 20 rpm to provide aeration for 6–7 hours daily during daytime. Cultures were monitored regularly and biomass was harvested at 2 day intervals for 30 days. The dried biomass was analyzed for lipid yield and volumetric productivity. This cultivation process was repeated twice for control and stress condition.
Data analysis
The mean value of at least three replicates was represented in all growth and analytical experiments. The least significant differences were calculated at p ≤ 0.05 using One-way Analysis of Variance (ANOVA). The linear regression equations and “r” values for neutral lipid vs. polar lipid fluorescence intensity were calculated using Microsoft Office Excel 2007 (Microsoft Corporation, Redmond, WA). The mean, median, standard deviation (SD) and coefficient of variation (CV) of positively stained cells were calculated by Flow view statistical software (Beckton Dickinson Instrument).
Results and discussion
Effect of NaCl on growth and total lipid accumulation
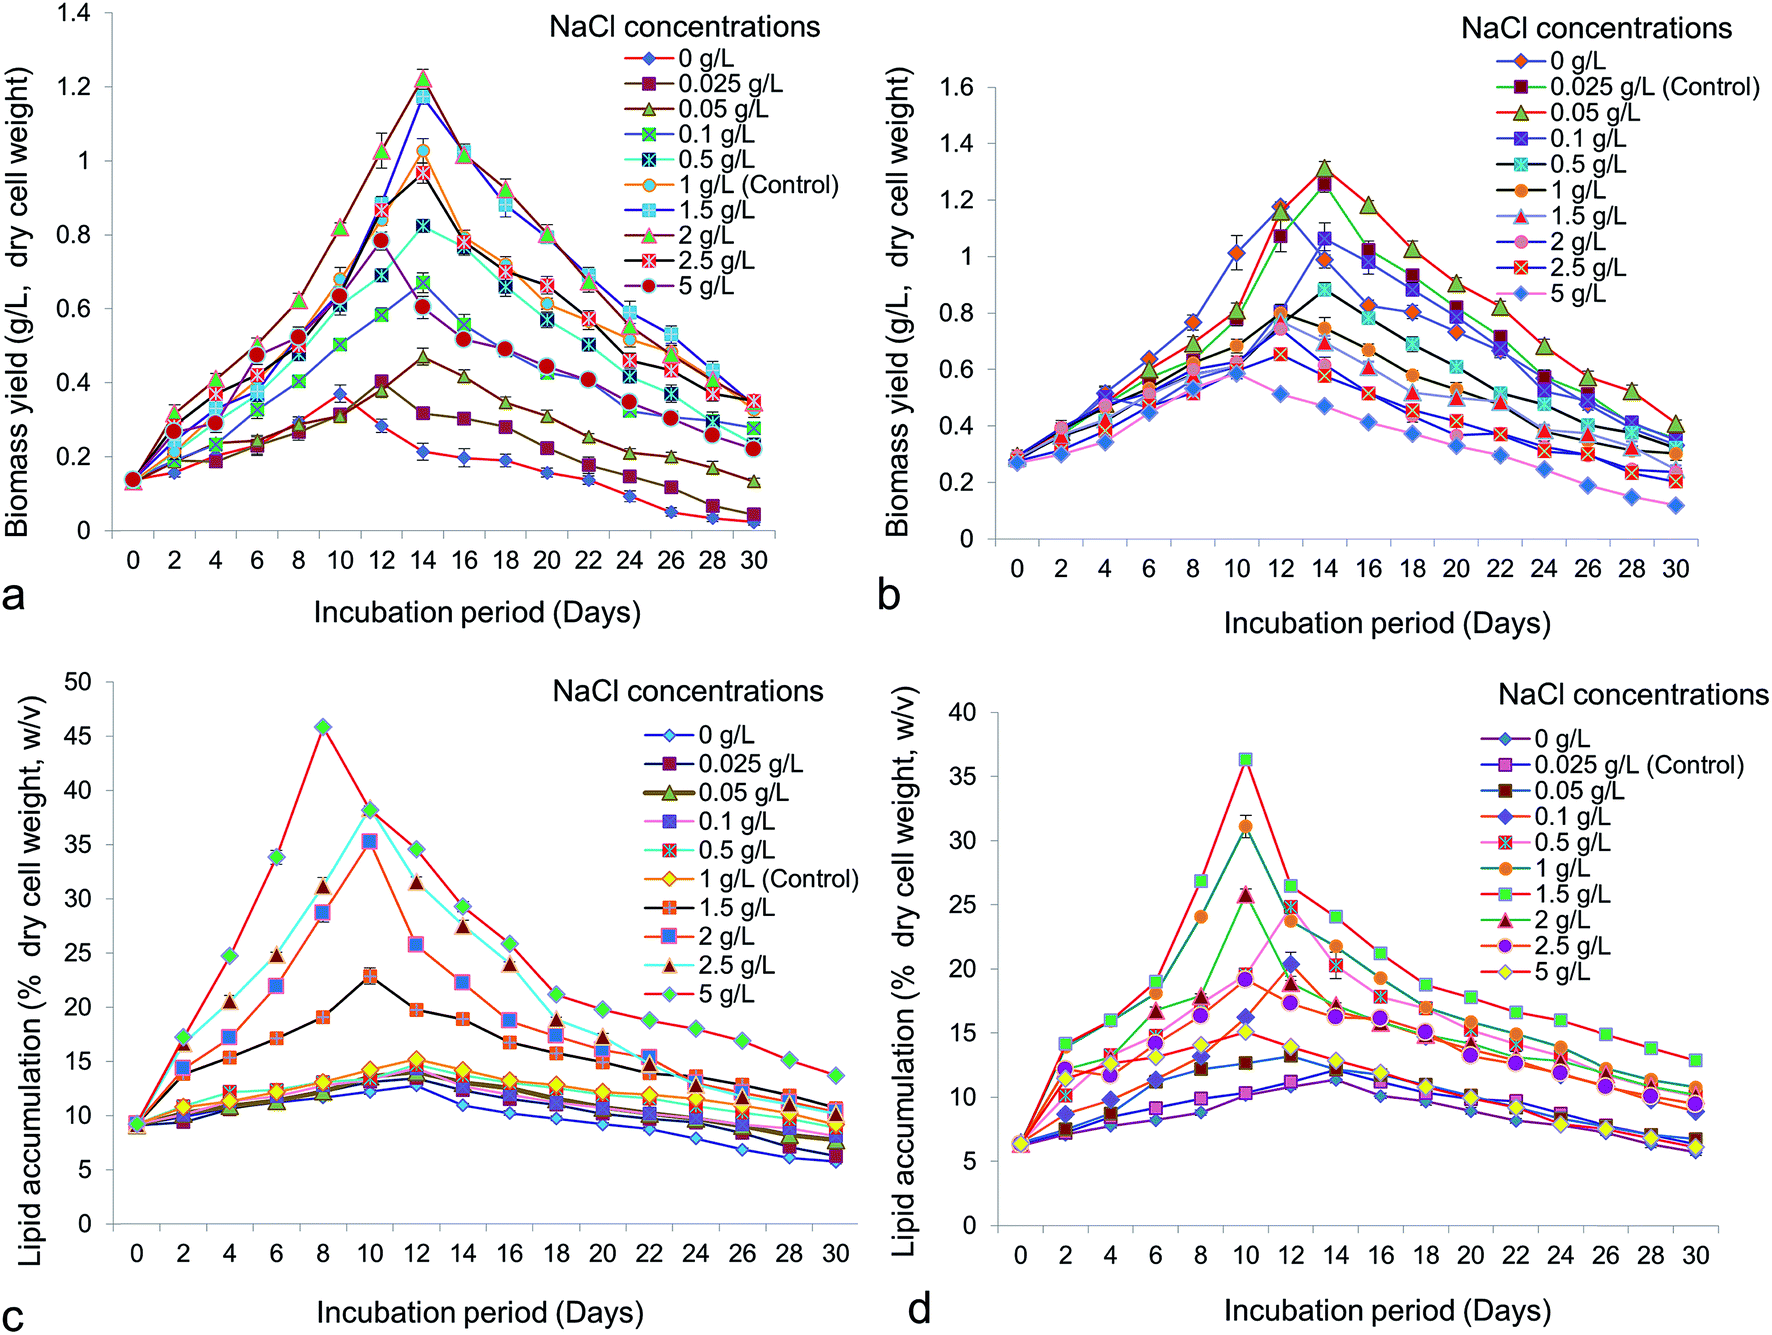
Cell growth is the most important factor for selection of potential microalgae for promising bioprospection. One of the most important environmental factors influencing growth and lipid accumulation in microalgae is salinity. Accelerated growth of both Chlorella (Fig. 1a) and Chlorococcum (Fig. 1b) was obtained with increasing concentrations of NaCl. Both microalgae showed logarithmic growth within a time period of 10–18 days. Maximum growth obtained in Chlorella was 1.22 ± 0.04 g L−1 at 2 g L−1 of NaCl whereas in Chlorococcum it was 1.31 ± 0.04 g L−1 at 0.05 g L−1 of NaCl, both after 14 days of incubation. A rise in initial concentration of NaCl from 0.05 g L−1 to 5 g L−1 increased the lipid accumulation upto 45.8 ± 0.4% w/v in Chlorella (Fig. 1c). However, total lipid accumulation in Chlorococcum was raised to 36.33 ± 0.56% w/v at 1.5 g L−1 NaCl (Fig. 1d). Since both the test microalgae were brackish water strains, it was interesting to analyze their growth patterns in fresh water medium (BBM) supplemented with various levels of NaCl. The growth of Scenedesmus obliquus was reported to be retarded above NaCl concentration of 0.6 M.10 Higher biomass productivity was observed at the concentrations of 0.05–0.1 M NaCl in the culture medium indicating tolerance of Scenedesmus almeriensis to salt.10 Ruangsomboon reported that high salinity stress increased growth and lipid content in Botryococcus braunii.38 Takagi et al. asserted that the cell growth of Dunaliella was markedly inhibited by 1.5 M NaCl.6 Increasing NaCl concentrations from 0.5 to 1.0 M resulted in a higher intracellular lipid accumulation (70%) in Dunaliella.6 Increasing NaCl concentration did not affect the cell growth of Chlorella whereas the cell concentration of Chlorococcum decreased at NaCl concentrations above 0.05 g L−1. Barros et al. investigated three different concentrations of NaCl (15, 25 and 35 psu) on growth and lipid accumulation in marine microalga Chaetoceros muelleri and obtained maximal lipid accumulation of 12.33 ± 1.81% at 35 psu NaCl.39 The cell concentrations were significantly higher than control at 15 and 25 psu NaCl, which were 16.3 ± 1.50 and 17.6 ± 2.90 × 10⁵ cells per mL respectively. Garcia et al. reported maximum cell density of Thalassiosira weissflogii at 25 psu NaCl, though lipid content reportedly decreased with increase in NaCl concentration from 25 to 35 psu.12 The maximum lipid yield in Chlorella vulgaris and Scenedesmus obliquus were reported as 39.1 ± 0.7 and 38.7 ± 0.6% (dry cell weight) respectively, under 5 g L−1 of NaCl.40 Maximum oil accumulation up to 36% (dcw) was observed in the S. obliquus culture supplemented with 0.3 M NaCl.10 Under nutrient stress, nicotinamide adenine dinucleotide phosphate (NADP+) is consumed by fatty acids and thus growth was inhibited.41 Under NaCl stress, major electron acceptor for light and dark reaction of photosynthesis, NADP+, became depleted due to fatty acid synthesis. Increased fatty acid production reduces the growth of microalgae under growth limiting conditions.41 It has also been proposed, that biosynthesis of fatty acids can be regulated by two major enzymes viz., acetyl CoA carboxylase (ACCase) and fatty acid synthase (FAS) under growth limiting condition. The activity of ACCase increased under NaCl stress, which triggers the accumulation of adenosine-tri-phosphate (ATP) and NADP+ leading to synthesize excess malonyl-CoA, into the lipid biosynthesis pathway. In the other way intermediate acyl carrier protein (ACP) and FAS can stimulate free fatty acid (FFA) formation into the cytosol that can ultimately leading to form membrane lipid (polar lipid) and cytosolic neutral lipid body (TAG).42
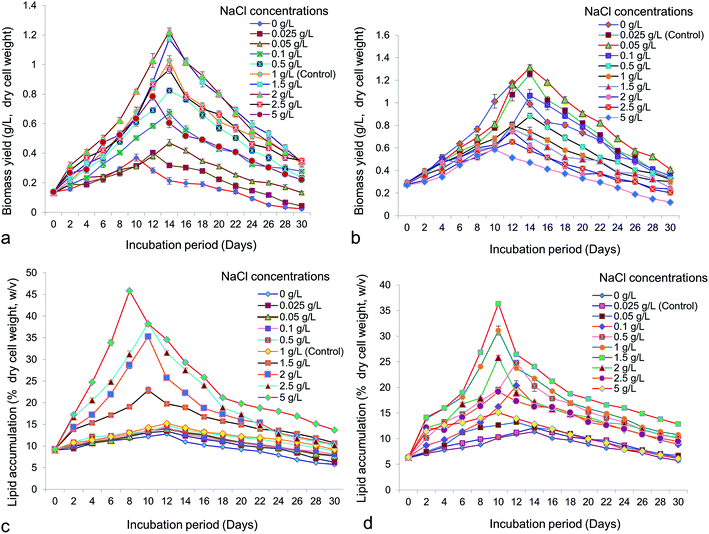 |
| | Fig. 1 Biomass yield (g L−1, dry cell weight) of (a) Chlorella ellipsoidea and (b) Chlorococcum infusionum at different NaCl concentrations (p < 0.05); lipid accumulation (% dry cell weight, w/v) of (c) Chlorella ellipsoidea and (d) Chlorococcum infusionum at different NaCl concentrations (p < 0.05). | |
Analysis of fatty acid methyl esters (FAMEs)
The major fatty acid compositions of the studied microalgae were determined by gas chromatography-mass spectrometry (GC-MS). The most abundant fatty acids were grouped as SFA, MUFA and PUFA (Table 2). The present study showed that the lipid of both Chlorella and Chlorococcum contained seventeen fatty acids with a significant variation of SFA, MUFA and PUFA contents. The high percentage of lipid containing cells (45.8 ± 0.4% in Chlorella and 36.33 ± 0.56% in Chlorococcum) were analyzed for preparation of FAME and showed significant increase of C16 and C18 fatty acids for both neutral and polar lipid fraction. It has earlier been reported that Chlorella and Chlorococcum showed a dominance of C16 and C18 fatty acids.3 PUFA was significantly decreased in polar and neutral lipid fraction of Chlorococcum and polar lipid fraction of Chlorella respectively. The changes in fatty acid compositions of both neutral and polar fractions were studied separately (Table 2). However, PUFA was increased in neutral lipid fraction of Chlorella than control. Unsaturated fatty acids are known to influence the chemical and physical properties of the cell like cell permeability and membrane stability.26 C18 and C22 PUFAs were increased in Isochrysis cells with elevated concentrations of NaCl in the medium.44 The present study showed subsequent increase of C18:2 PUFA in neutral lipid fraction of Chlorella and Chlorococcum. Interestingly, neutral fraction of C18:3 PUFA was enhanced in Chlorella but completely disappeared in Chlorococcum. It has also been reported that C18:5 and C22:6 levels decreased in Isochrysis cells at elevated NaCl in the culture.11 Wang et al. reported that fatty acids can serves as biomarkers for quantification of neutral lipid in microalgae.18 Changes in fatty acid compositions in neutral fraction of Chlorella under control vs. treated conditions showed significant increase in SFA, MUFA and PUFA respectively by 41.12 ± 1.56%, 35.38 ± 1.82% and 21.50 ± 1.42% at 5 g L−1 NaCl. Palmitic, palmitoleic, stearic, oleic, linoleic, α-linoleic acid and paullinic acid together constitute more than 70% of the total fatty acids in NaCl treated Chlorella cells. Interestingly, presence and absence of margaric acid (C17:0) and arachidic acid (C20:0) were subsequently found in NaCl treated cells of Chlorella. In Chlorella, total fatty acid content in neutral lipid fraction was increased to 98% in 5 g L−1 NaCl from 70.39% in control biomass. Neutral lipid fraction in Chlorococcum showed abundance of C14, C16, C18 and C20 chain length fatty acids. It also showed significant increase (p < 0.05) in SFA (>10%) and MUFA (>11%) but decrease in PUFA (>15%) (Table 2). The increase in SFA and MUFA but reduction in PUFA was already described in Tetraselmis suecica in response to culture condition.45 The total fatty acid content in neutral lipid fraction of Chlorococcum was enhanced to 99.76% in 1.5 g L−1 NaCl than control (93.06%). Theoretically it is considered that increase or decrease of unsaturated fatty acids serves to maintain the membrane fluidity and regulates the cell osmoticum even at high NaCl concentrations.46 The effects of NaCl on Dunaliella and Nannochloropsis showed lower degree of unsaturation of lipids.7,47,48 Boekelovia hooglandii showed decrease of C14 and C16 long chain fatty acids with an increase of NaCl in the culture medium.46 On the other hand C18:4, C20:5, C22:5 and C22:6 PUFA were gradually increased with increasing in NaCl concentrations.46 The fatty acid compositions of polar fractions showed a significant change in SFA, MUFA and PUFA for both Chlorella and Chlorococcum. The irradiation and cellular growth are two most key factors stimulate fatty acid compositions in microalgae. The low availability of nutrients in the culture media stops the cellular adaptation to condition of limited growth and high lipid yield.45 As shown in Table 2, SFA and PUFA were decreased to 0.5% and >5% in Chlorella whereas in Chlorococcum SFA was increased to >13% but PUFA was decreased to >11%. Decreases in photon flux density have been related to decrease in content in PUFAs in various species of green microalgae.45 In polar lipid fraction of Chlorella the total fatty acid content decreased to 78.49% in 5 g L−1 NaCl than control (82.89%). Subsequently, in polar lipid fraction of Chlorococcum, total fatty acid content was increased to 91.86% in 1.5 g L−1 NaCl than control (76.02%). Zhu and Dunford reported oil composition of two microalgae Picochlorum oklahomensis and Nannochloropsis oculata, showing dominance of PUFA than MUFA or SFA.43 Algal cells supplemented with salinity stress showed variations in fatty acid synthesis from species to species. The alteration in lipid classes in its turn regulates the membrane fluidity and other physiological characteristics of the cell.
Table 2 FAME profile (%) of neutral and polar lipid fractions of Chlorella ellipsoidea and Chlorococcum infusionum under NaCl stress (p ≤ 0.05)
| Fatty acids |
Fatty acid compositions (%) |
| Chlorella ellipsoidea |
Chlorococcum infusionum |
| Control |
5 g L−1 NaCl |
Control |
1.5 g L−1 NaCl |
| Neutral fraction (p < 0.05) |
Polar fraction (p < 0.01) |
Neutral fraction (p < 0.05) |
Polar fraction (p < 0.01) |
Neutral fraction (p < 0.05) |
Polar fraction (p < 0.01) |
Neutral fraction (p < 0.05) |
Polar fraction (p < 0.01) |
| Lauric (C12:0) |
3.54 ± 0.23 |
— |
3.86 ± 0.04 |
0.87 ± 0.06 |
1.68 ± 0.22 |
2.25 ± 0.64 |
2.59 ± 0.76 |
1.75 ± 0.35 |
| Myristic (C14:0) |
3.25 ± 0.35 |
— |
6.25 ± 0.03 |
— |
7.23 ± 0.37 |
8.27 ± 0.91 |
8.91 ± 0.87 |
10.68 ± 0.76 |
| Pentadecylic (C15:0) |
— |
1.08 ± 0.75 |
— |
2.96 ± 0.54 |
— |
0.54 ± 0.03 |
1.14 ± 0.08 |
0.85 ± 0.32 |
| Palmitic (C16:0) |
9.52 ± 0.28 |
16.85 ± 1.15 |
11.93 ± 1.04 |
14.57 ± 1.09 |
9.83 ± 0.41 |
10.31 ± 1.03 |
10.75 ± 1.01 |
12.74 ± 0.84 |
| Palmitoleic (C16:1) |
11.67 ± 1.25 |
15.65 ± 1.05 |
14.47 ± 1.02 |
15.26 ± 1.12 |
16.97 ± 1.25 |
13.86 ± 1.13 |
19.05 ± 1.21 |
14.91 ± 1.13 |
| Margaric (C17:0) |
— |
0.17 ± 0.01 |
1.57 ± 0.32 |
1.27 ± 0.05 |
— |
0.57 ± 0.05 |
1.56 ± 0.23 |
2.96 ± 0.34 |
| Stearic (C18:0) |
5.92 ± 0.35 |
6.41 ± 0.37 |
7.75 ± 0.03 |
8.57 ± 0.57 |
4.69 ± 0.74 |
5.24 ± 0.56 |
6.79 ± 0.64 |
3.57 ± 0.65 |
| Oleic (C18:1) |
10.72 ± 0.28 |
9.79 ± 0.69 |
16.58 ± 0.04 |
14.26 ± 1.02 |
8.71 ± 0.29 |
14.15 ± 0.76 |
15.45 ± 1.12 |
12.26 ± 1.05 |
| Linoleic (C18:2) |
8.75 ± 1.06 |
14.24 ± 1.02 |
10.27 ± 1.01 |
13.86 ± 0.79 |
15.75 ± 1.13 |
14.11 ± 1.15 |
20.25 ± 1.64 |
15.49 ± 1.06 |
| α-Linoleic (C18:3) |
10.05 ± 0.68 |
5.76 ± 0.87 |
7.05 ± 0.04 |
4.25 ± 0.34 |
14.84 ± 1.04 |
10.05 ± 1.11 |
— |
5.37 ± 0.38 |
| Arachidic (C20:0) |
5.63 ± 0.24 |
3.01 ± 0.31 |
— |
2.93 ± 0.06 |
4.57 ± 0.15 |
3.32 ± 0.05 |
5.23 ± 0.85 |
5.29 ± 0.73 |
| Paullinic (C20:1) |
8.63 ± 0.21 |
5.44 ± 0.08 |
4.33 ± 0.76 |
7.21 ± 0.21 |
— |
5.05 ± 0.06 |
2.73 ± 0.73 |
3.57 ± 0.36 |
| Dihomo-γ-linolenic (C20:3) |
— |
2.52 ± 0.05 |
— |
— |
1.42 ± 0.28 |
— |
1.59 ± 0.52 |
3.01 ± 0.02 |
| Arachidonic (C20:4) |
5.18 ± 0.19 |
5.11 ± 0.12 |
1.55 ± 0.35 |
4.19 ± 0.03 |
2.01 ± 0.36 |
3.16 ± 0.04 |
— |
4.54 ± 0.06 |
| Eicosapentanoic (C20:5) |
4.19 ± 0.34 |
5.32 ± 0.76 |
2.63 ± 0.02 |
7.95 ± 0.05 |
3.21 ± 0.43 |
0.51 ± 0.02 |
— |
1.12 ± 0.13 |
| Behenic (C22:0) |
7.65 ± 0.47 |
— |
8.71 ± 0.02 |
0.07 ± 0.01 |
1.45 ± 0.79 |
1.63 ± 0.03 |
2.57 ± 0.22 |
1.76 ± 0.26 |
| Lignoceric (C24:0) |
1.69 ± 0.05 |
0.54 ± 0.05 |
1.05 ± 0.08 |
1.27 ± 0.25 |
0.70 ± 0.12 |
— |
1.15 ± 0.31 |
— |
| SFA |
37.20 ± 1.97 |
28.06 ± 2.64 |
41.12 ± 1.56 |
32.51 ± 2.63 |
30.15 ± 2.80 |
32.13 ± 3.30 |
40.69 ± 4.97 |
39.60 ± 4.25 |
| MUFA |
31.02 ± 1.74 |
30.88 ± 1.82 |
35.38 ± 1.82 |
36.73 ± 2.35 |
25.68 ± 1.54 |
33.06 ± 1.95 |
37.23 ± 3.06 |
30.74 ± 2.54 |
| PUFA |
28.17 ± 2.27 |
34.95 ± 2.82 |
21.50 ± 1.42 |
30.25 ± 1.21 |
37.23 ± 3.24 |
27.83 ± 2.32 |
21.84 ± 2.16 |
29.53 ± 1.65 |
Fluorescence intensity of neutral and polar lipid fractions
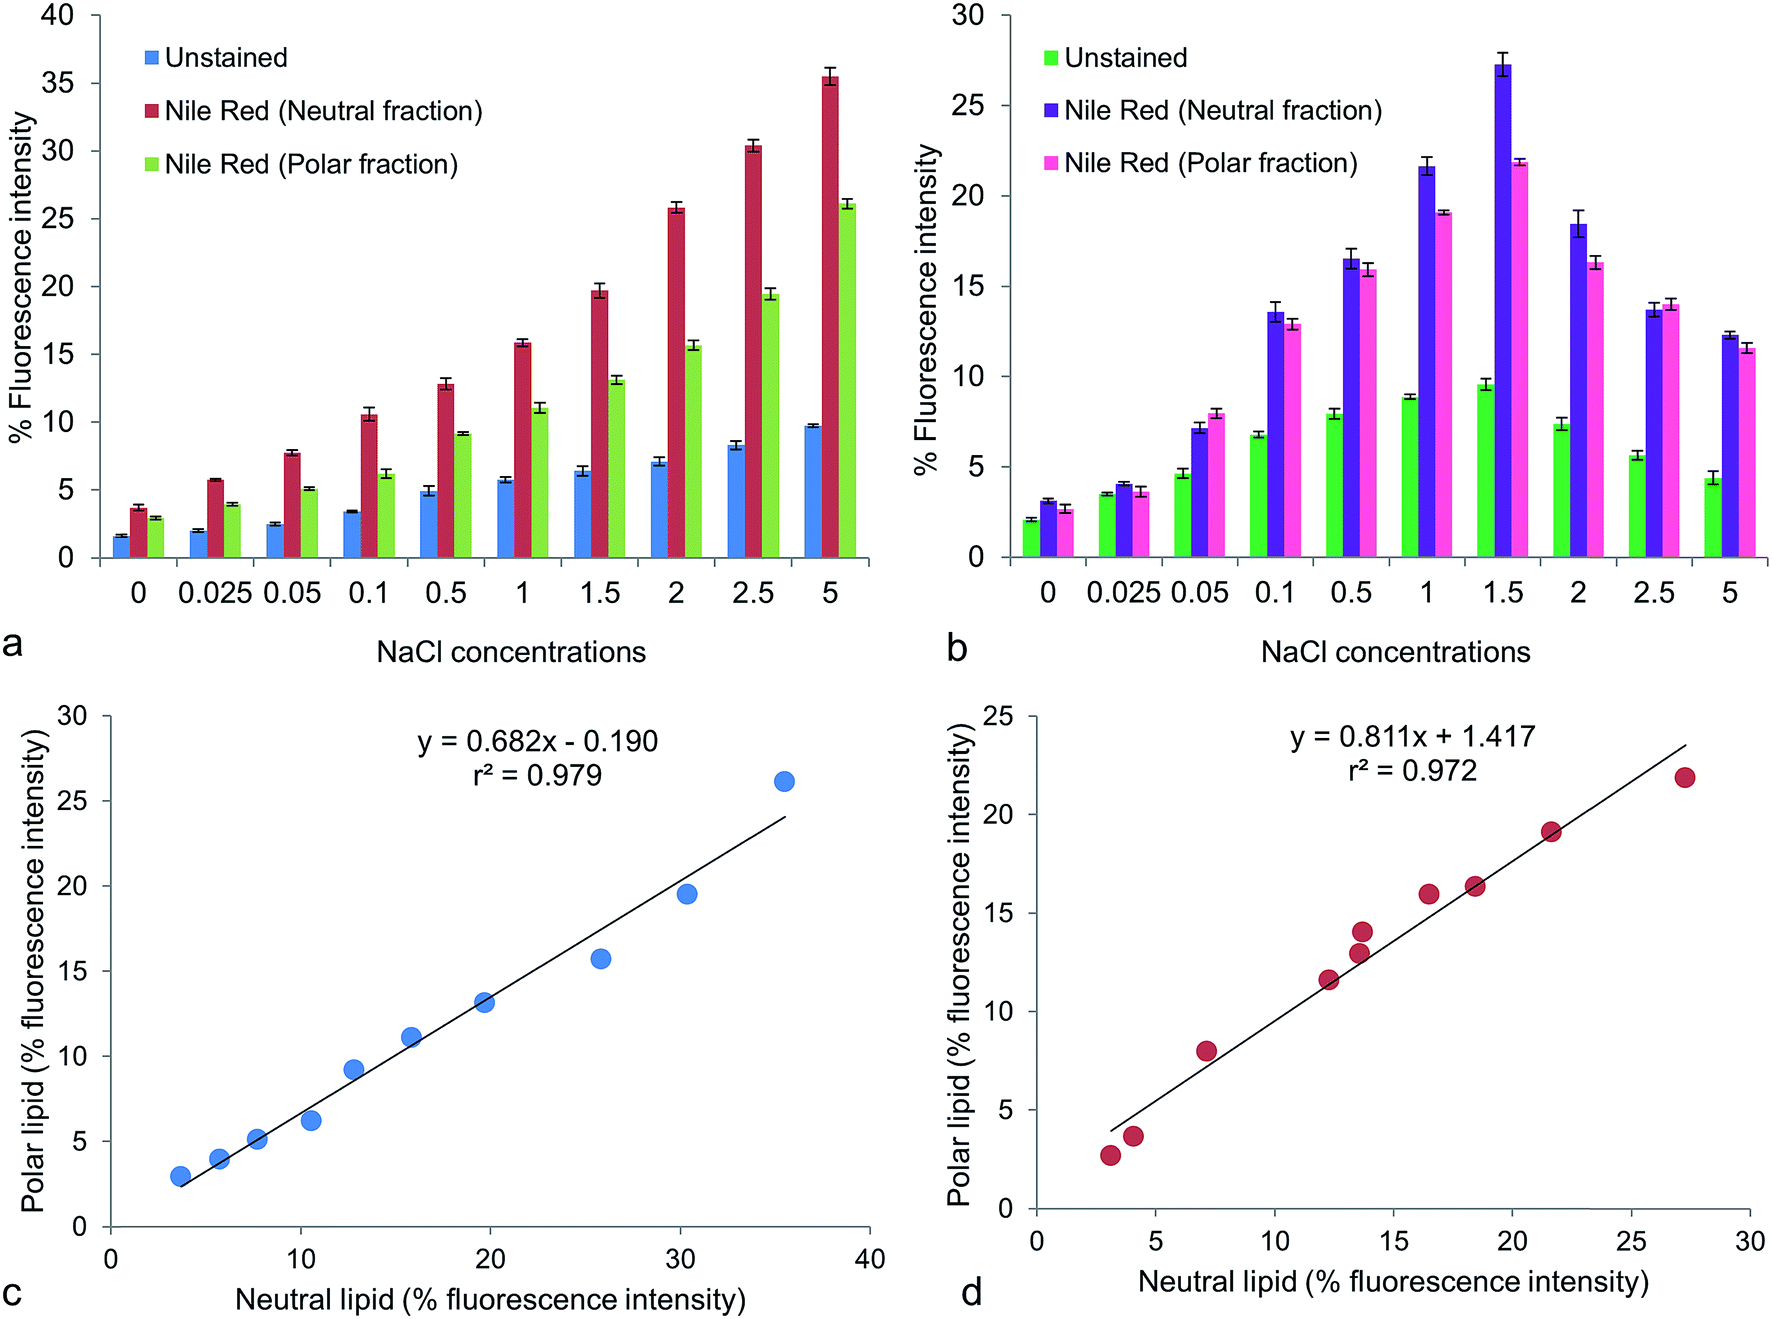
Fluorescence intensity is another quantitative assay for lipid accumulation in microalgae. Fluorescence intensity (% positive stained cells) of Nile red stained cells (excitation, 488 nm; emission, 580–586 nm for neutral lipid and 610–700 nm for polar lipid) were studied under different NaCl concentrations. With the increasing NaCl concentration, the fluorescence intensities for both neutral and polar lipids increased to a certain level. Unstained cells exhibited red autofluorescence (emission at 645–663 nm) under the same excitation due to presence of chlorophylls, whose intensities reflected the growth pattern of the cultures (Fig. 2a and b). In Chlorella maximum fluorescence intensity was 35.5 ± 1.09% in neutral lipid fraction and 26.1 ± 0.59% in polar lipid fraction at 5 g L−1 NaCl (Fig. 2a). The stressed groups of Chlorococcum showed fluorescence intensity of 27.27 ± 1.11% for neutral lipid and 21.87 ± 0.29% for polar lipid at 1.5 g L−1 NaCl (Fig. 2b). The mean fluorescence intensity of Nile red stained cells of Chlamydomonas nivalis was found to increase within 7 h of applying NaCl stress (0.25–1.5%) in the growth medium.1 That the fluorescence intensities did not constantly increase in the present case might be attributed by the fact that the growth of Chlorella and Chlorococcum was strongly inhibited by both higher NaCl concentration and longer incubation time. It has been reported that the yellow fluorescence intensity of Nile red is linearly correlated with the non-polar lipid.2 A significant correlation (p < 0.05) of neutral vs. polar lipid was obtained in Chlorella (r2 = 0.979; y = 0.682x − 0.190) and Chlorococcum (r2 = 0.972; y = 0.811x + 1.417) (Fig. 2c and d). Similar study was performed on Tetraselmis suecica by Guzman et al.45 The neutral vs. polar lipid analysis presents a similar variation in fatty acid composition and was significantly higher in NaCl stress conditions.
 |
| | Fig. 2 Percentage (%) fluorescence intensity (p < 0.05) of unstained and Nile red stained cells for neutral and polar lipid fractions of (a) Chlorella ellipsoidea and (b) Chlorococcum infusionum. Linear regression plots for % fluorescence intensity of polar vs. neutral lipid fractions in (c) Chlorella ellipsoidea and (d) Chlorococcum infusionum (p < 0.05). | |
Confocal microscopic observation of lipid accumulation
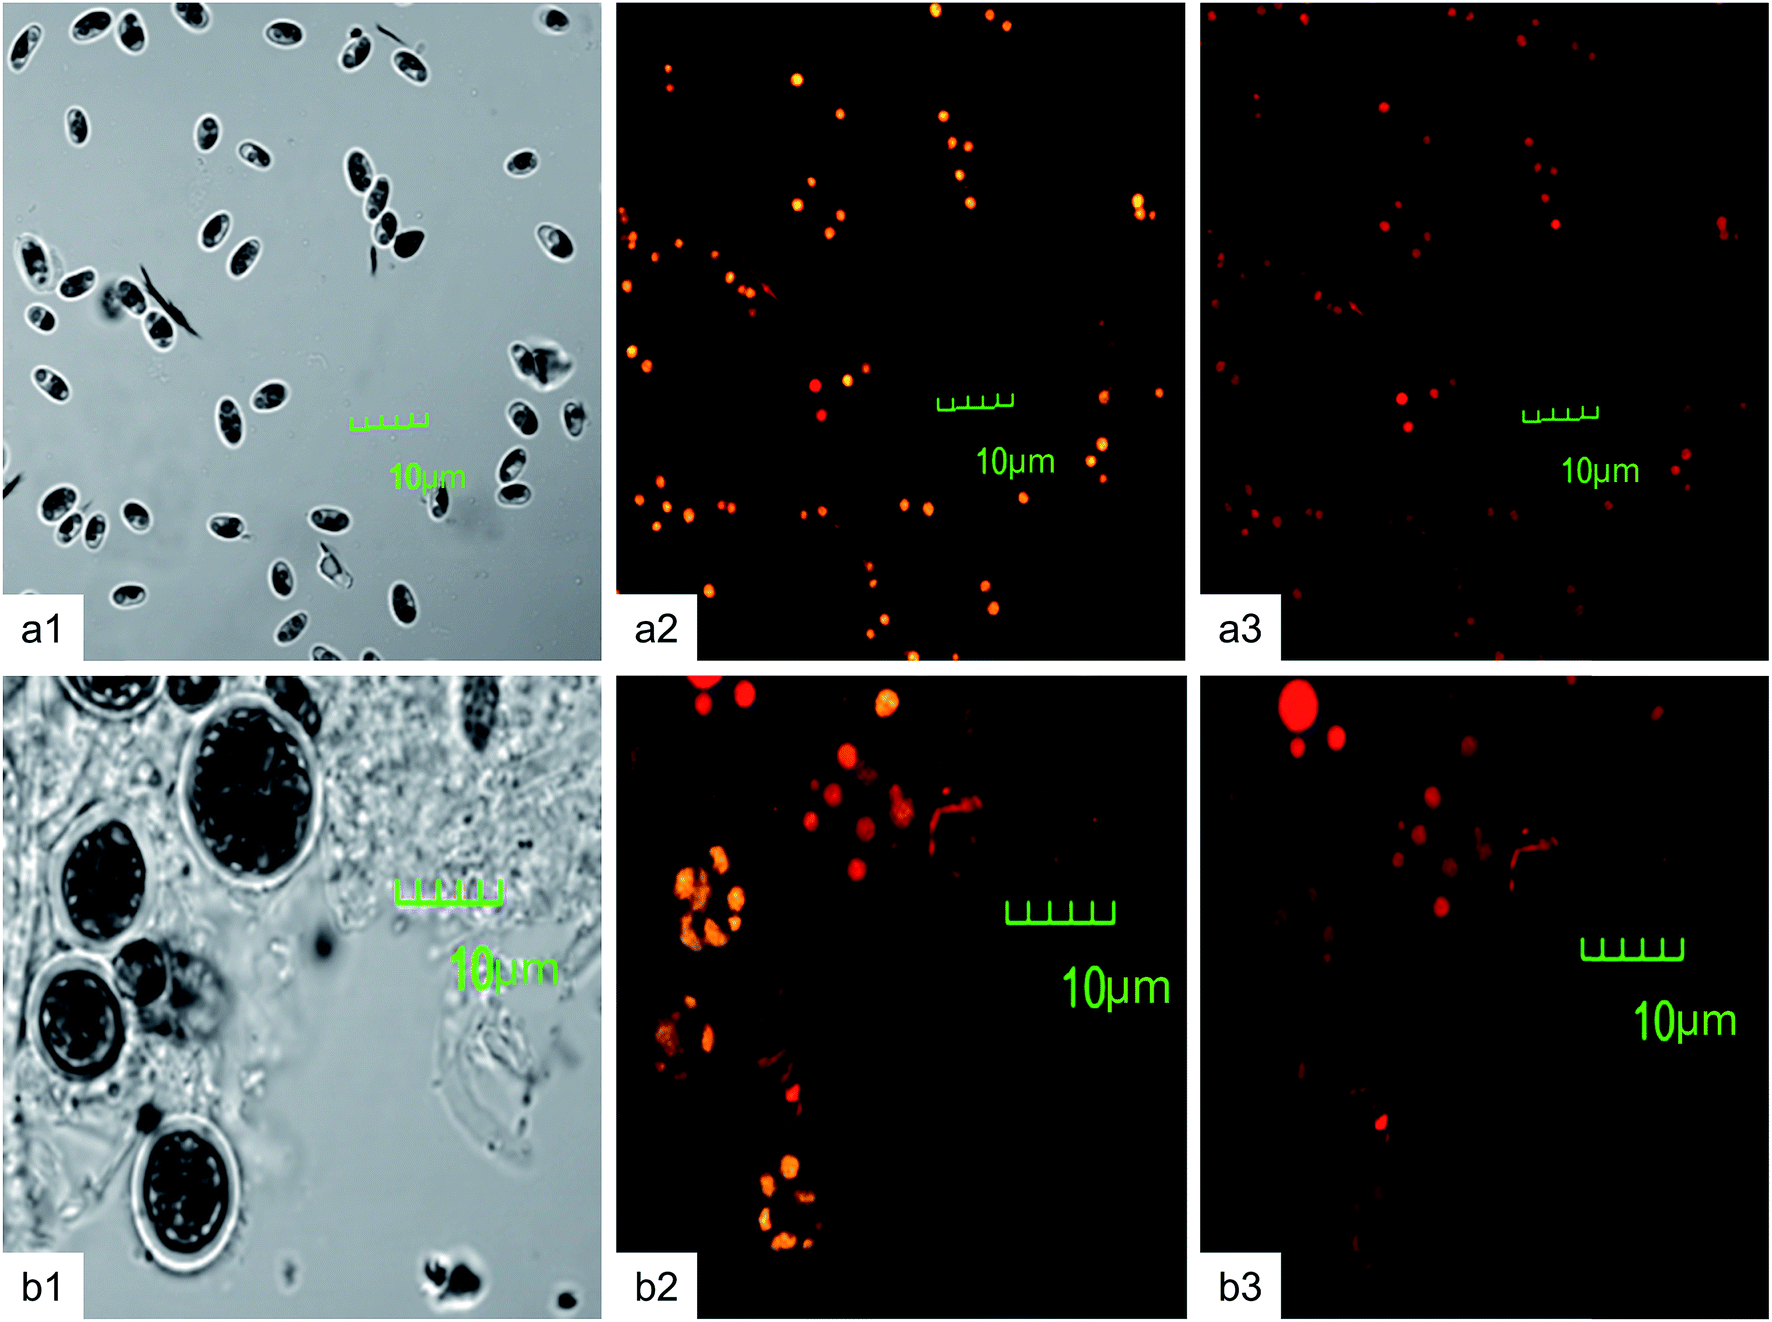
Nile red is a most promising lipophilic fluorescent probe broadly used to study lipid accumulation in microalgae.4,5 Nile red stained cells confirmed the presence of oil droplets distributed throughout the cell cytosol (Fig. 3). The confocal microscopic observation of neutral and polar lipid bodies has advantages over in situ screening. This method is the simplest and non-destructive over other in situ techniques. In the present study, confocal images were obtained from highest lipid containing cells of Chlorella (45.8 ± 0.4% w/v) and Chlorococcum (36.33 ± 0.56% w/v). In Chlorella, neutral lipid bodies (yellowish-golden) were dispersed throughout the cytoplasm (Fig. 3a2) whereas in Chlorococcum these were restricted to inner side of the cell membrane (Fig. 3b2). Yao et al. showed yellow fluorescence of neutral lipid in Chlamydomonas reinhardtii.2 Neutral lipid accumulation in the marine strains Alexandrium minutum and Heterosigma akashiwo was shown to increase by 200% and 30% respectively under N deficiency and lower temperature.49 One of the most important functions of neutral lipid (TAG) in microalgal cells is to provide energy for metabolic requirements of cell. Under specific environmental conditions, microalgae can accumulate large quantities of storage carbon in the form of neutral lipid or storage lipid (TAG) that can be utilized an alternative energy resource for third generation of biodiesel.4 Polar lipid bodies (reddish) were evenly distributed throughout the cytosol of Chlorella and Chlorococcum respectively (Fig. 3a3 and b3). Nile red fluorescence for both neutral and polar lipids was strongly influenced by NaCl concentrations. Accumulation of more polar lipids could stimulate membrane biosynthesis that is important for membrane transport of several ions.1
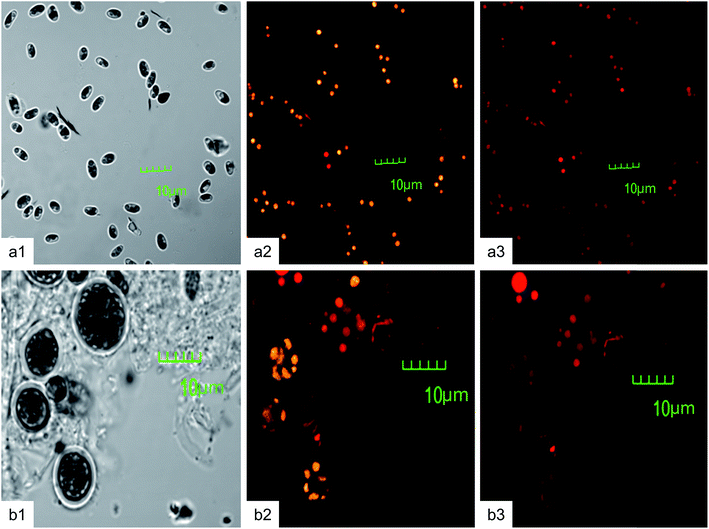 |
| | Fig. 3 Bright field images of (a1) Chlorella ellipsoidea and (b1) Chlorococcum infusionum; neutral lipid bodies of (a2) Chlorella ellipsoidea and (b2) Chlorococcum infusionum; polar lipid bodies of (a3) Chlorella ellipsoidea and (b3) Chlorococcum infusionum (magnification: 4500×). | |
Flow cytometric assessment of neutral and polar lipid
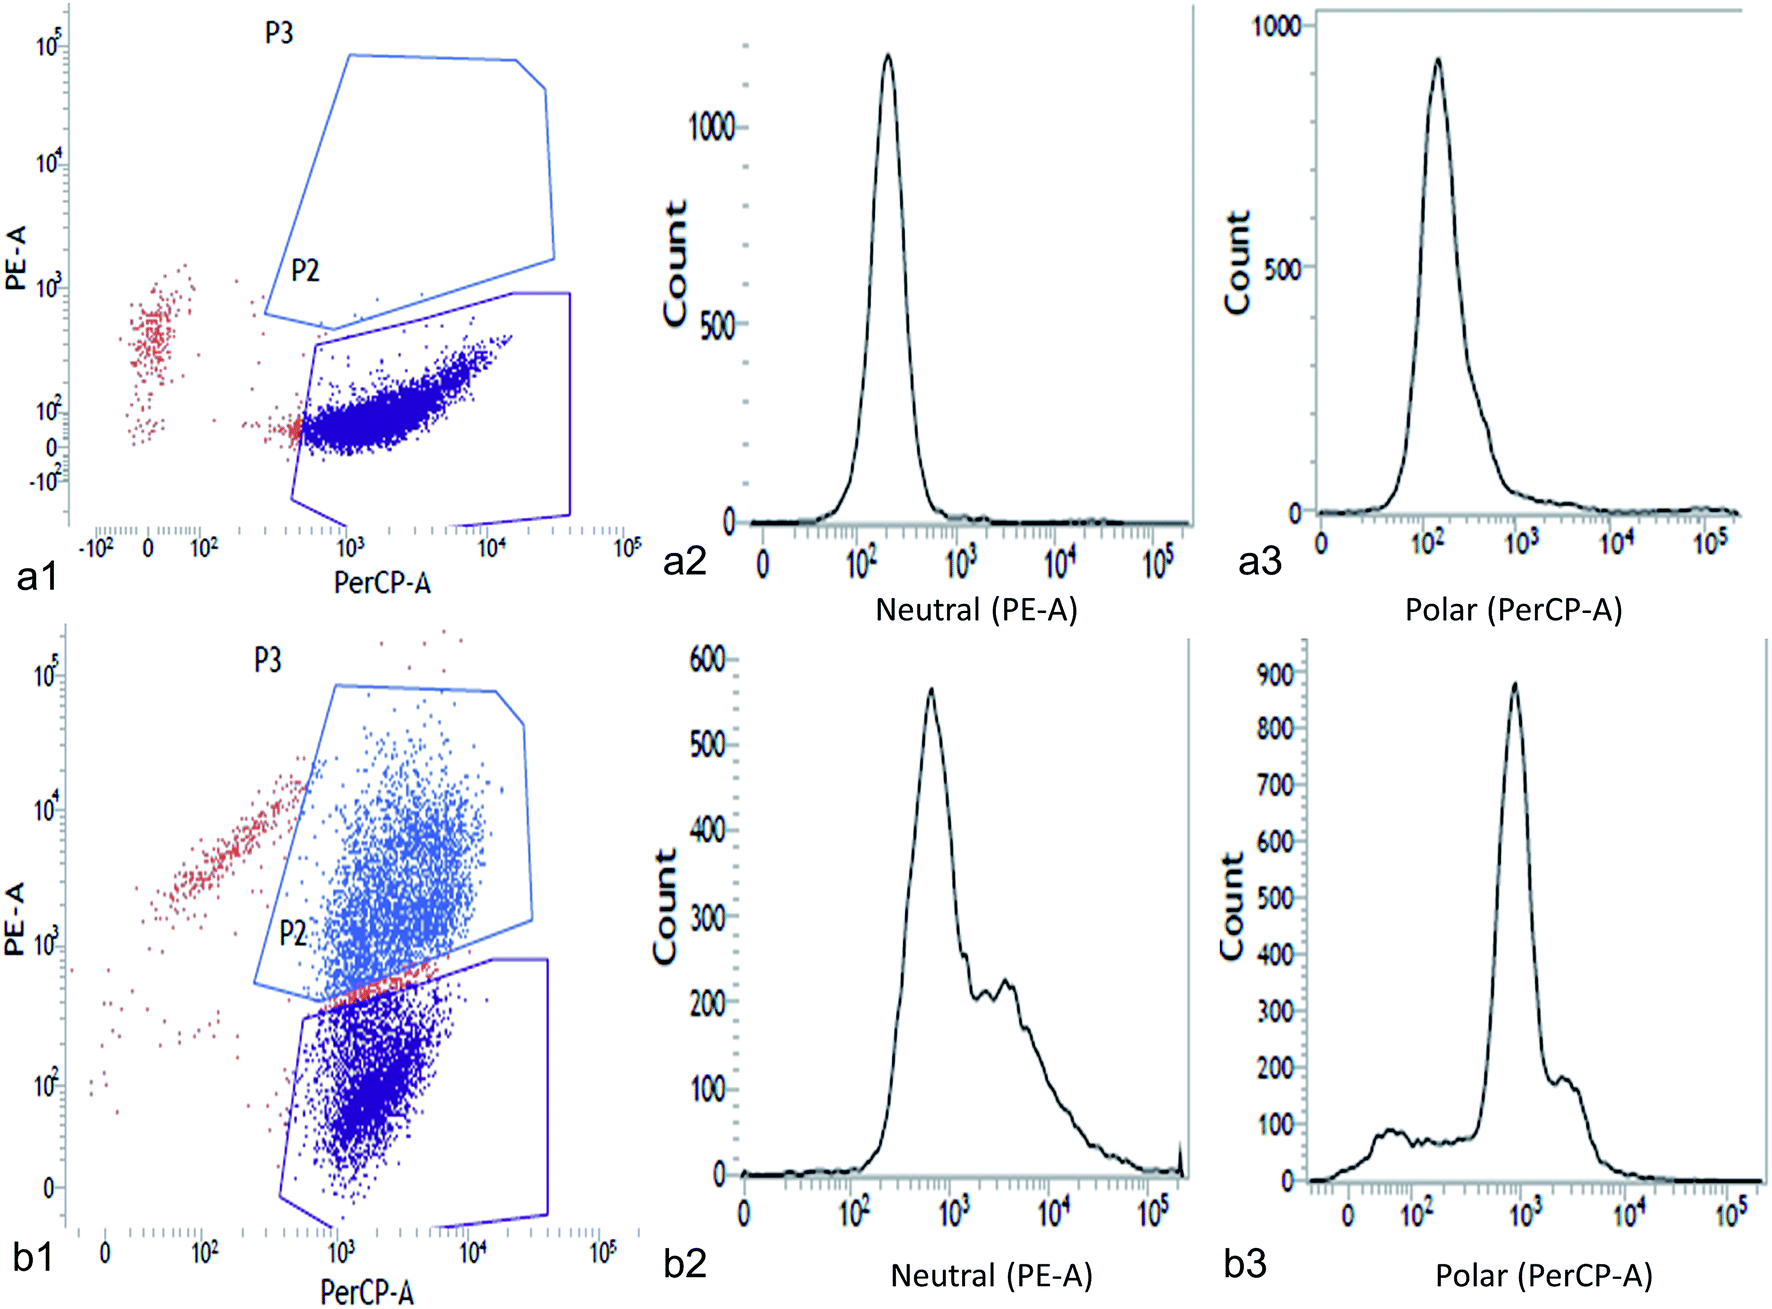
The neutral and polar lipid accumulation under different concentrations of NaCl was detected and quantified by flow cytometry (Fig. 4 and 5). Flow cytometry is a well-known sophisticated method for rapid screening of single-celled microalgae in terms of cell size, internal granularity and complexity as well as their auto fluorescence properties. Previous studies demonstrated the utility of flow cytometry for rapid quantification of lipid in microalgae using Nile red based staining.3–5 This method gives single cell information to analyze the physiological states of the cells. In this study we tested the potential of Nile red to visualize cellular lipid accumulation in two green microalgae Chlorella ellipsoidea and Chlorococcum infusionum exposed to NaCl. The combination of Nile red and flow cytometry makes it possible to not only detect total lipid accumulation but also useful to study the lipid classes such as neutral and polar lipid. Flow cytometric analysis exhibited greater Nile red fluorescence in NaCl-replete medium for both the microalgae (5 g L−1 NaCl for Chlorella and 1.5 g L−1 for Chlorococcum) than control (Fig. 4a1–a3 and 5a1–a3). In respect to the control, high median and coefficient of variation (CV) was obtained under NaCl stress for both the test microalgae (Tables 3 and 4). The PE-A vs. PerCP-A two-dimensional dot plots revealed uniformly scatter cells for Chlorella (Fig. 4b1) and Chlorococcum (Fig. 5b1). However, a histogram of PE-A and PerCP-A for neutral and polar lipid showed higher lipid accumulation in NaCl-replete cells with respect to the fluorescence signal of Chlorella (Fig. 4b2 and b3) and Chlorococcum (Fig. 5b2 and b3). All Nile red stained cells responded positively to staining. The maximum number of events recorded was 20000 for Chlorella and Chlorococcum. The mean, median, SD and CV values were calculated using total number of events recorded (positively stained cells) (Tables 3 and 4). The CV values were calculated to be almost double than control in all cases. These statistical values were calculated against the number of cells positively stained with Nile red against the total number of events recorded. Guzman et al. showed similar observation in Isochrysis galbana, Tetraselmis suecica, Dunaliella salina and Chlorella pyrenoidosa.50 The statistical data obtained from the flow cytometry signifies the quality and quantity of the stained and unstained cells.50 In both microalgae, all statistical parameters showed 2–10 times greater fluorescence in Nile red stained cells than unstained one that implies positive staining for neutral and polar lipid fraction in different signal. Flow cytometric study of cadmium-exposed green alga Chlamydomonas reinhardtii showed high mean fluorescence signal when stained with three fluorescent probes, fluorescein diacetate (FDA), dihydro-rhodamine 123 (DHR123) and tetramethyl-rhodamine methyl ester (TMRM).51 In our present study both the algal species responded positive staining due to the lipophilic properties of Nile red and its membrane permeability.
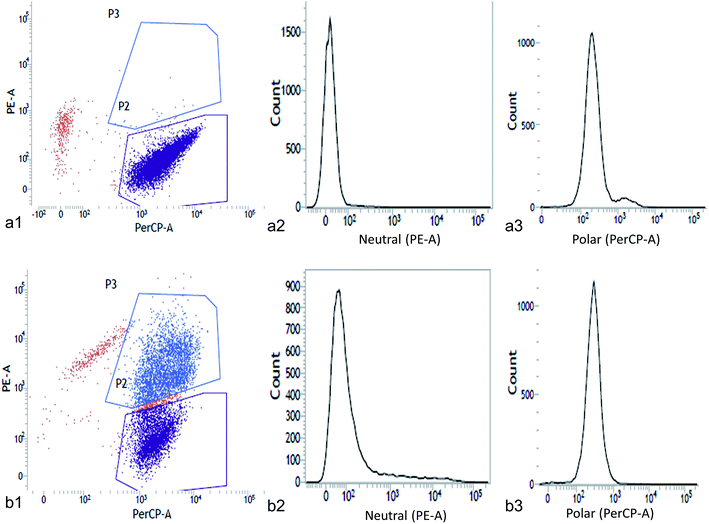 |
| | Fig. 4 Chlorella ellipsoidea showing PE-A (neutral lipid) vs. PerCP-A (polar lipid) two-dimensional scattered dot plot of (a1) control and (b1) Nile red stained cells; flow cytograms of cell count vs. neutral lipid in (a2) control and (b2) Nile red stained cells; flow cytograms of cell count vs. polar lipid in (a3) control and (b3) Nile red stained cells (P2-plot for scattered cells sorted and P3-plot for scattered area). | |
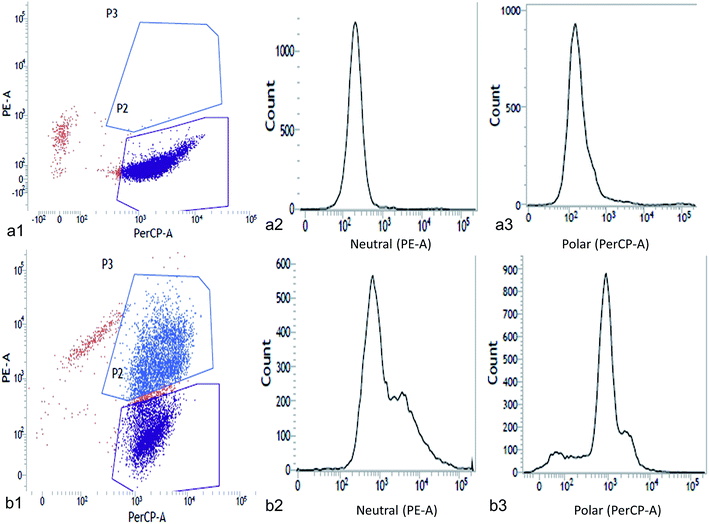 |
| | Fig. 5 Chlorococcum infusionum showing PE-A (neutral lipid) vs. PerCP-A (polar lipid) two-dimensional scattered dot plot of (a1) control and (b1) Nile red stained cells; flow cytograms of cell count vs. neutral lipid in (a2) control and (b2) Nile red stained cells; flow cytograms of cell count vs. polar lipid in (a3) control and (b3) Nile red stained cells (P2-plot for scattered cells sorted and P3-plot for scattered area). | |
Table 3 Statistical parameters of Nile red stained cells of Chlorella ellipsoidea (SD-standard deviation, CV-coefficient of variation). Parameters calculated on the basis of number of events recorded
| Experimental condition |
Neutral lipid fraction |
Polar lipid fraction |
| Mean |
Median |
SD |
CV |
Mean |
Median |
SD |
CV |
| Control |
2175 |
1871 |
1465.26 |
72.31 |
1342 |
1046 |
1112.34 |
64.55 |
| 5 g L−1 NaCl |
17268 |
11871 |
11212.22 |
143.45 |
8478 |
3845 |
9546.08 |
124.92 |
Table 4 Statistical parameters of Nile red stained cells of Chlorococcum infusionum (SD-standard deviation, CV-coefficient of variation). Parameters calculated on the basis of number of events recorded
| Experimental condition |
Neutral lipid fraction |
Polar lipid fraction |
| Mean |
Median |
SD |
CV |
Mean |
Median |
SD |
CV |
| Control |
1754 |
1279 |
1138.24 |
65.25 |
1237 |
973 |
1086.05 |
52.36 |
| 1.5 g L−1 NaCl |
13468 |
10462 |
9873.23 |
134.42 |
6546 |
3527 |
8652.31 |
118.38 |
FTIR fingerprinting of algal biomass
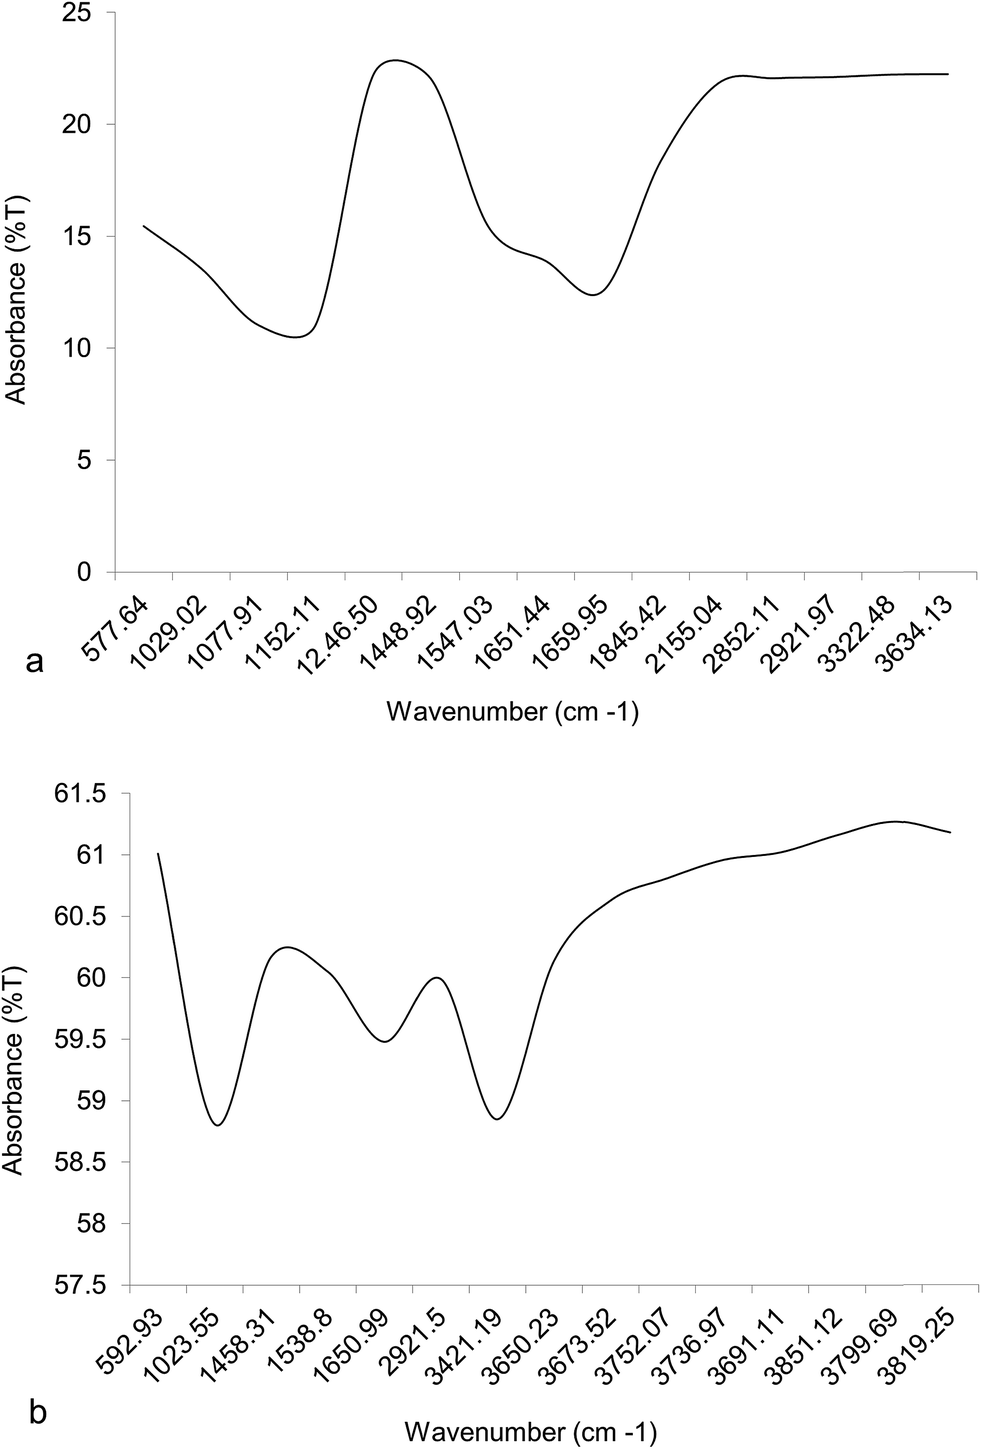
High lipid yielding dry biomass of two algal samples was taken for FTIR fingerprinting analysis to detect the presence of different functional groups. The absorbance band number of Chlorella was found to be greater than Chlorococcum (Fig. 6). Carbonyl or keto group (–C![[double bond, length as m-dash]](https://www.rsc.org/images/entities/char_e001.gif) O) was present in the region 1660–1845 cm−1 for both the algal samples that imply the presence of neutral lipid. A small peak obtained was in the region 2852.11 cm−1 for Chlorella and 2921.5 cm−1 for Chlorococcum determined the presence of lipid hydrocarbons (–CH3 and –CH2 for neutral lipid). Hydrocarbons (–CH3 and –CH2) present in the region 1020–1650 cm−1 depict the presence of other macromolecules like carbohydrate, and protein in the sample. The region 570–1246 cm−1 indicated the presence of hydroxyl and phosphate groups for polar lipids in the sample (Fig. 6a and b). Thus, the FTIR spectra exist as individual lipid spectra for both neutral and polar lipids. Similar study also discussed by Laurens and Wolfrum.19 The absorbance spectra appearing in the region 3320–3820 cm−1 indicated the presence of alcoholic (–O–H) and amide (–N–H) groups of carbohydrate and protein, which was similar to Satpati et al.5
O) was present in the region 1660–1845 cm−1 for both the algal samples that imply the presence of neutral lipid. A small peak obtained was in the region 2852.11 cm−1 for Chlorella and 2921.5 cm−1 for Chlorococcum determined the presence of lipid hydrocarbons (–CH3 and –CH2 for neutral lipid). Hydrocarbons (–CH3 and –CH2) present in the region 1020–1650 cm−1 depict the presence of other macromolecules like carbohydrate, and protein in the sample. The region 570–1246 cm−1 indicated the presence of hydroxyl and phosphate groups for polar lipids in the sample (Fig. 6a and b). Thus, the FTIR spectra exist as individual lipid spectra for both neutral and polar lipids. Similar study also discussed by Laurens and Wolfrum.19 The absorbance spectra appearing in the region 3320–3820 cm−1 indicated the presence of alcoholic (–O–H) and amide (–N–H) groups of carbohydrate and protein, which was similar to Satpati et al.5
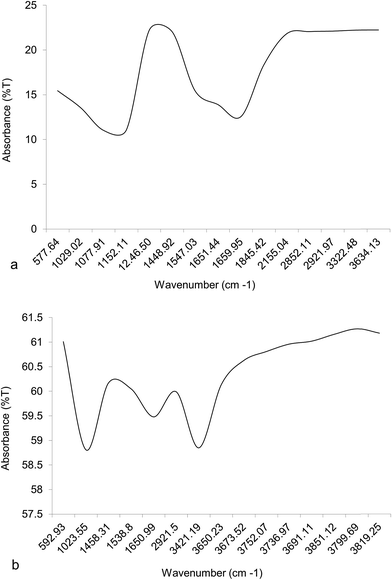 |
| | Fig. 6 FTIR spectra of high lipid yielding cells of (a) Chlorella ellipsoidea and (b) Chlorococcum infusionum cultured at optimized NaCl concentrations. | |
Determination of total chlorophyll, carotenoid, carbohydrate and protein content
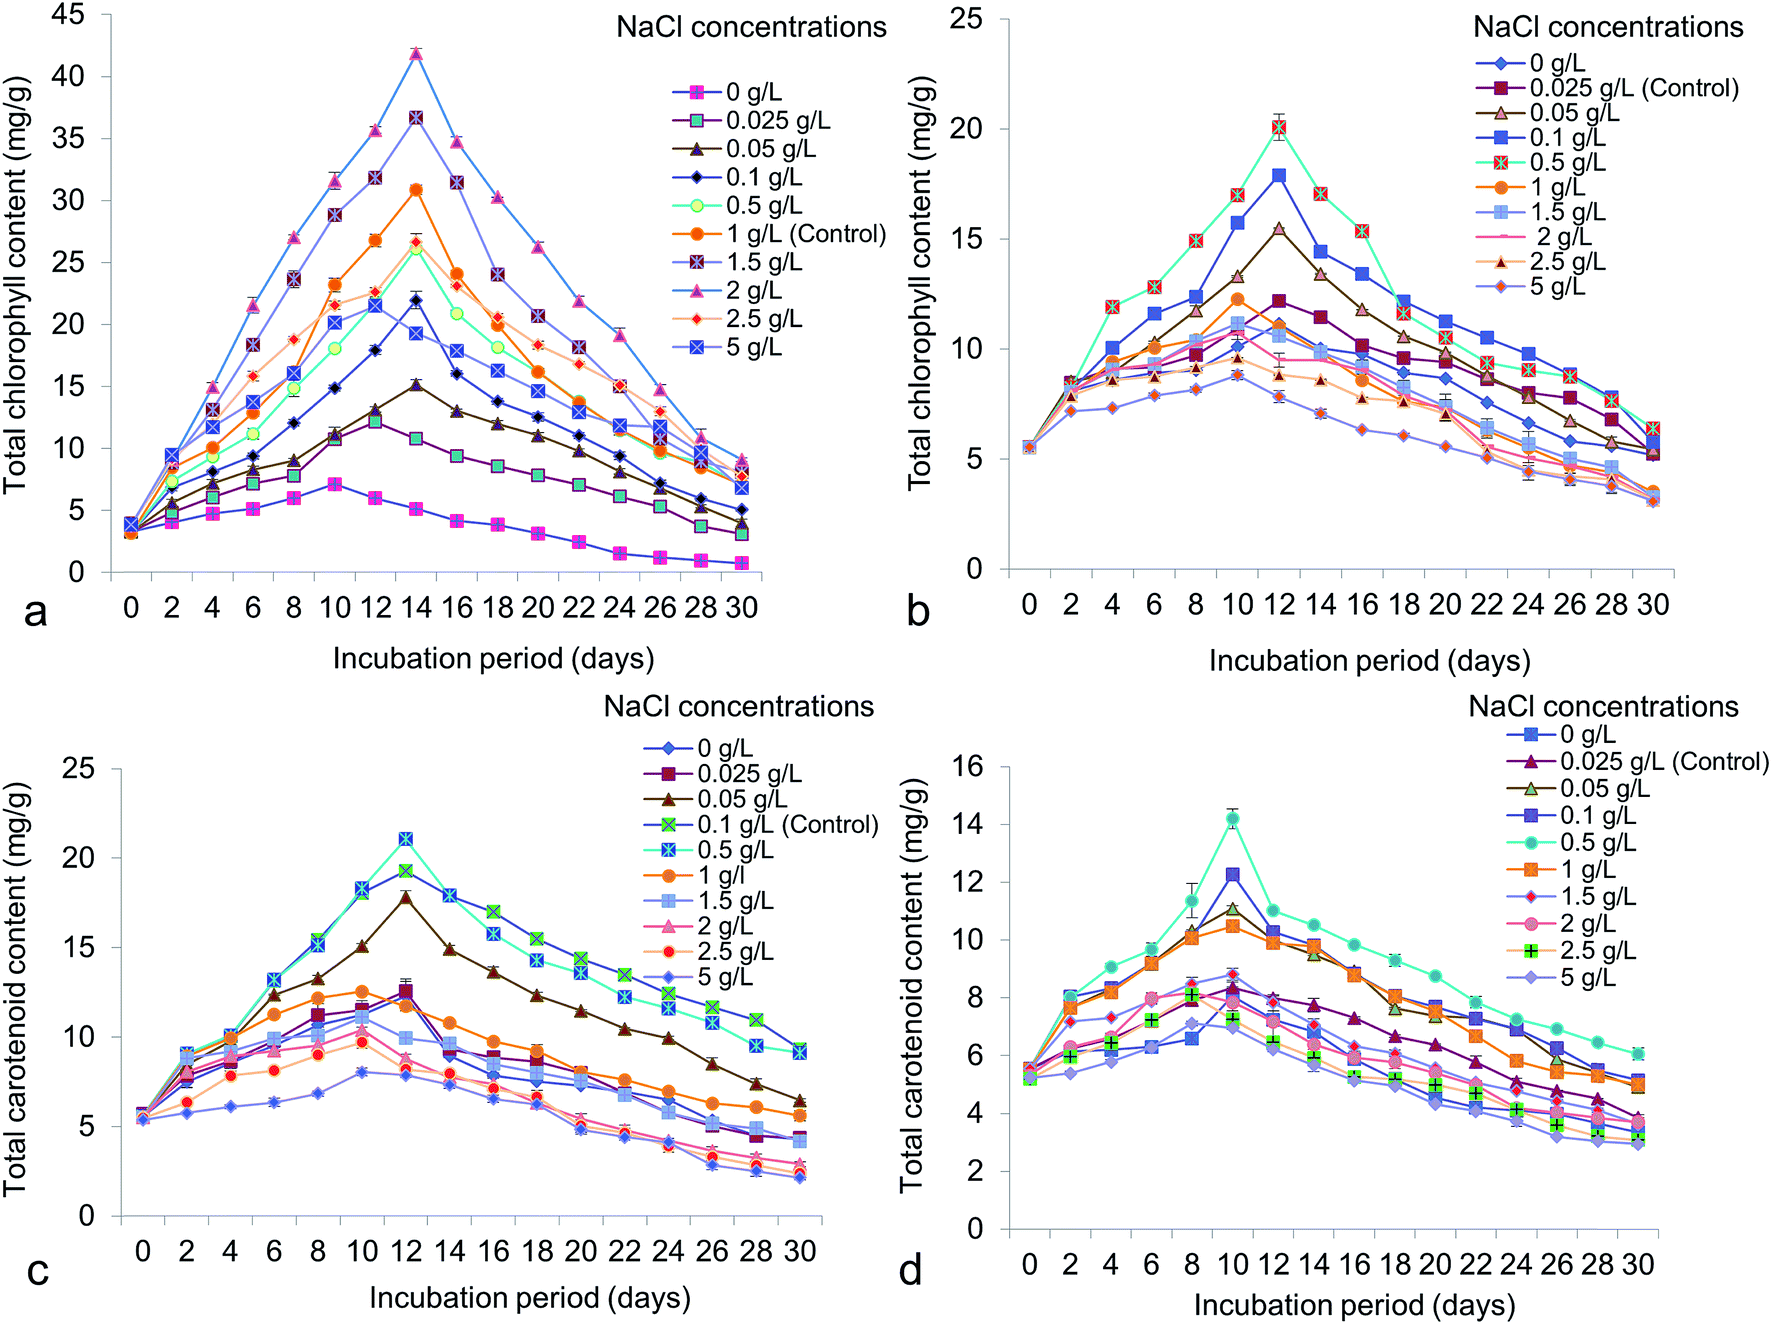
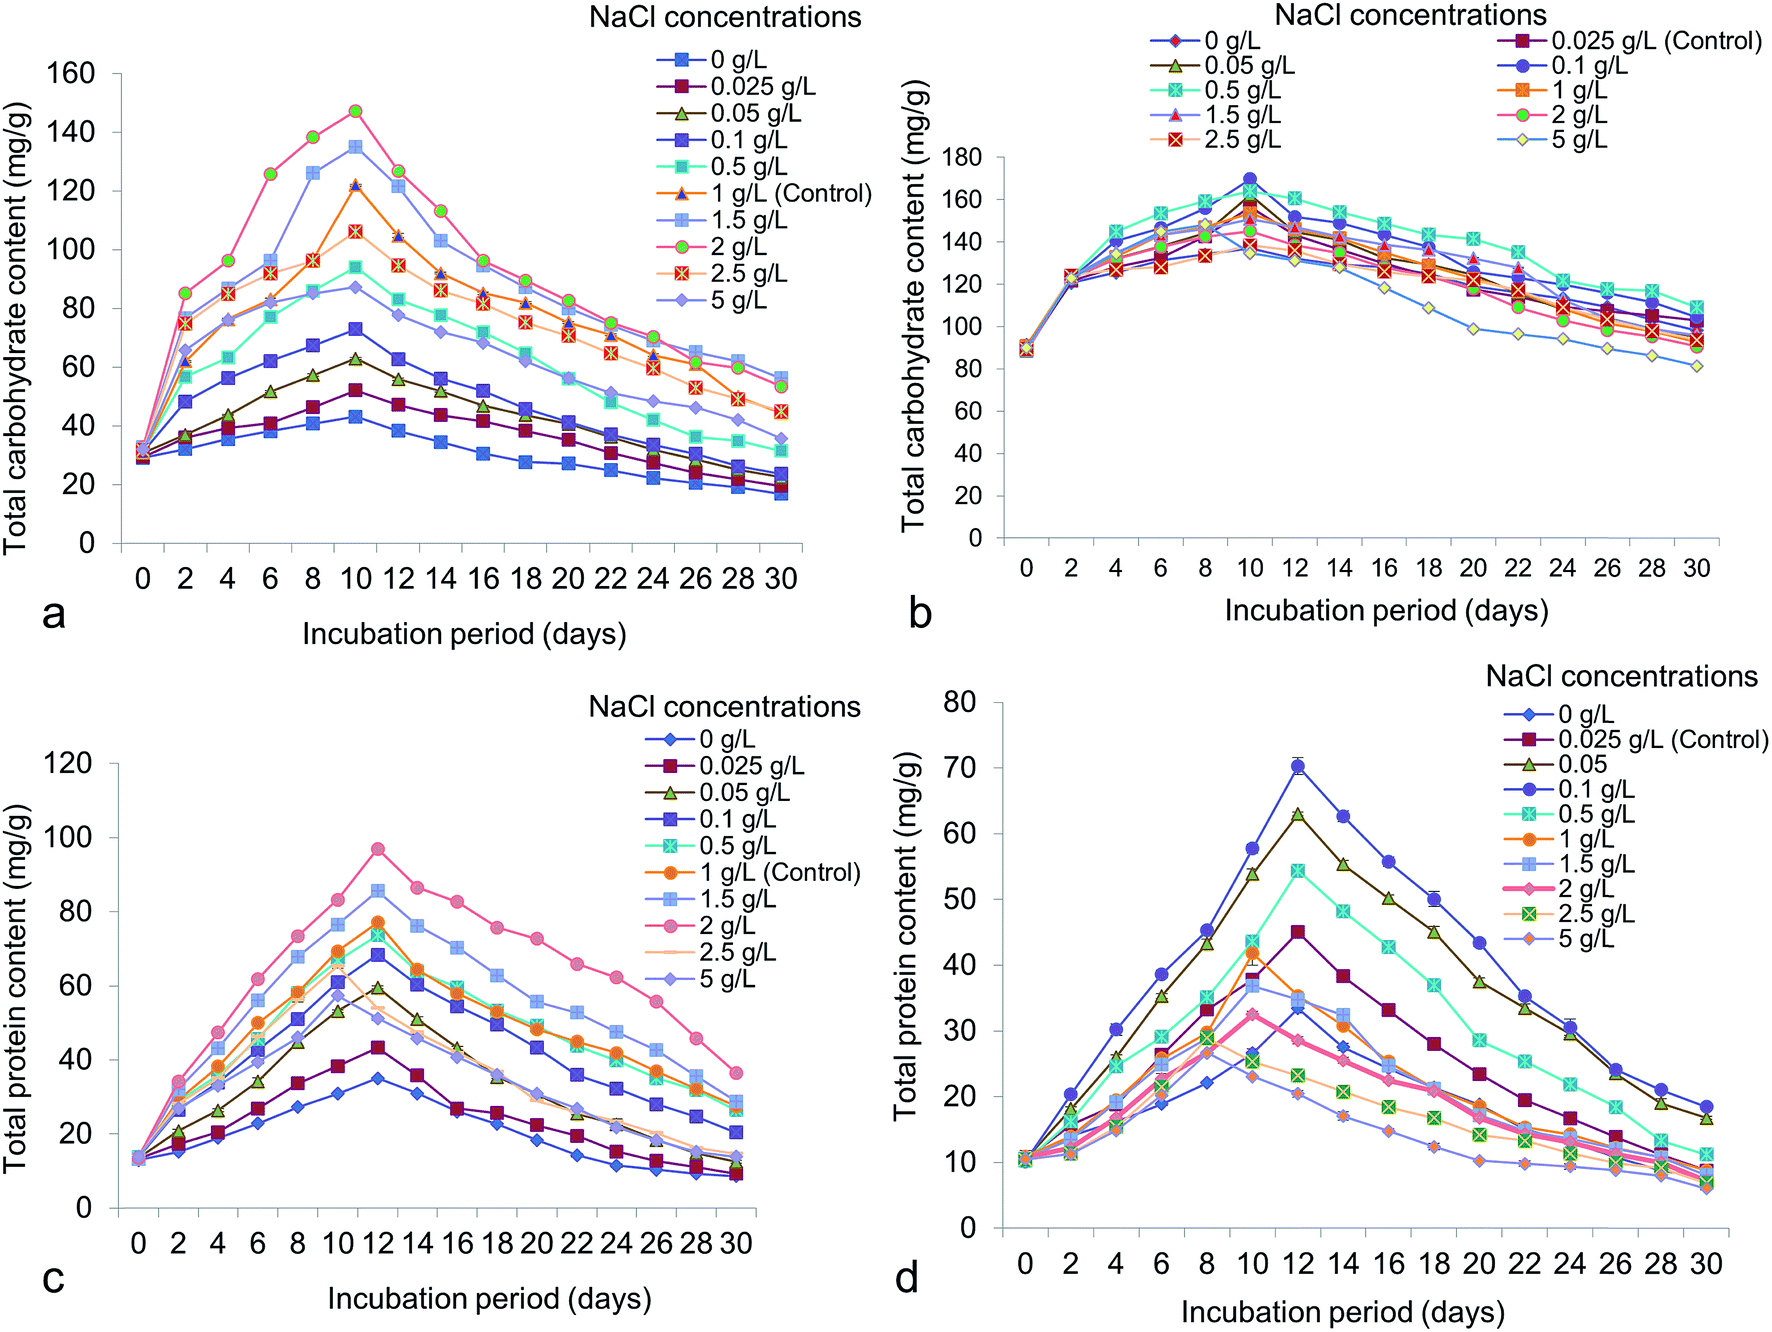
Different NaCl concentrations varying from 0 to 5 g L−1 were applied for the possible changes of total chlorophyll, carotenoid, carbohydrate and protein content in accordance to lipid. From the study it has shown that, total chlorophyll content in Chlorella was 41.87 ± 0.65 mg g−1 at 14 days old culture under 2 g L−1 NaCl (Fig. 7a). In Chlorococcum the total chlorophyll content recorded was 20.08 ± 1.02 mg g−1 at 12 days incubation under 0.5 g L−1 NaCl in the culture (Fig. 7b). The chlorophyll content was reduced at high salinity due to rapid decrease in photosynthetic rate because of osmotic and toxic ionic stresses.13 The present study showed that enhanced chlorophyll in test microalgae was synthesized till 12–14 day's period and thereafter the chlorophyll content rapidly declined. It has also been demonstrated that chlorophyll is the primary photosynthetic target element under salinity stress resulting in reduced carbon assimilation and growth rate.13,52,53 High salinity also influences the growth rate and other cellular metabolism in Scenedesmus obliquus and Chlorella vulgaris.10,40 Microalgae are rich source of carotenoids, comprising a group of hydrocarbons and their oxygenated derivatives. In Chlorella and Chlorococcum the highest carotenoid content obtained was 21.04 ± 0.43 mg g−1 (at 12 days) and 14.19 ± 0.58 mg g−1 (at 10 days) at 0.5 g L−1 NaCl in the culture medium (Fig. 7c and d). High salinity decreases the photosynthetic pigment metabolism and simultaneously influences the photo oxidation of algal cells.54 The present study showed a sharp decline of carotenoid accumulation after 0.5 g L−1 NaCl suggesting osmotic shock to the test microalgae. The carbohydrate production was higher during the log-exponential phase (at 10 days) in the experimental algae. In Chlorella it was obtained as 147.26 ± 0.56 mg g−1 at 2 g L−1 NaCl whereas in Chlorococcum it was found to be 169.71 ± 1.43 mg g−1 at 0.1 g L−1 NaCl (Fig. 8a and b). Similarly the diatom Thalassiosira weissflogii showed high carbohydrate content at the exponential phase but low at stationary phase.12 The growth of the microalgae at higher salinities depends on the mineral function of the cell. This mineral function can be regulated directly by osmotic pressure of the cell.12 It has been reported that the soluble sugar regulates osmotic potential of the cells during reproduction and stress conditions. Under moderate salinity, cells can adapt by increasing soluble sugar (in the form of carbohydrate) whereas high salinity results in osmotic shock.13 Chlorella exhibited a sharp increase of total cellular protein at the concentrations of 0–2 g L−1 NaCl and thereafter it declined at the concentration of 2.5 g L−1 NaCl (Fig. 8c). In Chlorococcum the total protein content was increased to 0.1 g L−1 NaCl and decreased thereafter (Fig. 8d). The highest total protein contents in Chlorella and Chlorococcum respectively were 96.86 ± 0.4 mg g−1 (at 2 g L−1 NaCl) and 70.3 ± 2.29 mg g−1 (at 0.1 g L−1 NaCl) at 12 days incubation period (Fig. 8c and d). This result of total protein content was found to be similar with previous findings.12,13,53 They also reported that the high saline condition reduces the total protein content in the cell.
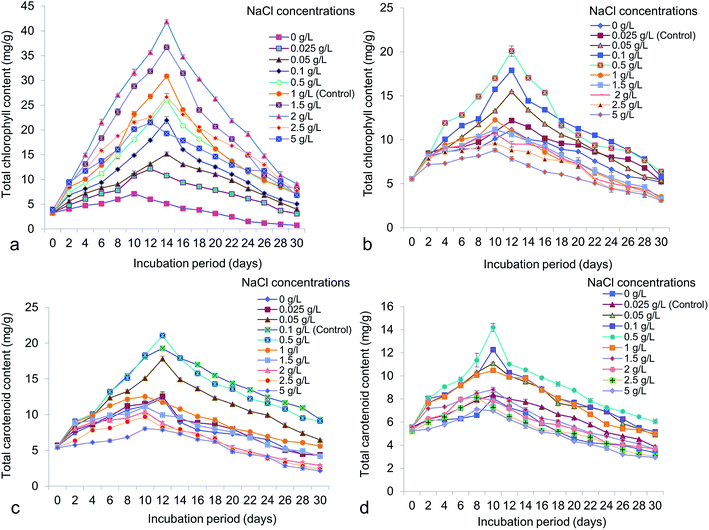 |
| | Fig. 7 Total chlorophyll and carotenoid content of (a and c) Chlorella ellipsoidea and (b and d) Chlorococcum infusionum under various NaCl concentrations. | |
 |
| | Fig. 8 Total carbohydrate and protein content of (a and c) Chlorella ellipsoidea and (b and d) Chlorococcum infusionum under various NaCl concentrations. | |
Effect of NaCl on elemental composition and CO2 fixation rate
The test microalgae cultivated at 5 g L−1 NaCl and 1.5 g L−1 NaCl was found to be optimum for high lipid yield. The elemental compositions (CHNS) under these conditions showed subsequent increase. Carbon (C) content was 42.68% in Chlorella and 32.82% in Chlorococcum (Table 5). The enhanced hydrogen (H) and nitrogen (N) were found to be 5.85% and 7.61% in Chlorella. In Chlorococcum these were 6.63% and 7.29% respectively. The sulfur (S) content was achieved as 1.22% and 0.86% in Chlorella and Chlorococcum respectively (Table 5). Similar results were obtained in Chlorella minutissima using CO2 sparged and flue gas aerated culture.14 The CO2 fixation rate was higher in Chlorella (2.18 ± 0.22 g L−1 d−1) than Chlorococcum (1.68 ± 0.24 g L−1 d−1) (Table 5). Another study performed by Dineshkumar et al. showed CO2 fixation rate of C. minutissima was 1.19 ± 0.03 g L−1 d−1 and 1.15 ± 0.02 g L−1 d−1 in CO2 sparged and flue gas aerated culture respectively.14 Thus, the present study sensibly demonstrated the role of osmotic stress on cellular metabolism and CO2 mitigation by microalgae.
Table 5 Elemental composition (%) and CO2 fixation rate (g L−1 d−1) in high lipid containing cells of Chlorella ellipsoidea and Chlorococcum infusionum
| Microalgae |
Chlorella ellipsoidea |
Chlorococcum infusionum |
| Elemental composition (%) |
Control |
5 g L−1 NaCl |
Control |
1.5 g L−1 NaCl |
| Carbon (C) |
33.75 |
42.68 |
26.68 |
32.82 |
| Hydrogen (H) |
5.85 |
7.83 |
4.39 |
6.63 |
| Nitrogen (N) |
7.61 |
9.64 |
6.24 |
7.29 |
| Sulfur (S) |
0.66 |
1.22 |
0.75 |
0.86 |
| CO2 fixation rate (g L−1 d−1) |
1.57 ± 0.28 |
2.18 ± 0.22 |
1.39 ± 0.62 |
1.68 ± 0.24 |
Characteristics of biodiesel fuel properties
Fuel properties of high lipid containing cells of Chlorella and Chlorococcum were determined under 5 g L−1 and 1.5 g L−1 NaCl (Table 6). The iodine values were estimated at 54.5 g I2/100 g in Chlorella and 39.3 g I2/100 g in Chlorococcum biomass, both in the range of European standard oil (<120). The oxidative stability ensures prolonged storage of the fuel, is depending on low iodine value.55 Simultaneously the cetane number was obtained as 52.6 and 41.3 for Chlorella and Chlorococcum respectively, both within the ranges of Indian and international standards. High cetane value indicates good quality of diesel and stable engine performance.56 The viscosity and density, respectively, were recorded as 3.9 mm2 s−1 and 876 kg m−3 in Chlorella and 4.3 mm2 s−1 and 884 kg m−3 in Chlorococcum, which also fit within the limits of Indian, American and European standard ranges. Ash and water content was also found to be within the upper limit of American, European and Indian diesel standards (Table 6). The un-wanted inorganic residues and other chemical contaminants level were determined by the ash content which can be highly affected during transesterification process.56 The calorific and saponification values were only compared with the Indian standard diesel values and were found to be higher than that. Both these values were not reported in American and European oil standards. The acid value was estimated as 0.5 and 0.8 mg KOH per g in Chlorella and Chlorococcum oil, respectively, that were well fitted within Indian, American and European diesel standards (Table 6). All the diesel properties confirmed Chlorella and Chlorococcum as potential biodiesel resources.
Table 6 Comparison of fuel properties of Chlorella and Chlorococcum biodiesel with Indian and International standards. Biodiesel obtained from high lipid containing cells of Chlorella (45.8 ± 0.4%) and Chlorococcum (36.33 ± 0.56%) under 5 g L−1 and 1.5 g L−1 NaCl respectively
| Diesel properties |
Chlorella biodiesel |
Chlorococcum biodiesel |
Indian standard diesel |
Biodiesel standards |
| American standard (ASTM) |
European standard (EN 14214) |
| Iodine value/g I2/100 g |
54.5 |
39.3 |
1.3 |
— |
<120 |
| Cetane number |
52.6 |
41.3 |
48–54 |
45–50 |
47–55 |
| Acid value/mg KOH per g |
0.5 |
0.8 |
0.7 |
<0.8 |
<0.5 |
| Calorific value/MJ kg−1 |
32.6 |
29.4 |
41.6 |
— |
— |
| Saponification value/mg KOH per g |
122.5 |
98.7 |
1.4 |
— |
— |
| Ash content (%) |
0.01 |
0.02 |
0.01 |
<0.02 |
<0.02 |
| Water content (%) |
0.03 |
0.02 |
0.02 |
<0.03 |
<0.05 |
| Viscosity at 40 °C/mm2 s−1 |
3.9 |
4.3 |
2.7 |
1.9–6.0 |
3.5–5.0 |
| Density at 15 °C/kg m−3 |
876 |
884 |
845–850 |
— |
860–900 |
Effect of hybrid PBR in biomass yield and lipid content of Chlorella
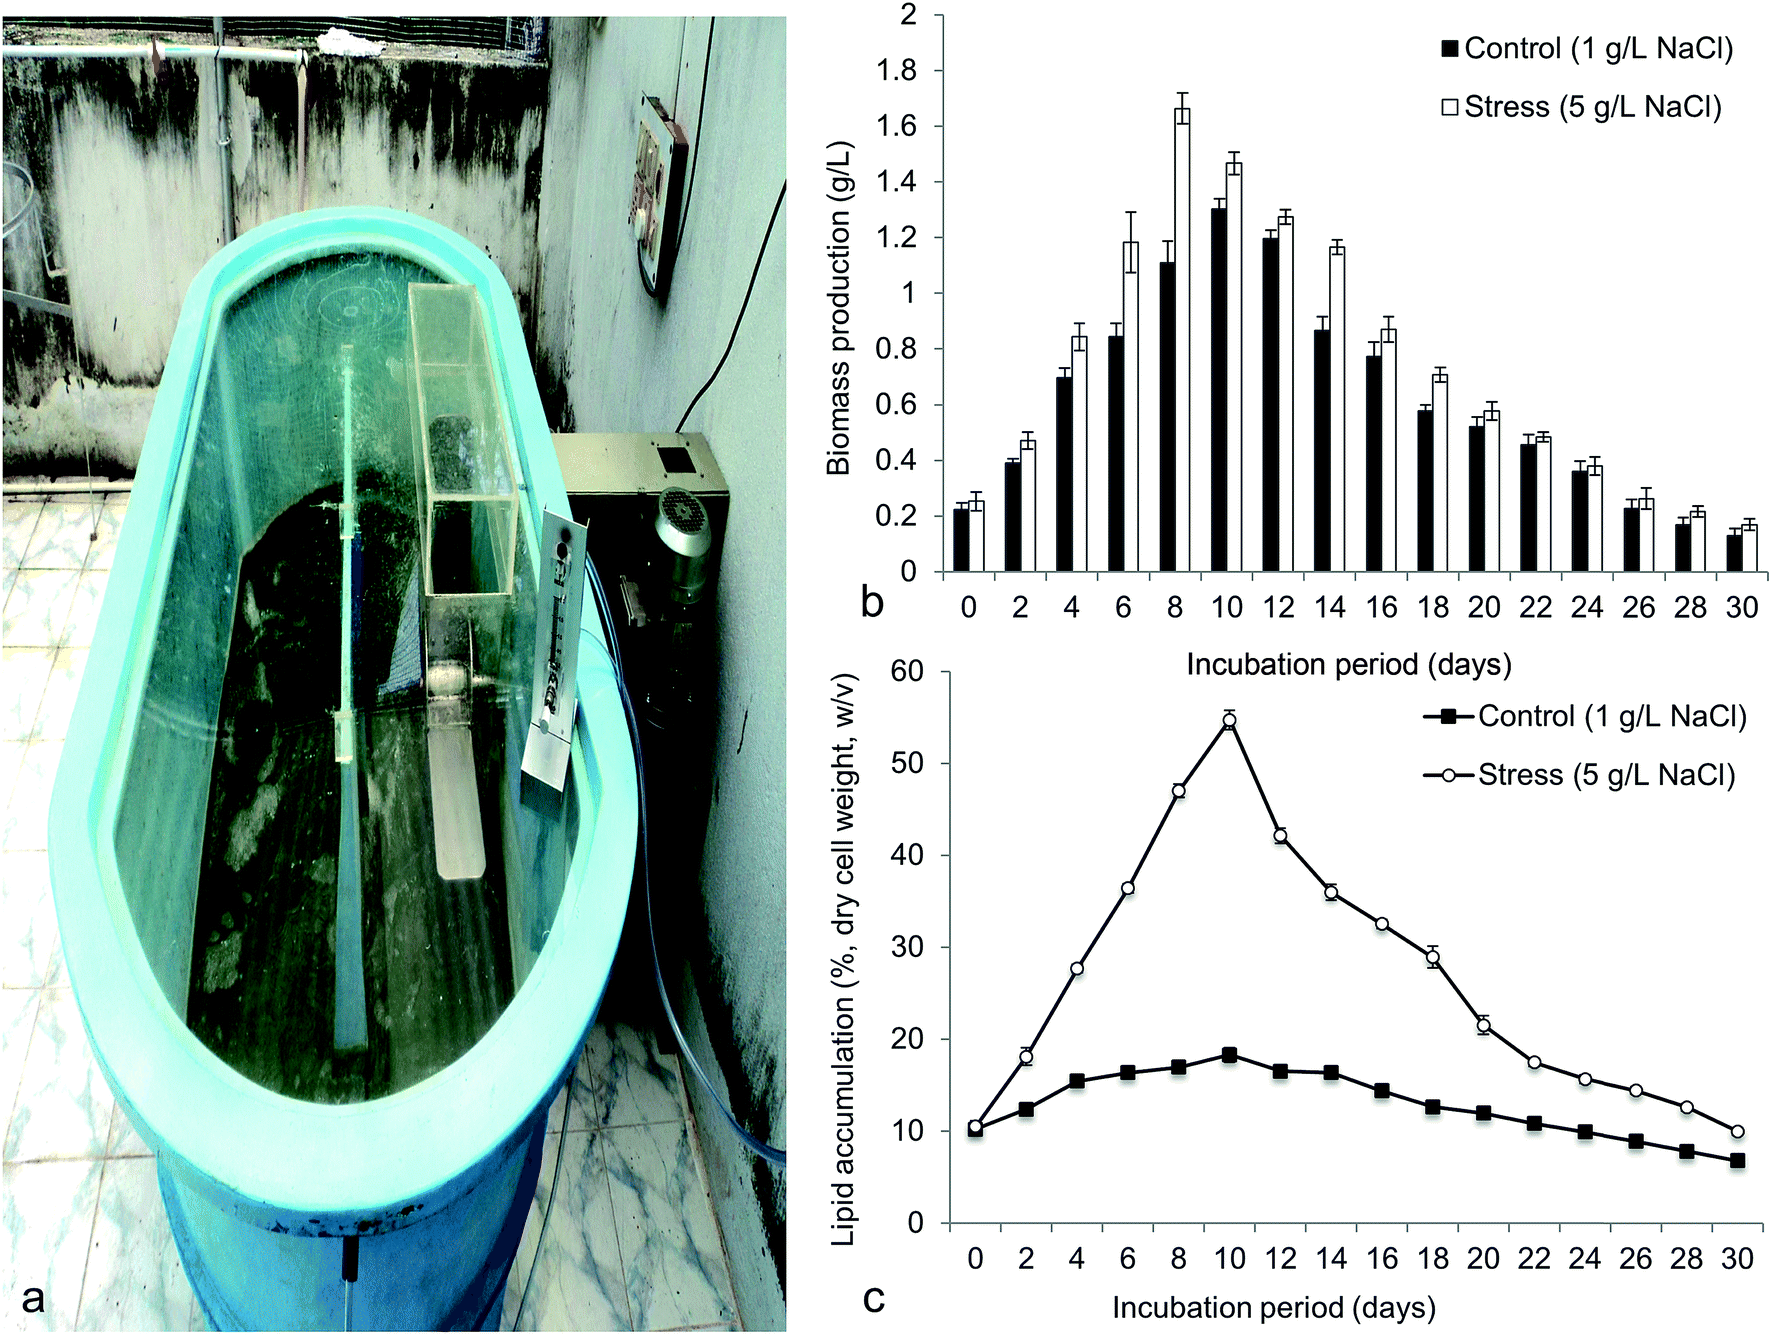
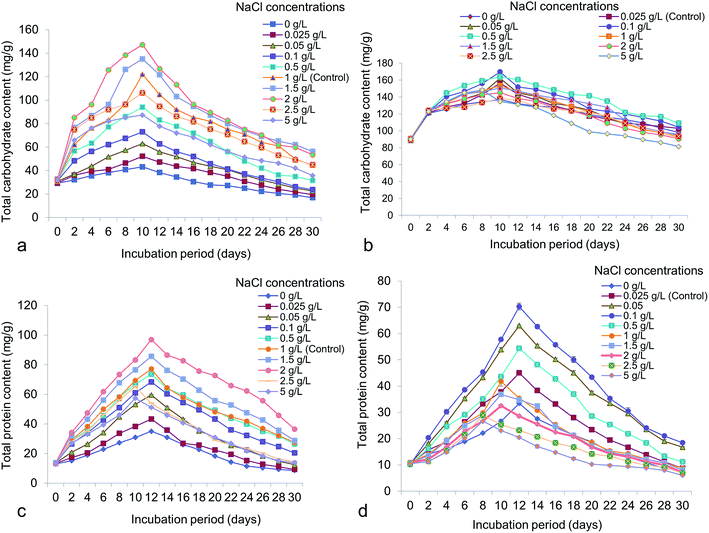
Fig. 9 demonstrated the biomass production (g L−1) and lipid content (%, dry biomass weight) in 800 L capacity (working volume 300 L) outdoor hybrid PBR. The 5 g L−1 NaCl was used to obtain maximum biomass and lipid as standardized in the laboratory. The highest biomass obtained in hybrid reactor was 1.66 ± 0.09 g L−1 at 8 days, which was greater than the control (1.30 ± 0.06 g L−1 at 10 days) (Fig. 9b). Interestingly, maximum lipid content achieved was 54.73 ± 1.78% w/v (at 10 days) that was 3 times greater than the control (18.30 ± 1.35% w/v at 10 days) (Fig. 9c). Maximum volumetric productivity for biomass and lipid respectively obtained was 0.207 g L−1 d−1 and 175.31 mg L−1 d−1 at 8–10 days cultivation period. The volumetric data obtained was found to be better than the conventional photobioreactors or open raceway ponds.21,22,57 In large-scale cultivation, the growth of the microalgae was limited but significantly the lipid content was improved due to several environmental factors.22 The hybrid PBR maintained both the internal conditions with ambient nutrient and outer environment with temperature and light. But most of the reactors used to cultivate microalgae are either open or closed.21,57 Biomass yield and lipid yield in Botryococcus was found to be 2 g L−1 (w/w) and 14.3%, when cultivated in open raceway ponds.57 Frumento et al. reported high lipid content but low biomass yield of Chlorella vulgaris cultivated in tubular PBR that was found to be similar to our study.22 The large-scale cultivation of Chlorella ellipsoidea in hybrid PBR at high salt concentration (5 g L−1) was standardized in outdoor for the first time. This study showed rapid lipid accumulation in the test microalgae in outdoor cultivation compared to the indoor culture. This strategy was found to be best for biodiesel application.
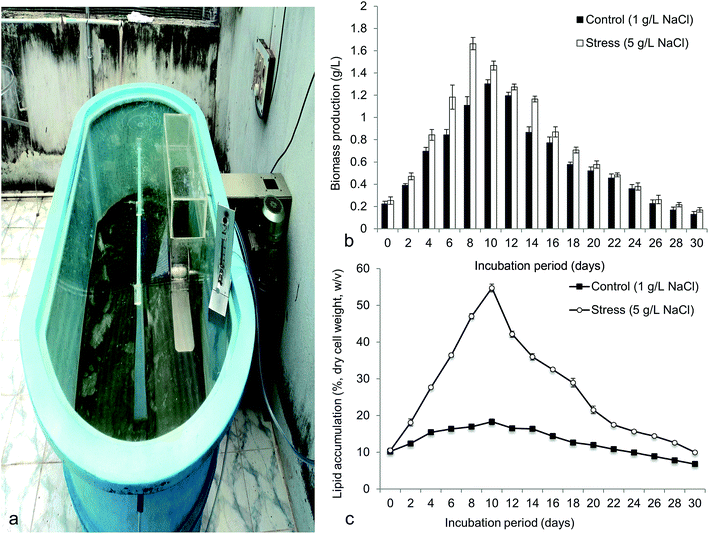 |
| | Fig. 9 Showing (a) mass cultivation of Chlorella ellipsoidea in open-closed hybrid photobioreactor of 800 L capacity (working volume 300 L) (b) biomass yield and (c) total lipid content of Chlorella ellipsoidea at optimized NaCl concentration. | |
Conclusion
Microalgal oil production is based on three most important aspects, which are growth rate, final cell density and total lipid per cell. Chlorella ellipsoidea and Chlorococcum infusionum showed high growth rate and lipid accumulation levels at 5 g L−1 and 1.5 g L−1 NaCl respectively. For lipid accumulation study both lipidomic and cytomic approaches have been conducted under different NaCl concentrations. GC-MS analysis of FAME showed significant changes in neutral and polar lipid fraction under NaCl stress. C14:0, C16:0, C16:1, C18:1, C18:2 were major fatty acids found in the studied microalgae. Fluorescence intensity (% positive stained cells) was significantly high in neutral and polar lipid fractions of Chlorella and Chlorococcum under high NaCl concentration. Flow cytometric study also demonstrated high fluorescence signals for polar and neutral lipids under salinity stress. FTIR spectral analysis demonstrated the presence of hydroxyl and ketone groups in lipids in stressed microalgae. We for the first time reported the large-scale cultivation of Chlorella ellipsoidea under NaCl repleted medium that showed high lipid yield. Hence, salinity may be considered as the most important key regulator for growth and lipid accumulation in microalgae. Integrated strategy was found to be successful for biodiesel application in microalgae.
Conflict of interest
The authors do not have any potential conflict of interest.
Acknowledgements
This research was supported by the Department of Science and Technology (Grant no. DST/IS-STAC/CO2-SR-166/13(G)), New Delhi, Government of India.
References
- N. Lu, D. Wei, X.-L. Jiang, F. Chen and S.-T. Yang, Process Biochem., 2012, 47, 1163–1170 CrossRef CAS.
- L. Yao, J. A. Gerde and T. Wang, J. Am. Oil Chem. Soc., 2012, 89, 2279–2287 CrossRef CAS.
- G. G. Satpati, P. C. Gorain and R. Pal, Adv. Biol., 2016, 2016, 1–12 CrossRef.
- G. G. Satpati and R. Pal, Ann. Microbiol., 2015, 65, 937–949 CrossRef CAS.
- G. G. Satpati, S. K. Mallick and R. Pal, Biotechnol. Bioprocess Eng., 2015, 20, 1044–1055 CrossRef CAS.
- M. Takagi, Y. Karseno and T. Yoshida, J. Biosci. Bioeng., 2006, 3, 223–226 CrossRef PubMed.
- X.-Q. Xu and J. Beardall, Phytochemistry, 1997, 45, 655–658 CrossRef CAS.
- G. Q. Chen, Y. Jiang and F. Chen, J. Phycol., 2008, 44, 1309–1314 CrossRef CAS PubMed.
- Y. Jiang and F. Chen, J. Ind. Microbiol. Biotechnol., 1999, 23, 508–513 CrossRef CAS.
- P. Kaewkannetra, P. Enmak and T. Y. Chiu, Biotechnol. Bioprocess Eng., 2012, 17, 591–597 CrossRef CAS.
- S. M. Renaud and D. L. Parry, J. Appl. Phycol., 1994, 6, 347–356 CrossRef CAS.
- N. Garcia, J. A. Lopez-Elias, A. Miranda, M. Martinez-Porchas, N. Huerta and A. Garcia, Lat. Am. J. Aquat. Res., 2012, 40, 435–440 CrossRef.
- A. Kirrolia, N. R. Bishnoi and N. Singh, J. Algal Biomass Utln., 2011, 2, 28–34 Search PubMed.
- R. Dineshkumar, S. K. Dash and R. Sen, RSC Adv., 2015, 5, 73381–73394 RSC.
- A. Karemore and R. Sen, RSC Adv., 2015, 5, 70929–70938 RSC.
- D. Xu, Z. Gao, F. Li, X. Fan, X. Zhang, N. Ye, S. Mou, C. Liang and D. Li, Bioresour. Technol., 2013, 127, 386–390 CrossRef CAS PubMed.
- V. Samburova, M. S. Lemos, S. Hiibel, S. K. Hoekman, J. C. Cushman and B. Zielinska, J. Am. Oil Chem. Soc., 2013, 90, 53–64 CrossRef CAS.
- H. T. Wang, C. H. Yao, Y. N. Liu, Y. Y. Meng, W. L. Wang, X. P. Cao and S. Xue, J. Appl. Phycol., 2015, 27, 249–255 CrossRef CAS.
- L. M. L. Laurens and E. J. Wolfrum, BioEnergy Res., 2011, 4, 22–35 CrossRef.
- J. N. Murdock and D. L. Wetzel, Appl. Spectrosc. Rev., 2009, 44, 335–361 CrossRef CAS.
- Y. Chisti, Biotechnol. Adv., 2007, 25, 294–306 CrossRef CAS PubMed.
- D. Frumento, A. A. Casazza, S. L. Arni and A. Converti, Biochem. Eng. J., 2013, 81, 120–125 CrossRef CAS.
- Y. Shen, RSC Adv., 2014, 4, 49672–49722 RSC.
- C. Zarrouk, Contribution a letude dune cyanophyceae. Influence de divers facteurs physiques etchimiquessur la croissanceet la photosynthese de Spirulina maxima, PhD thesis, University of Paris, Geitler, 1966.
- H. C. Bold, Bull. Torrey Bot. Club, 1949, 76, 101–108 CrossRef.
- R. C. M. Alves Sobrinho, L. Vauchinski, R. R. de Moura, E. G. Primel, P. C. V. Abreu and M. G. Montes D'Oca, J. Am. Oil Chem. Soc., 2015, 92, 423–430 CrossRef CAS.
- N. Barman, G. G. Satpati, S. Sen Roy, N. Khatoon, R. Sen, S. Kanjilal, R. B. N. Prasad and R. Pal, J. Algal Biomass Utln., 2012, 3, 42–49 Search PubMed.
- D. I. Arnon, Plant Physiol., 1949, 24, 1–15 CrossRef CAS PubMed.
- B. H. Davies, Analysis of carotenoid pigments, in Chemistry and Biochemistry of Plant Pigments, ed. T. W. Goodwin, Academic Press, New York, 1965, pp. 489–532 Search PubMed.
- R. Johanson, Nature, 1953, 171, 176–177 CrossRef CAS PubMed.
- O. H. Lowry, N. J. Rosebergh, A. L. Rarr and R. J. Randall, J. Biol. Chem., 1951, 193, 265–275 CAS.
- AOCS, Official Methods and Recommended Practices of the American Oils Chemists Society, ed. D. Firestone, AOCS Press, Champaign, USA, 5th edn, 1998, pp. 1–25 Search PubMed.
- K. Krisnangkura, J. Am. Oil Chem. Soc., 1986, 63, 552–553 CrossRef CAS.
- European Standard EN 14214, European standards for biodiesel, 2003, http://www.din.de, accessed on 08.07.2015.
- ASTM, American Standards for Testing of Materials, D 4052–96, D 240-02, D 482–74, 2003 Search PubMed.
- G. Vicente, M. Martınez and J. Aracil, Bioresour. Technol., 2004, 92, 297–305 CrossRef CAS PubMed.
- K. Fischer, Angew. Chem., 1935, 48, 394–396 CrossRef CAS.
- S. Ruangsomboon, Bioresour. Technol., 2012, 109, 261–265 CrossRef CAS PubMed.
- M. U. G. Barros, A. A. da Cruz Coelho, J. W. A. da Silva, J. H. C. Bezerra, R. T. Moreira, W. R. L. Farias and R. L. Moreira, Biotemas, 2014, 27, 1–8 CrossRef.
- P. C. Gorain, S. K. Bagchi and N. Mallick, Environ. Technol., 2013, 34, 1887–1894 CrossRef CAS PubMed.
- K. K. Sharma, H. Schuhmann and M. Schenk, Energies, 2012, 5, 1532–1553 CrossRef CAS.
- Z. Shunni, W. Zhangming, S. Changhua, Z. Weizheng, Y. Kang and Y. Zhenhong, Progr. Chem., 2011, 23, 2169–2176 Search PubMed.
- Y. Zhu and N. T. Dunford, J. Am. Oil Chem. Soc., 2013, 90, 841–849 CrossRef CAS.
- A. Ben-Amotz, T. G. Tornabene and W. H. Thomas, J. Phycol., 1985, 21, 72–81 CrossRef CAS.
- H. M. Guzman, A. d. l. J. Valido, L. C. Duarte and K. F. Presmanes, Aquacult. Int., 2010, 18, 189–199 CrossRef CAS.
- S. Fujii, M. Uenaka, S. Nakayama, R. Yamamoto and S. Mantani, Phycol. Res., 2001, 49, 73–77 CrossRef CAS.
- H. Hu and K. Gao, Biotechnol. Lett., 2006, 28, 987–992 CrossRef CAS PubMed.
- N. O. Zhila, G. G. Kalacheva and T. G. Volova, J. Appl. Phycol., 2010, 23, 47–52 CrossRef.
- C. Fuentes-Grunewald, A. Garces, E. Alacid, N. Sampedro, S. Rossi and J. Camp, J. Ind. Microbiol. Biotechnol., 2012, 39, 207–216 CrossRef CAS PubMed.
- H. M. Guzman, A. d. l. J. Valido, L. C. Duarte and K. F. Presmanes, J. Appl. Phycol., 2011, 23, 7–15 CrossRef CAS.
- A. Jamers, M. Lenjou, P. Deraedt, D. V. Bockstaele, R. Blust and W. De Coen, Eur. J. Phycol., 2009, 44, 541–550 CrossRef CAS.
- A. K. Rai and G. Abraham, Bull. Environ. Contam. Toxicol., 1993, 51, 724–731 CAS.
- A. N. Vonshak, K. B. Bunang and M. Tanticharoen, J. Appl. Phycol., 1996, 8, 119–124 CrossRef.
- A. B. El-Sayed, Nat. Sci., 2010, 8, 34–40 Search PubMed.
- S. K. Bagchi and N. Mallick, RSC Adv., 2016, 6, 29889–29898 RSC.
- F. Anwar, U. Rashid, M. Ashraf and M. Nadeem, Appl. Energy, 2010, 87, 779–785 CrossRef CAS.
- C. Dayananda, A. Kumudha, R. Sarada and A. Ravishankar, Sci. Res. Essays, 2010, 5, 2497–2505 Search PubMed.
|
| This journal is © The Royal Society of Chemistry 2016 |
Click here to see how this site uses Cookies. View our privacy policy here.