
Sensitive and accurate determination of neurotransmitters from in vivo rat brain microdialysate of Parkinson's disease using in situ ultrasound-assisted derivatization dispersive liquid–liquid microextraction by UHPLC-MS/MS†
Xian-En Zhao*a,
Yongrui Hea,
Ping Yana,
Na Weia,
Renjun Wanga,
Jing Sunb,
Longfang Zhenga,
Shuyun Zhua and
Jinmao Youa
aShandong Provincial Key Laboratory of Life-Organic Analysis & Key Laboratory of Pharmaceutical Intermediates and Analysis of Natural Medicine, College of Chemistry and Chemical Engineering, Qufu Normal University, Qufu 273165, Shandong, P. R. China. E-mail: xianenzhao@163.com
bQinghai Key Laboratory of Qinghai-Tibet Plateau Biological Resources & Key Laboratory of Tibetan Medicine Research, Northwest Institute of Plateau Biology, Chinese Academy of Science, Xining 810001, Qinghai, P. R. China
First published on 9th November 2016
Abstract
A simple, rapid, sensitive and environmentally friendly ultrasound-assisted in situ derivatization dispersive liquid–liquid microextraction (in situ UA-DDLLME) method followed by ultra high performance liquid chromatography-tandem mass spectrometry (UHPLC-MS/MS) has been developed for the simultaneous determination of amino acid neurotransmitters (AANTs) and monoamine neurotransmitters (MANTs) in rat brain microdialysates and baicalein in blood microdialysates of Parkinson's disease (PD) rats with in vivo multiple sites microdialysis in this work. A novel MS sensitive derivatization reagent 4′-carbonyl chloride rosamine (CCR) with a permanent positive charged moiety, has been designed, synthesized and reported for simultaneous labelling of amino and hydroxyl groups in neurotransmitters. Under the selected conditions, the derivatization and microextraction of analytes were simultaneously completed within 1.0 min. Good linearity for each analyte (R > 0.992) was observed with a low limit of detection (LOD, S/N > 3). Taken together, in situ UA-DDLLME coupled with UHPLC-MS/MS analysis was demonstrated to be a promising method for sensitive, accurate and simultaneous monitoring of AANTs and MANTs in rat brain and baicalein in rat blood. This method would be expected to be highly useful in PD clinical diagnostics and monitoring the efficacy of treatments.
1. Introduction
Neurotransmitters (NTs) play a vital role in the nervous system to regulate a variety of biological processes and behaviors. NTs include amino acid neurotransmitters (AANTs), such as glutamate (Glu) and its metabolite c-aminobutyric acid (GABA), and monoamine neurotransmitters (MANTs), including L-3,4-dihydroxyphenylalanine (L-DOPA), dopamine (DA), 5-hydroxytryptamine (5-HT) etc., and their metabolites 3-methoxytyramine hydrochloride (3-MT), 3,4-dihydroxyphenylacetic acid (DOPAC), homovanillic acid (HVA) and 5-hydroxyindole-3-acetic acid (5-HIAA) etc. The biosynthetic and metabolic pathway and the chemical structures of the NTs and 2,3- and 2,5-dihydroxybenzoic acids (DHBA) were shown in Fig. 1A. Perturbations or changes of these NTs in neurons, specifically, in the microdialysates, have been linked to some CNS disorders such as Parkinson's disease (PD), Alzheimer's disease (AD) and depression.1–3 The current clinical diagnosis of these neurodegenerative diseases remains subjective based on descriptive symptoms. Trace-level measurements in biological specimens are especially important in studying the NT metabolism profile and the role of NTs and their metabolites in neurophysiology, behavioral effects, pathology, disease diagnosis, and control.4–7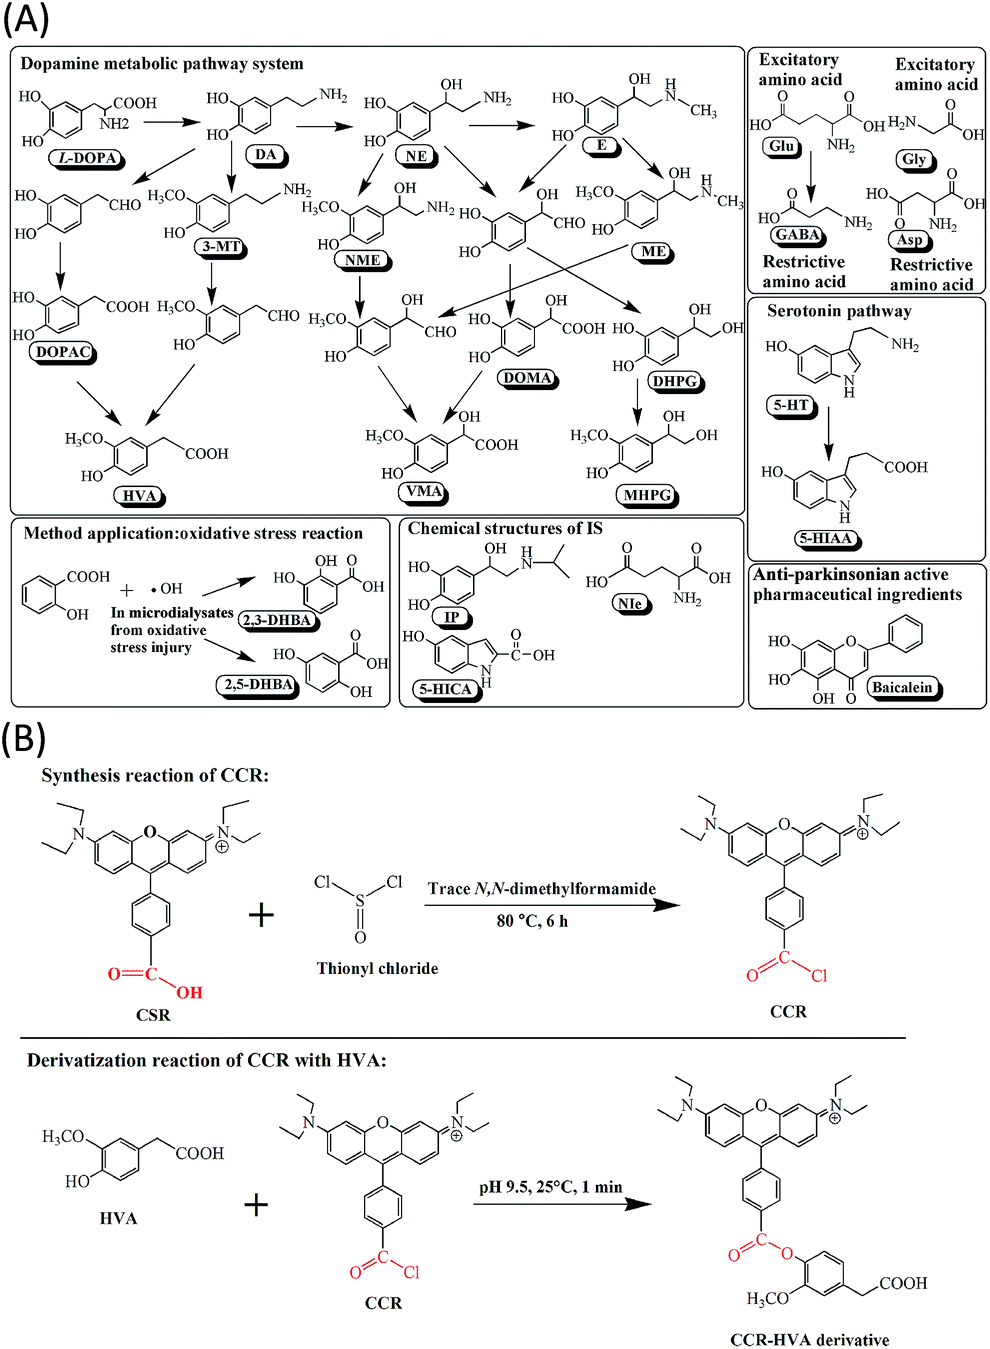 | ||
| Fig. 1 Schematic of (A) biosynthetic and metabolic pathway and the chemical structures of the NTs and 2,3- and 2,5-dihydroxybenzoic acids (DHBA), (B) derivatization reaction of CCR with HVA. | ||
In vivo measurements enable study of the relationship between NTs concentrations in relevant brain nuclei and behavior, drug effects, or disease states. Since its inception, in vivo microdialysis sampling has been the preeminent tool for making such measurements.8–10 When it is coupled to an analytical system, in vivo microdialysis can provide near real time information on the time-dependent concentration changes of analytes in the extracellular space or other aqueous environments. The utility of microdialysis has been invaluable for NTs and their metabolites in the analysis methodology field of neurochemistry, psychiatric and neurologic disease, and is also used clinically for studying epilepsy and brain trauma.1,8–10 Using several microdialysis probes, simultaneous sampling from various sites in a single animal avoids the problems associated with intra-animal variability for pharmacokinetic study.11 In this work, multiple sites sampling was developed to provide detailed concentration changes of NTs and dihydroxyl benzoic acid (DHBA) and pharmacokinetic information of baicalein.
Currently, many methods have been developed to detect NTs. Among the earliest techniques are the radioenzymatic and immunological assays, which have been replaced by more sensitive and selective detection methods. Among them, the most frequently used methods are capillary electrophoresis,2 electrochemical (ECD),12,13 biosensors,8 fluorescence detection (FLD),14 ultraviolet (UV),2 and mass spectrometric (MS).1,4,15,16 However, NTs exist in biological samples at extremely low concentrations, chemically unstable, and the potential chromatographic interferences that co-eluted are also present.6,17 Additionally, relatively few biosensor or microelectrode methods offer the ability to detect more than one analyte at a time. Ultra high-performance liquid chromatography tandem mass spectrometry (UHPLC-MS/MS) using multiple reaction monitoring (MRM) detection allows a rapid, sensitive and specific quantification of multi-analytes in a short chromatographic separation. Moreover, mass spectrometry can be used as selective tool because the detection of the analyte correlates two aspects: the structural information and its molecular weight (and not only to the retention time). However, most UHPLC-MS/MS methods for NTs still lack sensitivity because of the high polarity of analytes, in turn, a derivatization step is an efficient method that modifies a functional group in the molecule by introducing a charged or proton acceptor moiety. This facilitates the retentions of analytes in the chromatography separation, removes endogenous interferences and enhances sensitivity by promoting ionization in the electrospray ionization (ESI) mass spectrometry source, which has been reported by Feng et al.18–20
Recently, various derivatization reagents have been reported such as benzoyl chloride, ethylation, dansyl chloride (DNS-Cl), triphenylphosphonium bromide (SPTPP), 10-ethyl-acridone-3-sulfonyl chloride (EASC).1,4,5,16,21,22 Although the above mentioned derivatization methods coupled with LC-MS/MS techniques significantly improved the sensitivity and selectivity, these pre-column derivatization reagents had more or less limitations in their applications, such as poor stability of derivatives, long labeling time or not uniform, low detection sensitivity or specificity, operational inconvenience, or serious interferences.22 A novel MS sensitive derivatization reagent 4′-carbonyl chloride rosamine (CCR) with a permanent positive charged moiety, has been designed, synthesized and reported for simultaneous labeling amino and hydroxyl groups of NTs, DHBA and baicalein in this work. The synthesized reaction of CCR and the representative derivatization reaction of CCR with HVA were shown in Fig. 1B.
However, the excess derivatization reagents from derivatization procedure could bring strong matrix interferences and serious damage for subsequent LC-MS/MS detection. Therefore, sample pretreatment was needed before instrumental analysis to obtain sensitive and reproductive results. Dispersive liquid–liquid microextraction (DLLME) overmatched solid phase microextraction (SPME) and liquid phase microextraction (LPME) via its significantly larger mass transfer area and was convenient, rapid and sensitive. Since DLLME inception in 2006, the various modifications of primary DLLME reported in the literature so far can be categorized as microextraction coupled with derivatization,23–25 ionic liquid-based dispersive liquid–liquid microextraction (IL-DLLME), ultrasound-assisted dispersive liquid–liquid microextraction (UADLLME), low-toxicity dispersive liquid–liquid microextraction, dual dispersive liquid–liquid microextraction and novel automated DLLME.26–29 In situ derivatization and microextraction was gaining more and more interest in sample preparation due to rapid, simple and efficient analysis of analytes.30,31 The aim of simultaneous derivatization and microextraction of the analytes in a single step was to simplify the sample extraction step, reduce the sample size and the consumption of solvents and improve the sensitivity. In this work, the combination of simultaneous UADLLME and derivatization using CCR has been developed for the simultaneous analysis of NTs and DHBA in brain microdialysates and baicalein in blood microdialysates of PD rats by UHPLC-MS/MS (MRM).
In order to achieve the trace-level measurements of NTs and evaluate the anti-Parkinson effect of baicalein by this method, an low toxic in situ UA-DDLLME method followed by UHPLC-MS/MS (MRM) has been developed and validated to simultaneously determine the concentrations of a panel of NTs and baicalein of PD model rats. CCR was designed, synthesized and reported as MS derivatization reagent for the analysis of NTs, DHBA and baicalein. It showed some advantages including mild derivatization conditions, ease of handling and high detection sensitivity. This method might be a useful tool in diagnosis and therapy of PD, which could benefit further neurological disease research in both drug discovery and clinical medicine.
2. Experimental
2.1. Chemical and reagents
L-DOPA, DA, norepinephrine (NE), epinephrine (E), 3-MT, normetanephrine (NME), metanephrine (ME), DOPAC, DL-3,4-dihydroxymandelic acid (DOMA), DL-3,4-dihydroxyphenyl glycol (DHPG), HVA, vanillylmandelic acid (VMA), 4-hydroxy-3-methoxyphenylglycol (MHPG), 5-HT, 5-hydroxyindole-3-acetic acid (5-HIAA), Glu, GABA, glycine (Gly) and aspartic acid (Asp) were purchased from Sigma (St. Louis, MO, USA). The internal standards (IS) isoprenaline (IP) hydrochloride, 5-hydroxyindole-2-carboxylic acid (5-HICA), norleucine (NIe), DHBA was analytical grade and purchased from Sigma Aldrich (St. Louis, MO, USA). 5-HICA was used as IS for 5-HT and 5-HIAA. NIe was used as IS for Glu, GABA, Gly and Asp, and while IP was used as IS for the left 13 MANTs, DHBA and baicalein. Chloroform, tetrachloromethane, bromocyclohexane, bromobenzene 4-methyl-1-bromobenzene, 4-bromoanisole, methanol, acetone, ethanol and acetonitrile were purchased from Shanghai Chemical Reagent (Shanghai, China). HPLC grade acetonitrile and methanol were purchased from Fisher Scientific (Fair Lawn, NJ, USA). Water was purified by a Milli-Q water purification apparatus (Bedford, MA, USA). Formic acid and acetic acid were of HPLC grade which from Tedia company (Fairfield, Ohio, USA). Baicalein (99% purity) was supplied by National Institutes for Food and Drug Control (Beijing, China). 6-Hydroxydopamine (6-OHDA) and madopar were purchased from Sigma (St. Louis, MO, USA). All other reagents used were of HPLC grade or at least of analytical grade obtained commercially.Individual stock solutions (5 mM) of NTs and DHBA were prepared in acetonitrile/water mixed solution (v/v, 1![[thin space (1/6-em)]](https://www.rsc.org/images/entities/char_2009.gif) :1). An aliquot of each stock was pipetted into a new volumetric flask to generate a mixed stock solution (0.5 mM) of analytes for UHPLC-MS analysis, which was prepared by diluting the stock solutions with acetonitrile/water. The baicalein solution (1 mM) was prepared by dissolving 2.7 mg in 10 mL of acetonitrile.
:1). An aliquot of each stock was pipetted into a new volumetric flask to generate a mixed stock solution (0.5 mM) of analytes for UHPLC-MS analysis, which was prepared by diluting the stock solutions with acetonitrile/water. The baicalein solution (1 mM) was prepared by dissolving 2.7 mg in 10 mL of acetonitrile.
A mixed stock solution of internal standards containing IP, 5-HICA and NIe was prepared by weighing the standards and then dissolved by acetonitrile/water mixed solution (v/v, 1:1). The internal standard was prepared at 0.5 mM and diluted to 0.5 μM with acetonitrile during sample analysis.
The CCR solution (5 mM) was prepared by dissolving 23.1 mg CCR in 10 mL of acetonitrile. NaHCO3–Na2CO3 buffer (pH 9.5, 0.1 M) was prepared and adjusted to pH 9.5 using sodium hydroxide solution.
2.2. Instrumentation
UHPLC-MS/MS analysis was carried out on an Agilent 1290 series UHPLC system coupled with an Agilent 6460 Triple Quadrupole MS/MS system (Agilent, USA) equipped with ESI source. UHPLC separation was achieved using a SB C18 column (2.1 mm × 50 mm, 1.8 μm, Agilent, USA). An automatic electronic water bath (Jintan, Jiangshu, China), a Xiangzhi TGL16M high-speed refrigerated centrifuge (Changsha, Hunan, China), a KQ2200E ultrasonic cleaner (Kunshan, Zhengjiang, China, ultrasound frequency 40 kHz, ultrasound power 100 W, heating power 200 W, 23 cm × 14 cm × 100 cm), and a VX-200 vortex mixer (Labnet, New Jersey, USA) were equipped for derivatization and UA-DDLLME experiments.In vivo microdialysis sampling was accomplished by using a CMA 402 Syringe Pump (CMA, Solna, Sweden), a CMA 120 System (CMA, Solna, Sweden) for freely moving animals, and a microdialysis MAB6 probe (Stockholm, Sweden). The probe was perfused with Ringer's solution (5 mmol L−1) at a flow rate of 2.0 μL min−1 and ASI stereotaxic flat skull coordinates (ASI Instruments Inc., MI, USA).
2.3. Synthesis of CCR
The synthesis reaction schematic of CCR is shown in Fig. 1B. Synthesis of 4′-carboxy-substituted rosamine (CSR) was described in our previously reported.31 In this work, derivatization reagent CCR was synthesized for the first time as follows: 0.922 g of CSR, 30.0 mL of thionyl chloride and 0.1 mL of N,N-dimethyl formamide were added into a 100 mL of single-necked flask. After stirring at 80 °C for 6 h, the solution was concentrated by a rotary evaporator to yield a purple residue. The crude product was recrystallized from diethyl ether to give the purple crystal 0.42 g (CCR, yield 45.5%). The ESI-MS molecular ion of the derivative of CCR-phenylamine was at m/z 518.3 ([M + H]+). The absorption maximum was at 558 nm in ethanol. 1H NMR (400 MHz, CD3Cl): δ = 1.32 (t, J = 7.2 Hz, 12H, 4 × CH3), 3.68 (q, J = 7.2 Hz, 8H, 4 × CH2), 6.93 (d, J = 2.4 Hz, 2H, 4-H and 5-H), 7.01 (dd, J = 9.6, 2.4 Hz, 2H, 2-H and 7-H), 7.39 (d, J = 9.6 Hz, 2H, 1-H and 8-H), 7.45 (d, J = 8.4 Hz, 2H, 2′-H and 6′-H), 8.10 (d, J = 8.4 Hz, 2H, 3′-H and 5′-H) ppm.2.4. In situ UA-DDLLME procedure
For the in situ UA-DDLLME procedure, 20 μL of microdialysates (or standard solutions) and 10 μL of ISs solutions were placed in a 1.5 mL tube, then 800 μL of NaHCO3–Na2CO3 buffer (pH 9.5) was added. After that, 150 μL of CCR derivatization reagent solution of acetonitrile (as dispersant) and 80 μL of 4-bromoanisole (extractant) was rapidly injected using syringe. The tube was tightly capped and shaken vigorously for 10 s, then the resultant cloudy solution was placed in an ultrasound bath for simultaneous derivatization and microextraction for 1.0 min. 4-Bromoanisole was dispersed into fine droplets by ultrasound. In this step, the CCR-derivatives were extracted from the aqueous phases into the fine droplets of 4-bromoanisole. The sedimented phase was withdrawn by a syringe and subsequently stored in an insert vail which was diluted to 50 μL with acetonitrile for automated injection. Finally, 2.0 μL of samples were injected for UHPLC-MS/MS analysis. The analysis of baicalein was similar to the above.2.5. Animals and drug treatments
Sprague–Dawley rats (8 weeks, body weight: 200 ± 20 g), provided by Shandong Lukang pharmaceutical Co., Ltd. and were maintained in a germ-free environment and allowed free access to food and water. All animal experiments were performed in accordance with the principles of care and use of laboratory animals and were approved by the experiment animal administration committee of China. The 16 rats were randomly divided into three groups (n = 8): group I, normal rats; group II, PD-drugs rats: the rats in group II experienced 3 stages, stage A, the rats were induced with 6-OHDA-lesioned resulting in PD model (a neurotoxin that selectively destroys catecholaminergic neurons), 120 min later; stage B, the rats were treated with baicalein (200 mg kg−1, the dose of baicalein was consistent with Du32), after the effect of baicalein disappeared for 120 min, rats entered into stage C with madopar treated (30 mg kg−1, L-DOPA 24 mg kg−1, enserazide hydrochloride 6 mg kg−1). PD model rats in group II were induced and accepted tremors test, according to the preciously report.33 PD rats were anesthetized with 20% urethane (1.2 g kg−1, i.p.) before sample preparation surgery, and remained anesthetized throughout the experimental period. The rat's body temperature was maintained at 37 °C during the experimental procedure. And then fixed on a stereotaxic apparatus, then 8 μg of 6-OHDA in 1 μL of 0.2% ascorbic acid saline solution was injected into the striatum (A: +0.2 mm, L: +3 mm, V: 7.5 mm). The guide cannula was kept in place with three skull screws and dental cement. The rats in normal group were given the same volume of saline. After the injection, the needle was kept in place for 15 min to allow for diffusion of the toxin away from the injection site to prevent back-flow. After 21 days of injection, the rats received rotate test, only those rats showing at least 210 turns during the 30 min rotate test (unilateral 6-OHDA-lesioned rats) were selected for further study.2.6. In vivo multiple sites microdialysis sampling
After the last behavioral assessment, rats in PD group were allowed to recover and in vivo microdialysis sampling experiments were performed later (CMA 120, Sweden). Stainless steel dummy blockers were inserted into the guide-cannula and fixed until the insertion of the microdialysis probe. Animals were awake and freely moving with access to food and water throughout the experiment. The brain microdialysis probe (MAB6) was perfused with 5 mM salicylic acid Ringer's solution at rate of 2.0 μL min−1 using a microinjection pump (CMA 402, Sweden) and microsyringe (CMA, 1.0 mL) for one hour to reach baseline values. Next, 20 μL of microdialysates of brain and 20 μL of blood microdialysates were collected every 10 min, and used for the following pretreatment procedure.2.7. UHPLC-MS/MS conditions
Gradient elution was performed with water (containing 0.1% formic acid) as mobile phase A and acetonitrile (0.1% formic acid) as mobile phase B. The mobile phases were eluted at 0.2 mL min−1 and the column temperature was maintained at 30 °C. For NTs and DHBA the gradient as follows: 0 min, 5% B; 3 min, 15% B; 5 min 35% B; 12–16 min, 95% B. For baicalein the gradient as follows: 0 min, 45% B; 2 min, 70% B; 2.5–3 min, 95% B. To protect the mass spectrometer from contaminations during the first minute after injection the flow was diverted to waste. The sample volume injected was maintained at 2.0 μL.The mass spectrometer was operated in multiple reaction monitoring (MRM) mode. The optimal mass spectrometer conditions were as follows: drying gas temperature 300 °C; drying gas flow rate 9 L min−1; nebulizer gas pressure 40 psi; sheath gas temp 280 °C; sheath gas flow 8 L min−1 and capillary voltage 3.5 kV. The collision energy (CE) and fragmentor voltage (FV) were also optimized for the corresponding target compound. The data was acquired with MRM in the positive ion mode. The MRM transitions, CEs and FVs are summarized in Table 1.
| Analytes | Fragmentor (V) | Quantitation transition (m/z) | Collision energy (eV) | Confirmation transition (m/z) | Collision energy (eV) |
|---|---|---|---|---|---|
| L-DOPA | 240 | 1473.7 > 398.1 | 58 | 1473.7 > 443.1 | 50 |
| DA | 240 | 1429.7 > 398.1 | 60 | 1429.7 > 535.2 | 55 |
| NE | 240 | 1445.7 > 398.1 | 60 | 1445.7 > 551.1 | 55 |
| E | 210 | 1459.7 > 398.1 | 55 | 1459.7 > 443.1 | 53 |
| 3-MT | 240 | 1017.5 > 398.1 | 60 | 1017.5 > 535.2 | 55 |
| NME | 240 | 1033.5 > 398.1 | 60 | 1033.5 > 535.2 | 55 |
| ME | 240 | 1047.5 > 398.1 | 60 | 1047.5 > 535.2 | 55 |
| DOPAC | 240 | 1018.4 > 398.1 | 62 | 1018.4 > 443.1 | 58 |
| DOMA | 240 | 1034.4 > 398.1 | 62 | 1034.4 > 443.1 | 58 |
| DHPG | 240 | 1020.5 > 398.1 | 62 | 1020.5 > 443.1 | 60 |
| HVA | 220 | 607.2 > 398.1 | 60 | 607.2 > 443.1 | 55 |
| VMA | 220 | 623.2 > 398.1 | 60 | 623.2 > 443.1 | 55 |
| MHPG | 220 | 609.3 > 398.1 | 60 | 609.3 > 443.1 | 55 |
| 5-HT | 240 | 1026.5 > 398.1 | 60 | 1026.5 > 558.2 | 55 |
| 5-HIAA | 240 | 616.2 > 398.1 | 60 | 616.2 > 443.1 | 55 |
| 2,3-DHBA | 240 | 1004.4 > 398.1 | 62 | 1004.4 > 443.1 | 58 |
| 2,5-DHBA | 240 | 1004.4 > 398.1 | 62 | 1004.4 > 443.1 | 58 |
| Glu | 220 | 572.2 > 398.1 | 65 | 572.2 > 485.1 | 58 |
| GABA | 220 | 528.2 > 485.1 | 55 | 528.2 > 443.1 | 62 |
| Gly | 220 | 500.2 > 398.1 | 60 | 500.25 > 443.1 | 55 |
| Asp | 220 | 558.2 > 398.1 | 60 | 558.2 > 443.1 | 58 |
| IP | 240 | 1503.8 > 398.1 | 60 | 1503.8 > 443.1 | 55 |
| 5-HICA | 220 | 602.2 > 398.1 | 60 | 602.2 > 443.1 | 58 |
| NIe | 220 | 556.3 > 398.1 | 60 | 556.3 > 443.1 | 55 |
| Baicalein | 220 | 1120.5 > 398.1 | 60 | 1120.5 > 443.1 | 60 |
2.8. Method validation
To determine the linearity range of this method, five batches of calibration microdialysates along with five blank samples were prepared and analyzed following the procedure mentioned above. As the inherent existence of the endogenous substances in the brain microdialysates matrix, the contribution of an endogenous level of each analyte as determined from the blank microdialysate has to be subtracted.4 The peak-area ratio between the analyte and internal standards of the blank sample was subtracted from that of the corresponding spiked microdialysate sample to give the increased peak-area ratio. The calibration curves were constructed by plotting the increased peak-area ratio with the spiked concentration using linear regression to generate calibration levels of 0.05–200 nM for MANTs and 3–15000 nM for AANTs and DHBA. LODs were defined as the lowest concentration at which the detection can reliably differentiate signal of the analyte peak from background noise (S/N ≥ 3). The LOQs of these methods were proved to be the lowest concentration on the calibration curve with a signal-to-noise ratio greater than ten.
The accuracy and precision of intra- and inter-day determination were carried out in six replicates at three QC levels (low, medium and high) within the same day and on three consecutive validation days. Accuracies were calculated as a percentage of the mean value measured over the nominal value at each concentration. Precisions were expressed in terms of relative standard deviation (RSD), defined as a percentage of the standard deviation divided by the mean. Precision was defined as the RSD (%), and accuracy was defined as RE (%).
As for the evaluation of derivatization efficiency, matrix effect (ME) and recovery in the quantification of CCR-derivatives, QC samples were prepared in quintuplicate at three concentration levels as shown in Table S1.† Derivatization efficiency (%) was determined by dividing the peak areas of underivatized analytes in a mixed standard derivatization solution with equal amount of analyte standards without derivatization procedure, and then the ratio was subtracted from 100%. Deviations of ME (%) below or above 100% indicated ion suppression or ion enhancement, respectively. To demonstrate applicability to real samples, the recovery using brain microdialysates and blood microdialysates spiked with standards was evaluated. For this purpose, standard solutions were added to the brain microdialysates and blood microdialysates, and the recovery was calculated on the basis of the results obtained by the proposed method. The recovery was expressed as (increased concentration/spiked concentration) × 100%. The stability of the derivatives was tested by analyzing the derivatization solution of 1.0 nM standards at 0, 1, 4, 8, 24, 48, 96 and 120 h after in situ UA-DDLLME procedure. During this period, derivatization solution was stored at room temperature.
3. Results and discussion
The aim of the proposed work was to develop and validate a sensitive, selective, accurate, simple and fast UHPLC-MS/MS method for the simultaneous determination of AANTs and MANTs in microdialysates.3.1. Comparison of derivatization regents and ionization efficiency (IE)
LRSC (lissamine rhodamine B sulfonyl chloride) is a commercial reagent which was used as derivatization reagent to label NTs in our previous work.6 LRSC has a similar parent structure to CCR, while the LODs of CCR-derivatives were lower of one order of magnitude than LRSC-derivatives as shown in Table 2. On the one hand, this may be attributed to the higher IE of CCR-derivative in ESI source. On the other hand, the structures of LRSC and its derivatives tended to be affected by pH of the solvent environment, the positive charge in the LRSC molecule would be lost easily. Compared with CCR with a permanent positive charge in the molecule, the IEs of LRSC-derivatives were lower, and brought about the disadvantages to the MS detection sensitivity of LRSC-derivatives (the reaction of 4-ethylphenol with LRSC and CCR, and the effects of pH to CCR and LRSC were shown in Fig. 2A). In order to confirm the above inference, IE measurements were carried out as in these works.34,35| Methods | Analytes | Sample preparation | Derivatization conditions | Total preparation time (min) | LODs (nM) | Ref. | |||
|---|---|---|---|---|---|---|---|---|---|
| Extraction methods | Derivatization reagents | T (°C) | pH | Time (min) | |||||
| In situ UA-DDLLME and UHPLC-MS/MS | 21 NTs as listed in Table 1 | UADLLME | CCR | 25 | 9.5 | 1.0 | 3.0 | 1 × 10⁻⁴ to 3 × 10⁻³ | This work |
| Derivatization and LC-MS | DA, NE, DOPAC, HVA, 3-MT, NME, 5-HT, 5-HIAA, Glu, GABA, Gly, Asp | Vortex | Benzoyl chloride | — | — | — | — | 0.03–500 | 1 |
| DA, NE, DOPAC, HVA, 5-HT, 5-HIAA | Vortex | Benzoyl chloride | 25 | — | 5.0 | 25.0 | 0.1–1.3 | 4 | |
| L-DOPA, DA, E, NE, DOPAC, HVA | UADLLME | LRSC | 37 | 10.5 | 3 | 5 | 2 × 10⁻³ to 4 × 10⁻³ | 6 | |
| NE, E | Vortex | Ethylation | 37 | 7.5 | 25.0 | 30.0 | 0.14–0.15 | 15 | |
| DA, HVA, NE, VMA, 5-HT, GABA, DOPAC, Glu, MHPG | Shake | Dansyl chloride | 35 | 11.0 | 30.0 | 45.0 | — | 16 | |
| DA, E, NE, DOPAC, HVA, 5-HT, 5-HIAA, Glu, GABA | Shake, centrifuge | Benzoyl chloride | 7.4 | 10.0 | >10.0 | 0.13–135.9 | 21 | ||
| Direct LC-MS | DA, 5-HT | Centrifuge | — | — | — | — | — | 0.01 | 36 |
| GABA, Glu, 5-HT, DA, E, NE, 5-HIAA | Vortex centrifuge | — | — | — | — | 10.0 | 2.73–6.80 | 37 | |
 | ||
| Fig. 2 (A) The reaction of 4-ethylphenol with LRSC and CCR, and the effects of pH to the molecular structure of CCR-4-ethylphenol and LRSC-4-ethylphenol, (B) results of the IE measurements of protonated adducts of derivatives (anchored to diphenyl phthalate). | ||
4-Ethylphenol was used as representative analyte in this work and the IE of CCR-4-ethylphenol andLRSC-4-ethylphenol were tested and compared, the comparison of IE results was also carried out with DNS-4-ethylphenol and benzoyl chloride-4-ethylphenol which was used as common commercial derivatization reagents. The IE comparison results were shown in Fig. 2B, the IE of CCR was higher than the common commercial derivatization reagents.
The analyte is efficiently ionized in ESI source, is likely to have low limits of detection. Therefore, the knowledge of how different structural features of molecules influence its IE would be the base for designing novel LC-MS derivatization reagents. The IE of compound B1 relative to compound B2 is defined as ratio of respective response factors according to equation
 IE. The detailed measurements were embedded in ESI† for interested readers.
3.2. UHPLC-MS/MS
UHPLC conditions were optimized not only with respect to optimal chromatographic separation, but also to achieve maximum sensitivity of the mass spectrometry detection. The chromatographic optimization studies were primarily focused to find a stationary phase able to retain the analytes employing suitable mobile phases. Among several different columns tested (Agilent SB C18, Agilent Eclipse Plus C18, Acquity BEH C18, Acquity BEH Shield RP18), best performances in terms of retention and separation were achieved when employing Agilent SB C18 column (theoretical plate numbers approached 12000), a full end-capped C18 column with mobile phase A (water with 0.1% formic acid) and B (acetonitrile with 0.1% formic acid). Flow rate and column temperature were also optimized, respectively. The flow rate was set at 0.2 mL min−1 and the column temperature was set at 30 °C.
Under optimum conditions, representative MRM chromatograms of CCR-derivatives of standard mixture and internal standards were shown in Fig. 3.
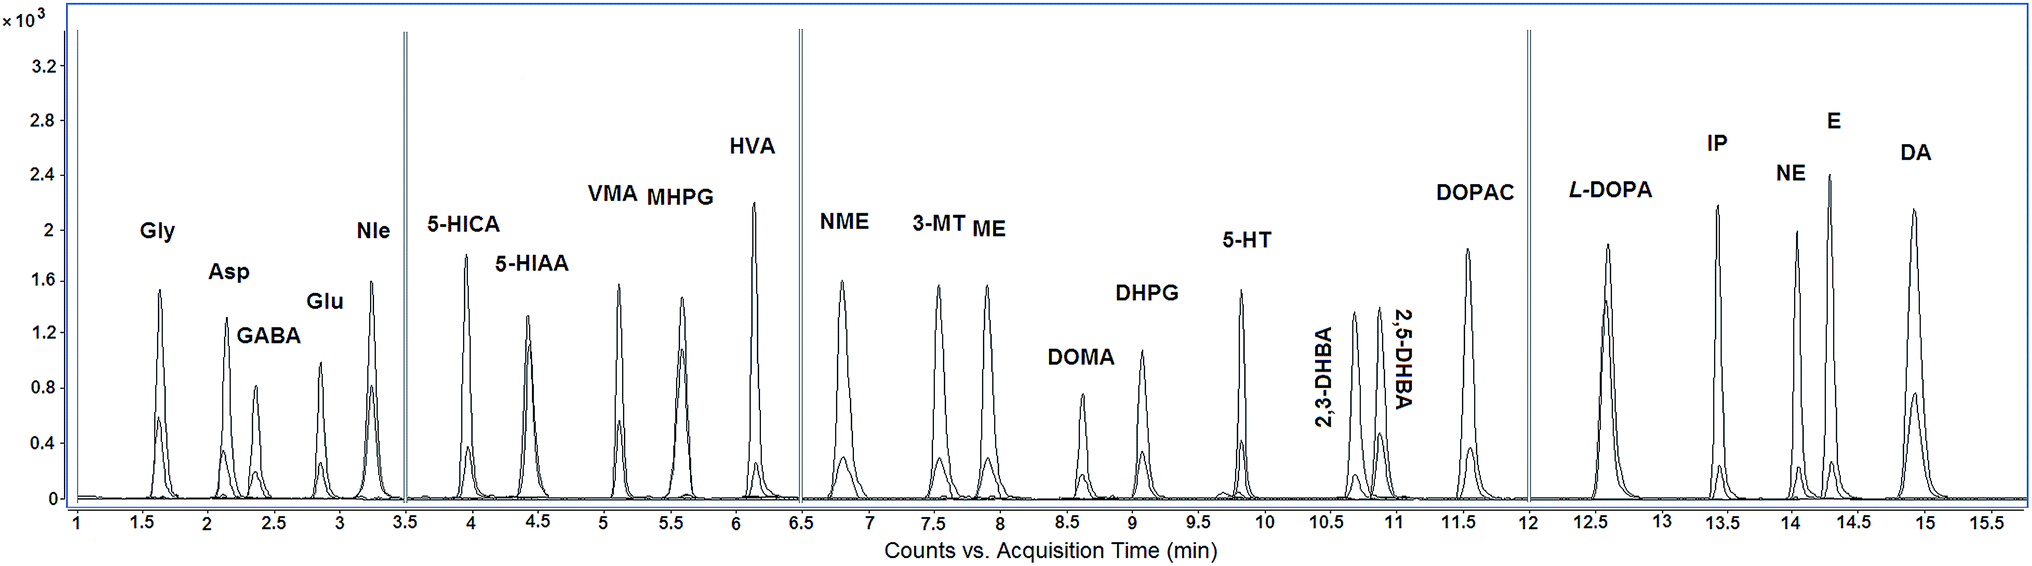 | ||
| Fig. 3 Representative MRM chromatograms of CCR-derivatives of neurotransmitter standards mixture and internal standards. | ||
MS conditions were also studied. Because of the CCR molecule carries a positive charge resulting in increased sensitivity by increasing the ionization efficiency in the electrospray ionization. All of the CCR-derivatives showed intense [M]+ ions in ESI source, which were set as precursor ions. Proposed collision-induced dissociation pathways for precursor ions of NTs derivatives, i.e. m/z 398.1 and m/z 441.2, were shown in Table 1, respectively. In acidic aqueous acetonitrile by ESI-MS/MS, these two specific product ions contained a permanent positive charge, which resulted in enhanced sensitivity by increasing the ionization efficiency. The precursor ions were selected for quantification, and the collision energy (CE) and the fragmentor voltage (FV) were optimized in order to increase the sensitivity of product ions of analytes (Table 1).
3.3. Optimization conditions for in situ UA-DDLLME
3.4. Method validation
A dose–response calibration curve for each CCR-derivative was established. The linearity of the method was determined from the calibration curves constructed for each analyte in brain microdialysates and blood microdialysates. The increased area ratio of each analyte to its internal standard was plotted against the added concentration using no weighting factors in the regression. All CCR-derivatives gave excellent linear responses in the linear range with correlation coefficients above 0.992. LODs of CCR-derivatives were determined according to the criterion described above. The results indicated that the LODs for brain microdialysates were in the range of 0.2–0.5 pM (MANTs) and 1–3 nM (AANTs and DHBA) respectively, indicating that the developed method was highly sensitive for simultaneous quantification of a whole panel of analytes. The LODs achievable with this method were significantly lower than those of reported methods as listed in Table S1.† LODs of this method for brain microdialysates were lower about 2–5 orders of magnitude than other conventional derivatization with LC-MS/MS methods1,4,15,16,21 and lower about 2–4 orders of magnitude than those of the direct LC-MS/MS methods for NTs.36,37 In this study, a novel derivatization reagent CCR with a permanent intramolecular positive charge brought good MS sensitivity enhancement.The precisions were also important for the proposed method. Precision was in the range of 3.1–12.8%, and accuracy was in the range of 87.5–110.4% from the actual QC concentration (Table S1†). The intra-day and inter-day accuracy and precision were all within 15% by FDA. The matrix effect of the analytes ranged from 85.8–112.3% at three concentration levels (Table S1†). RSDs (%) of peak areas for stability evaluation of CCR-derivatives were in the range of 3.8–8.4% at room temperature (under the natural light) or 4 °C for 120 h as shown in Table S1.† The mean extraction recoveries of the 21 analytes were more than 85.8% at different concentration levels. This proved that the proposed procedure were satisfactory. The stability of CCR-derivatives was satisfactory for UHPLC-MS/MS analysis, which was satisfactory for a simple and sensitive procedure to determine NTs, DHBA and baicalein at trace level. Additionally, in situ UA-DDLLME can be completed in only 3.0 min in this method. Compared with conventional shake, vortex or centrifuge combined with or without derivatization methods,1,4,15,16,21,36,37 the total sample pretreatment time of this work was shortened by 7–42 min.
Due to the structures of DHBA and baicalein were similar with NTs, the parameters of DHBA and baicalein were similar with NTs. The analytical performance results showed that the above parameters of DHBA and baicalein were consistent with NTs.
3.5. Method application
In order to prove the performance of this method with real authentic samples, rat brain and blood microdialysates from normal and PD models and drug treated PD rat groups were measured by this method. The dynamic concentrations changes of NTs in rat striatum microdialysates of two rat groups as mentioned in Section 2.5 were shown in Table S2 in ESI.† Concentrations change tendency of three representative NTs and DHBA in rat brain microdialysates of the PD rats with drug administration were shown in Fig. 4. This indicated that baicalein had obvious anti-Parkinsonian effect. Typical MRM chromatograms of the CCR-derivatives of NTs, DHBA and ISs in PD rat brain microdialysates were shown in Fig. 5. The MRM chromatogram, MS/MS product ion spectrum and proposed fragmentation schematics of CCR-baicalein derivative were shown in Fig. S3.† Pharmacokinetic parameters of baicalein in rat blood after oral administration of the dose of baicalein (200 mg kg−1) to PD rats (n = 8) were shown in Fig. 6. Table 3 presented the pharmacokinetic parameters including the maximum plasma concentration (Cmax), the time taken to reach the maximum concentration (Tmax), terminal half-life (T1/2), the area under the concentration–time curve (AUC), mean residence time (MRT), the apparent volume of distribution (Vz/F) and time-averaged total body clearance (CL/F). The neuroprotective effect of baicalein on dopaminergic neurons may partly be due to its antioxidant, scavenge free-radical properties.33 For example, it can effectively scavenge hydroxyl as shown in the DHBA concentration changes of Fig. 4. Confined to the aim and scope of this article, NTs concentrations of three rat groups and related discussions were embedded in ESI† for interested readers. | ||
| Fig. 4 Temporal changes of the DA, HVA, DOPAC and DHBA in rat brain microdialysates of PD rats (group II, n = 8) with stage A, B and C (stage A: PD rats, stage B: PD rats with baicalein administration, stage C: PD rats with madopar administration). | ||
 | ||
| Fig. 5 Typical MRM chromatograms of the CCR derivatives of NTs, DHBA and ISs in PD rat brain microdialysates. | ||
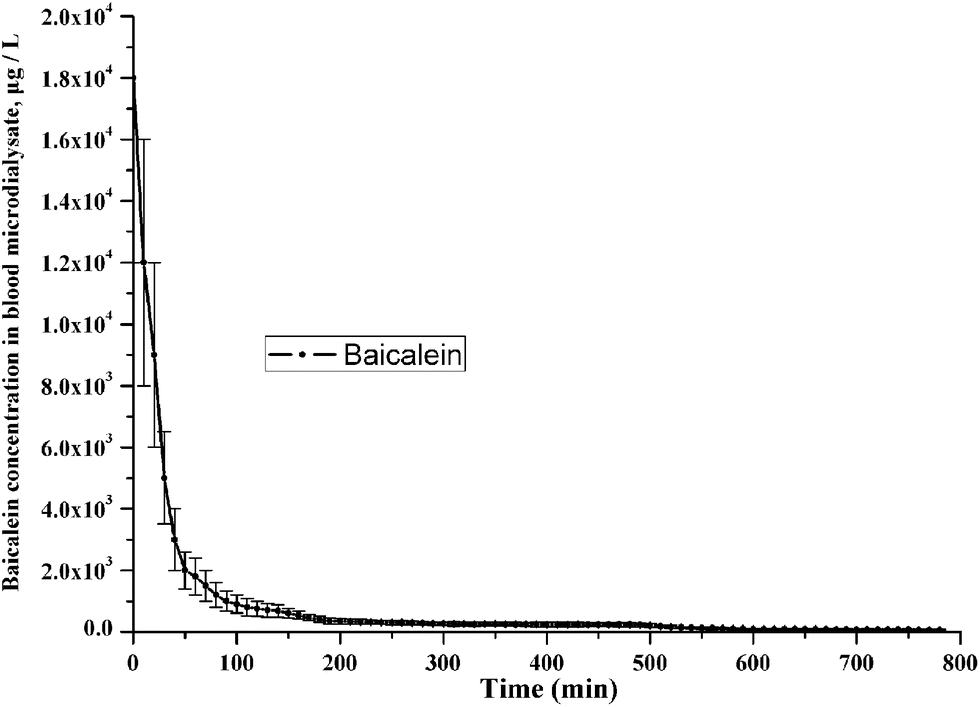 | ||
| Fig. 6 Pharmacokinetic parameters of baicalein in rat blood after oral administration of the dose of baicalein (200 mg kg−1) to PD rats (n = 8). | ||
| Parameter | Unit | Baicalein |
|---|---|---|
| t1/2 | min | 226.93 ± 71.50 |
| Tmax | min | 10.0 ± 0.12 |
| Cmax | μg L−1 | 12605.63 ± 442.57 |
| AUC0–t | μg L−1 min−1 | 601407 ± 17158.33 |
| AUC0–∞ | μg L−1 min−1 | 621697 ± 22344 |
| MRT | min | 160.89 ± 16.00 |
| Vz/F | (mg kg−1) (μg L−1)−1 | 0.104 ± 0.03 |
| CL/F | (mg kg−1) (μg L−1)−1 min−1 | 3.22 × 10⁻⁴ ± 1.17 × 10⁻⁵ |
4. Conclusion
In present work, in situ UA-DDLLME followed by UHPLC-MS/MS (MRM) analysis have been developed and completely validated, and successfully applied to the simultaneously determination of NTs and DHBA in rat brain microdialysates and baicalein in blood microdialysates of PD model rats. Higher sensitivity and selectivity with good precision, accuracy and matrix effect results of the method made it widely applicable for the routine analysis of multiple NTs in various biological samples. The use of a synthesized reagent CCR with a natural positive charge enabled NTs derivatives to be more sensitive and specific for UHPLC-MS/MS detection. This method can be clinically applied as a biochemical index for certain diseases and the monitoring of drug therapy.Acknowledgements
The authors acknowledge the financial support from the National Natural Science Foundation of China (81303179, 21405094, 31200400, 81403051 and 21475075), the Experimental Research Project of Qufu Normal University (sj201402), the Development Project of Qinghai Key Laboratory of Qinghai-Tibet Plateau Biological Resources (No. 2014-Z-Y3), the Open Projects Program of the Key Laboratory of Tibetan Medicine Research, Chinese Academy of Sciences, and the Foundation of Qufu Normal University (BSQD2012019 and 2012023).Notes and references
- P. Song, O. S. Mabrouk, N. D. Hershey and R. T. Kennedy, Anal. Chem., 2012, 84, 412–419 CrossRef CAS PubMed.
- J. Bicker, A. Fortuna, G. Alves and A. Falcao, Anal. Chim. Acta, 2013, 768, 12–34 CrossRef CAS PubMed.
- G. E. De Benedetto, D. Fico, A. Pennetta, C. Malitesta, G. Nicolardi, D. D. Lofrumento, F. De Nuccio and V. La Pesa, J. Pharm. Biomed. Anal., 2014, 98, 266–270 CrossRef PubMed.
- X. Zheng, A. Kang, C. Dai, Y. Liang, T. Xie, L. Xie, Y. Peng, G. J. Wang and H. P. Hao, Anal. Chem., 2012, 84, 10044–10051 CrossRef CAS PubMed.
- S. Greco, W. Danysz, A. Zivkovic, R. Gross and H. Stark, Anal. Chim. Acta, 2013, 771, 65–72 CrossRef CAS PubMed.
- Y. R. He, X. E. Zhao, S. Y. Zhu, N. Wei, J. Sun, Y. B. Zhou, S. Liu, Z. Q. Liu, G. Chen, Y. R. Suo and J. M. You, J. Chromatogr. A, 2016, 1458, 70–81 CrossRef CAS PubMed.
- L. S. Zhao, S. N. Zheng, G. Y. Su, X. M. Lu, J. Y. Yang, Z. L. Xiong and C. F. Wu, J. Chromatogr. B: Anal. Technol. Biomed. Life Sci., 2015, 988, 59–65 CrossRef CAS PubMed.
- M. Perry, Q. Lia and R. T. Kennedy, Anal. Chim. Acta, 2009, 653, 1–22 CrossRef CAS PubMed.
- P. Nandi and S. M. Lunte, Anal. Chim. Acta, 2009, 651, 1–14 CrossRef CAS PubMed.
- M. Kim, J. G. Lee, C. H. Yang and S. Lee, Anal. Chim. Acta, 2016, 923, 55–65 CrossRef CAS PubMed.
- T. H. Tsai, J. Chromatogr. B: Anal. Technol. Biomed. Life Sci., 2003, 797, 161–173 CrossRef CAS.
- B. Ferry, E. P. Gifu, I. Sandu, L. Denoroy and S. Parrot, J. Chromatogr. B: Anal. Technol. Biomed. Life Sci., 2014, 951–952, 52–57 CrossRef CAS PubMed.
- H. Gu, E. L. Varner, S. R. Groskreutz, A. C. Michael and S. G. Weber, Anal. Chem., 2015, 87, 6088–6094 CrossRef CAS PubMed.
- L. L. Liu, Q. Li, N. J. Li, J. H. Ling, R. Liu, Y. X. Wang, L. X. Sun, X. H. Chen and K. S. Bi, J. Sep. Sci., 2011, 34, 1198–1204 CrossRef CAS PubMed.
- C. Ji, J. Walton, Y. Su and M. Tella, Anal. Chim. Acta, 2010, 670, 84–91 CrossRef CAS PubMed.
- L. H. Zhang, H. L. Cai, P. Jiang, H. D. Li, L. J. Cao, R. L. Dang, W. Y. Zhu and Y. Deng, Anal. Methods, 2015, 7, 3929–3938 RSC.
- X. E. Zhao, C. H. Lei, Y. H. Wang, F. Qu, S. Y. Zhu, H. Wang and J. M. You, RSC Adv., 2016, 6, 72670–72675 RSC.
- B.L. Qi, P. Liu, Q. Y. Wang, W. J. Cai, B. F. Yuan and Y. Q. Feng, Trends Anal. Chem., 2014, 59, 121–132 CrossRef CAS.
- H. J. Mok, J. W. Lee, R. Bandu, H. S. Kang, K. H. Kim and K. P. Kim, RSC Adv., 2016, 6, 32130–32139 RSC.
- N. Wei, X. E. Zhao, S. Y. Zhu, Y. R. He, L. F. Zheng, G. Chen, J. M. You, S. Liu and Z. Q. Liu, Talanta, 2016, 161, 253–264 CrossRef CAS PubMed.
- A. Kovac, Z. Somikova, N. Zilka and M. Novak, Talanta, 2014, 119, 284–290 CrossRef CAS PubMed.
- X. E. Zhao, S. Y. Zhu, H. M. Yang, J. M. You, F. R. Song, Z. Q. Liu and S. Y. Liu, J. Chromatogr. B: Anal. Technol. Biomed. Life Sci., 2015, 995–996, 15–23 CrossRef CAS PubMed.
- J. A. Ocana-Gonzalez, R. Fernandez-Torres, M. A. Bello-Lopez and M. Ramos-Payan, Anal. Chim. Acta, 2016, 905, 8–23 CrossRef CAS PubMed.
- M. Saraji and M. K. Boroujeni, Anal. Bioanal. Chem., 2014, 406, 2027–2066 CrossRef CAS PubMed.
- M. I. Leong, M. R. Fuh and S. D. Huang, J. Chromatogr. A, 2014, 1335, 2–14 CrossRef CAS PubMed.
- S. Sadeghi and A. Z. Moghaddam, RSC Adv., 2015, 5, 60621–60660 RSC.
- A. Golbabanezhadazizi, E. Ranjbari, M. R. Hadjmohammadi and H. Daneshinejad, RSC Adv., 2016, 6, 50710–50720 RSC.
- W. Ahmad, A. Al-Sibaai, A. S. Bashammakh, H. Alwael and M. S. El-Shahawi, RSC Adv., 2016, 6, 69492–69500 RSC.
- T. Chatzimitakos, C. Binellas, K. Maidatsi and C. Stalikas, Anal. Chim. Acta, 2016, 910, 53–59 CrossRef CAS PubMed.
- M. M. Delgado-Povedano and M. D. L. de Castro, J. Chromatogr. A, 2013, 1296, 226–234 CrossRef CAS PubMed.
- X. E. Zhao, T. Lv, S. Y. Zhu, F. Qu, G. Chen, Y. R. He, N. Wei, G. L. Li, L. Xia, Z. W. Sun, S. J. Zhang, J. M. You, S. Liu, Z. Q. Liu, Y. Bai and S. Y. Liu, J. Chromatogr. A, 2016, 1437, 49–57 CrossRef CAS PubMed.
- X. Yu, G. R. He, L. Sun, X. Lan, L. L. Shi, Z. H. Xuan and G. H. Du, Life Sci., 2012, 91, 5–13 CrossRef CAS PubMed.
- L. Gao, C. Li, R. Y. Yang, W. W. Lian, J. S. Fang, X. C. Pang, X. M. Qin, A. L. Liu and G. H. Du, Pharmacol., Biochem. Behav., 2015, 133, 155–163 CrossRef CAS PubMed.
- M. Oss, A. Kruve, K. Herodes and I. Leito, Anal. Chem., 2010, 82, 2865–2872 CrossRef CAS PubMed.
- R. Rebane, T. Rodima, A. Kutt and K. Herodes, J. Chromatogr. A, 2015, 1390, 62–70 CrossRef CAS PubMed.
- F. F. Huo, X. Wang, Y. H. Han, Y. Bai, W. Zhang, H. C. Yuan and H. W. Liu, Talanta, 2012, 99, 420–425 CrossRef CAS PubMed.
- F. Huang, J. Li, H. L. Shi, T. T. Wang, W. Muhtar, M. Du, B. B. Zhang, H. Wu, L. Yang, Z. B. Hu and X. J. Wu, J. Neurosci. Methods, 2014, 229, 8–14 CrossRef CAS PubMed.
Footnote |
| † Electronic supplementary information (ESI) available. See DOI: 10.1039/c6ra23808d |
| This journal is © The Royal Society of Chemistry 2016 |