Ag-Functionalized macro-/mesoporous AZO synthesized by solution combustion for VOCs gas sensing application
Xinxin Xinga,
Yuxiu Lia,
Dongyang Denga,
Nan Chenb,
Xu Liua,
Xuechun Xiaoac and
Yude Wang*bc
aSchool of Materials Science and Engineering, Yunnan University, 650091, Kunming, People's Republic of China
bDepartment of Physics, Yunnan University, 650091, Kunming, People's Republic of China. E-mail: ydwang@ynu.edu.cn; Fax: +86-871-65153832; Tel: +86-871-65035570
cYunnan Province Key Lab of Micro-Nano Materials and Technology, Yunnan University, 650091, Kunming, People's Republic of China
First published on 10th October 2016
Abstract
The aim of this paper is to develop easily manufactured and highly sensitive gas sensors for VOCs (volatile organic compounds) detection. Macro-/mesoporous 5 at% Al-doped ZnO (AZO) and Ag-AZO composite powders were prepared by a one-step solution combustion method and used to fabricate gas sensors. Both powders showed the same macro-/mesoporous morphology but have different grain sizes and separated silver phase due to the fast growth of ZnO and the reduction of Ag+. The capability of Ag-AZO was investigated for VOCs detection, including n-butanol, methanol, acetone, ethanol, isopropanol and formaldehyde. It is found that the added Ag greatly increases the gas response towards different VOCs. Particularly 2.5 at% Ag-AZO shows the most superior gas sensing performance to 100 ppm VOCs at an operating temperature of 240 °C, which is also the optimum operating temperature of other sensors. The results may be attributed to the synergistic effects of these doped and composite elements, the amount of adsorbed oxygen and the macro-/mesoporous morphology.
1. Introduction
With the development of industry, people's daily life is full of more and more industrial products, which can release volatile organic compounds (VOCs) in indoor air.1 Most of the VOCs, which are exposed to people for some time, pose a threat to human health when the concentration reaches a certain degree.2 For example, formaldehyde has been listed as a human carcinogen by the International Agency for Research on Cancer (IARC) in 2004;3 n-butanol can cause headache, dermatitis and irritation of the mucous membranes and respiratory tract;4 acetone as a hazardous air pollutant is associated with nervous and respiratory system diseases when long-term inhalation or contact occurs.5 Thus, in order to protect environmental safety and human health, it is very urgent to develop sensors with high sensitivity and rapid gas response for VOCs detection.Zinc oxide (ZnO) has attracted much attention when applied as a gas sensing material, on account of its environmental friendliness, low cost, good compatibility, multiple morphology and so on.6–9 However, traditional semiconductor ZnO has the shortcomings of fast recombination of electron–hole pairs,10 few gas transmission paths11 and poor selectivity and gas response12 when it is utilized as a gas sensing material. Several efforts have been made in order to overcome these limitations, such as doping metal elements,13 noble metal-functionalized semiconductors,14 introducing heterostructures15 and heat treatment16 to form more active sites and structures with large surface area, and facilitate gas transmission and reaction on the surface of the materials. It has been proven that metal-doped ZnO exhibits good selectivity and high gas response to objective gas, high electrical conductivity and different lattice constants,17–19 which are good factors to improve gas sensing performance. AZO (Al-doped ZnO) as metal-oxide nanocomposites showed great sensing properties for the detection of objective gases.13,20–22 Moreover, AZO shows the highest conductivity when compared with Li-, Ca-, In-, N- and P-doped ZnO,19 making it practical for future application and a promising candidate in gas detection.
On this basis, some properties of Ag and Al co-doped ZnO have been discussed,23–25 and Ag has been proven to have a function to improve gas sensor properties due to its catalytic activity.14 In this paper, the amount of Al was reduced to improve conductivity, and Ag was added to form Ag-AZO macro-/mesoporous composite powders. We synthesized Ag-AZO powders using a self-sustained solution combustion method to obtain large specific surface area and hierarchically porous morphology, which were propitious for the flow of gases and the contact between active sites and the surface of the material. The gas sensing performances of these powders were investigated by detecting gas response of fabricated sensors towards VOCs (including n-butanol, methanol, acetone, ethanol, isopropanol and formaldehyde). It is found that 2.5 at% Ag-AZO shows better sensing properties to all VOCs at 240 °C compared with AZO and other samples with different atomic ratios of Ag (1 at%, 1.5 at%, 2 at% and 3 at% Ag-AZO). In the end, a possible mechanism of the influence of doped Al and added Ag, in the formation of a porous structure and high sensing performance was also proposed.
2. Experimental
2.1 Preparation of macro-/mesoporous Ag-AZO
All of the chemical reagents including zinc acetate dihydrate (Zn(CH3COO)2·2H2O), zinc nitrate hexahydrate (Zn(NO3)2·6H2O), aluminum nitrate nonahydrate (Al(NO3)3·9H2O), silver nitrate (AgNO3), glycine (H2NCH2COOH) and hydrazine hydrate 80% (N2H4·H2O) were of analytical grade and used without further purification. Samples were synthesized through a one-step solution combustion method. At the beginning, we produced pure ZnO and 2.5 at%, 5 at%, 7.5 at% Al-ZnO, and the specific steps were as follows. Firstly, precursor solution containing 0.01 mol Zn2+ was prepared by dissolving 1.25 g Zn(CH3COO)2·2H2O, 1.25 g Zn(NO3)2·6H2O and an appropriate amount of Al(NO3)3·9H2O (atomic molar ratio: [Al3+]/[Zn2+] = 0%, 2.5%, 5%, 7.5%) into 15 mL distilled water in a crucible with magnetic stirring. Then, 0.5 g C2H5NO2 and 5.64 g N2H4·H2O were successively added to form a precipitate of the metal–organic complex. After stirring for 10 min at room temperature, the crucible was transferred into a preheated chamber electric furnace keeping the temperature at 400 °C. The combustion reaction was triggered a few minutes later and we obtained a series of light-gray fluffy powders within 50 min.Ag-AZO was synthesized on the basis of 5 at% Al-ZnO (AZO). AgNO3 was added to the precursor solution ([Al3+]/[Zn2+] = 5%) and the amount of AgNO3 was calculated according to atomic molar ratios [Ag+]/[Zn2+] = 0%, 1%, 1.5%, 2%, 2.5% and 3%. The following steps were consistent with the abovementioned steps. Finally, the corresponding samples were labeled and named as x at% Ag-AZO (x = 1, 1.5, 2, 2.5 and 3).
2.2 Characterization of macro-/mesoporous Ag-AZO
Crystal structure and phases of prepared powders were characterized by Rigaku D/max-3B diffractometer with an X-ray wavelength of 0.15406 nm (Cu-Kα radiation). The powders were scanned from 10° to 90° in steps of 0.02° per second. Scherrer's equation: D = 0.9λ/(B![[thin space (1/6-em)]](https://www.rsc.org/images/entities/char_2009.gif) cos
cos![[thin space (1/6-em)]](https://www.rsc.org/images/entities/char_2009.gif) θ) was used to calculated the crystallite domain sizes (D), in which λ is the wavelength of X-rays (λ = 0.15418 nm), B is the true half-peak width of the X-ray diffraction peak, and θ is Bragg's diffraction angle. Surface microstructures of materials were identified by scanning electron microscopy (SEM) with the FEI QUANTA200 microscope operating at 20 kV. Transmission electron microscopy (TEM) (JEM-2100) analysis was performed operating at an accelerating voltage of 200 kV to obtain detailed microstructure. In TEM analysis, samples were dispersed in absolute ethyl alcohol under sonication, then dropped on copper grids coated by amorphous carbon film. X-ray photoelectron spectroscopy (XPS) was conducted on the ESCALAB spectrometer with an Al-Kα X-ray beam as the excitation source and the vacuum pressure of the instrument chamber was set up at 1 × 10⁻⁷ Pa. The specific surface areas and the pore size distributions were characterized by Brunauer–Emmett–Teller (BET) nitrogen adsorption isotherm using a Micromeritics ASAP 2010 automated sorption analyzer operating at 77.35 K. Before BET measurement, the sample was degassed at 473 K for 6 h in a vacuum.
θ) was used to calculated the crystallite domain sizes (D), in which λ is the wavelength of X-rays (λ = 0.15418 nm), B is the true half-peak width of the X-ray diffraction peak, and θ is Bragg's diffraction angle. Surface microstructures of materials were identified by scanning electron microscopy (SEM) with the FEI QUANTA200 microscope operating at 20 kV. Transmission electron microscopy (TEM) (JEM-2100) analysis was performed operating at an accelerating voltage of 200 kV to obtain detailed microstructure. In TEM analysis, samples were dispersed in absolute ethyl alcohol under sonication, then dropped on copper grids coated by amorphous carbon film. X-ray photoelectron spectroscopy (XPS) was conducted on the ESCALAB spectrometer with an Al-Kα X-ray beam as the excitation source and the vacuum pressure of the instrument chamber was set up at 1 × 10⁻⁷ Pa. The specific surface areas and the pore size distributions were characterized by Brunauer–Emmett–Teller (BET) nitrogen adsorption isotherm using a Micromeritics ASAP 2010 automated sorption analyzer operating at 77.35 K. Before BET measurement, the sample was degassed at 473 K for 6 h in a vacuum.
2.3 Gas sensing performance of Ag-AZO
The gas sensors fabricated in this paper using the indirect heating method were based on the literature.16,26,27 All the synthesized abovementioned powders were used to prepare gas sensors. First, we mixed powders with distilled water, then daubed them onto the surface of an Al2O3 tube connecting with two Au electrodes and a pair of platinum wires at both ends. Operating temperature was provided by a voluminous Ni–Cr alloy (about 20 Ω) crossing through the Al2O3 tube. After soldering the tube to bakelite base with platinum wires, the fabricated-sensors were plugged onto the artificial aging equipment at the heater voltage of 4.4 V for 5 days in order to increase stability and repeatability. Gas sensing performances of these prepared sensors were tested by a WS-30 A system (Weisheng Instruments Co., Zhengzhou, China). Considering a typical n-type gas sensor, gas response β was defined as the ratio of the sensor resistance in air (Ra) to that in the objective gas (Rg).Ra (resistance in air) values of pure ZnO and 2.5 at%, 5 at%, 7.5 at% Al-ZnO-based gas sensors were tested at first, and the results are list in Table 1. As we all know, the smaller the Ra is, the more favorable it is for the application of gas sensors. Therefore, in the following tests, we added Ag on the basis of 5 at% Al-ZnO because of its lowest resistance in air. Ra values of 1%, 1.5%, 2%, 2.5% and 3% Ag-AZO-based gas sensors changed a little compared with that of the AZO-based gas sensor. n-Butanol, methanol, acetone, ethanol, isopropanol and formaldehyde were chosen as six types of VOCs to evaluate gas sensing properties of the Ag-AZO-based gas sensors.
| Materials based gas sensor | Operating temperature (°C) | Ra (kΩ) (resistance in air) |
|---|---|---|
| ZnO | 240 | 1123 |
| 2.5% Al-ZnO | 240 | 1157 |
| 5% Al-ZnO (AZO) | 240 | 12 |
| 7.5% Al-ZnO | 240 | 30 |
| 1% Ag-AZO | 240 | 14 |
| 1.5% Ag-AZO | 240 | 22 |
| 2% Ag-AZO | 240 | 33 |
| 2.5% Ag-AZO | 240 | 19 |
| 3% Ag-AZO | 240 | 36 |
3. Results and discussion
3.1 The structural and morphological study
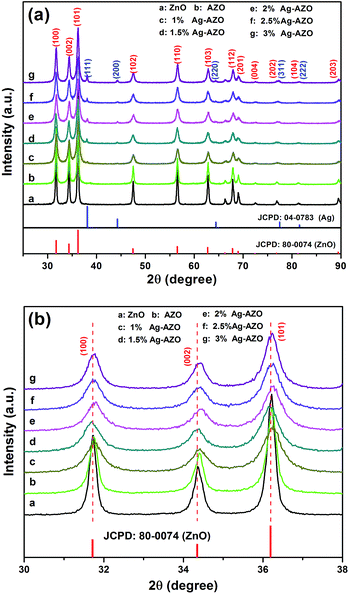
The XRD analyses of AZO and x at% Ag-AZO macro-/mesoporous powders were utilized to determine the crystal structure, ingredients and mean grain size. Fig. 1(a) indexes a mixed phase of cubic Ag [PDF#04-0783] and wurtzite ZnO [PDF#80-0074] without any other trace of metal compounds containing elemental Al, indicating that Al exists in the form of an amorphous state28 and Ag exists as metallic silver. The X-ray diffractions show tapering peaks indicating that these powders are well crystallized. The mean grain size was calculated using the Scherrer formula and the results, based on the (110) plane (from wurtzite ZnO) and the (111) plane (from cubic Ag), are listed in Table 2. These data indicate that the size of crystalline grains of ZnO decreased when 5 at% Al was doped, which is probably due to the doping Al replacing the positions of Zn2+ and existing as Al ions in the bulk, on the basis of the ionic size difference between Zn2+ (0.074 nm) and Al3+ (0.053 nm).29,30 The same conclusion can be obtained as follows. The crystalline size of AZO further decreases with increasing elemental Ag, and the average grain size of Ag does not change much in these samples. From Fig. 1(b), one can directly observe that diffraction peaks belonging to (100), (002) and (101) planes shift slightly to bigger angle compared with pure ZnO, which results from the decrease of mean grain size of AZO and x at% Ag-AZO.| Samples | ZnO/AZO | Average grain size of ZnO/AZO (nm) | Average grain size of Ag (nm) | |
|---|---|---|---|---|
| a (Å) | c (Å) | |||
| ZnO | 3.2549 | 5.2141 | 73.8 | — |
| 5% Al-ZnO (AZO) | 3.2524 | 5.2109 | 50.0 | — |
| 1% Ag-AZO | 3.2527 | 5.2077 | 18.4 | 45.0 |
| 1.5% Ag-AZO | 3.2582 | 5.2140 | 17.6 | 46.5 |
| 2% Ag-AZO | 3.2520 | 5.2086 | 21.4 | 33.4 |
| 2.5% Ag-AZO | 3.2544 | 5.2095 | 19.8 | 52.5 |
| 3% Ag-AZO | 3.2537 | 5.2119 | 24.9 | 38.1 |
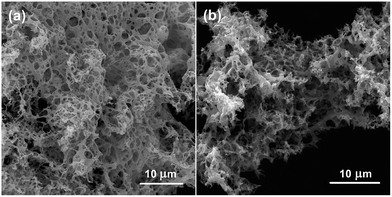
The surface morphology and structure of the as-prepared samples were investigated by SEM. A coral-like structure can be observed in Fig. 2 and it does not change when Ag is added. The coral-like structure consists of interconnected channels with the diameter size ranging from several nanometers to ten micrometers forming a hierarchical macro-/mesoporous architecture. This type of structure provides an easy way for the flow of air and contact between objective gas and active sites, which is used to improve gas sensing performance.
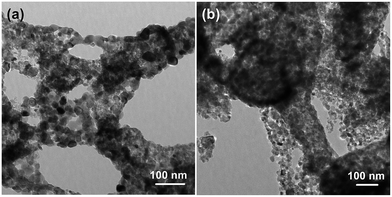
TEM was employed to analyze morphology characteristics and grain size of AZO and 2.5 at% Ag-AZO. The macro-/mesoporous structure can be evidently observed in Fig. 3, which confirms the SEM results. These mesopores consist of self-assembled nanoparticles with diameters ranging from 4 to 38 nm, which are irregular crystal nanoparticles. The energy for self-assembly of nanoparticles is derived from the heat produced by combustion. The diameter of crystalline grains of 2.5 at% Ag-AZO, shown in Fig. 3(b), is smaller than that of AZO, as shown in Fig. 3(a). Therefore, the TEM results are in good agreement with the XRD conclusions and the data listed in Table 1. The crystalline grains were found to grow irregularly, producing more defects on the surface of the nanoparticles, which can provide more adsorbed oxygen to promote gas sensing performance.31
Nitrogen adsorption–desorption isotherms were investigated to analyze the hierarchically porous structure of the as-prepared AZO and 2.5 at% Ag-AZO powders. The insets in Fig. 4(a) and (b) calculated by the BJH method indicates that the pore diameter of AZO ranges from 1.3 to 109.2 nm with a maximum at 3.8 nm, and that of 2.5 at% Ag-AZO ranges from 1.3 to 102.7 nm with a maximum at 13.2 nm, illustrating that the pore sizes are distributed over a wide range. Hysteresis loops located between the adsorption and desorption branches at P/P0 ranging from 0.45–0.95 exhibit the existence of mesopores (about 2–50 nm in diameter) formed by self-assembled nanoparticles.8,16 This indicates that the inner architectures of these hierarchically porous samples are not solid, but full of pore structure. The loop observed at high relative pressure (above 0.9) illustrates the existence of macropores (>50 nm in diameter), which can be directly observed in the images of SEM and TEM. The BET specific surface area of AZO and x at% Ag-AZO where (x = 1, 1.5, 2, 2.5 and 3) are 45.59, 39.83, 46.17, 41.55, 40.13 and 43.85 m2 g−1, respectively, which provides enough surface area to promote the contact between gas and active sites on the surface of the prepared samples.
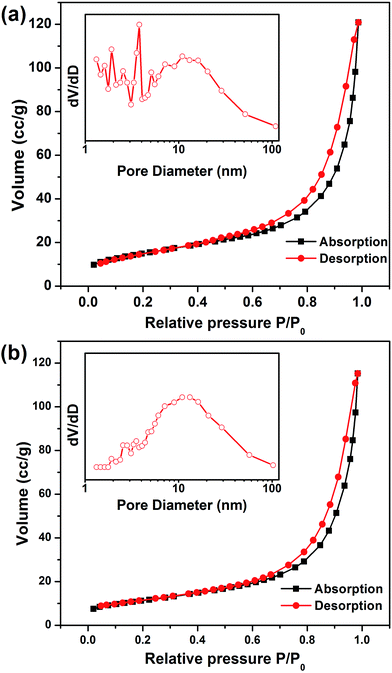 | ||
| Fig. 4 N2 absorption–desorption isotherms of (a) AZO and (b) 2.5% Ag-AZO. The insets are the pore-size distribution calculated by the BJH method from the desorption. | ||
X-ray photoelectron spectroscopy (XPS) was used to analyze surface compositions and chemical states of AZO and 2.5 at% Ag-AZO. In Fig. 5(a), Zn 2p spectra of 2.5 at% Ag-AZO reveal two peaks located at 1044 (Zn 2p1/2) and 1021 eV (Zn 2p3/2) with the splitting distance of 23 eV, which illustrates that Zn exists as Zn2+.32 The Ag 3d spectra of 2.5 at% Ag-AZO shows two peaks of Ag 3d3/2 and Ag 3d5/2 with the splitting of the 3d doublet of 6 eV attributed to metallic silver,14,33 which is in concert with the XRD result. In Fig. 5(c) and (d), the Al 2p peak can be fitted to two peaks with reference to Al–OH and Al–O bonds in the samples.34 The data are around 74.53 and 73.57 eV for 2.5 at% Ag-AZO and 74.76 and 73.93 eV for AZO. The Al–OH bond is formed due to the adsorbed H2O reacting with O2 on the surface of the powder. The Al–O bond is formed by Al3+ (exchanging the Zn2+ in the bulk) combining with the lattice oxygen. The added Ag does not change the existing form of Al. No trace of Al–Al bonds located at around 72.7 eV can be found in the XPS result.35 From Fig. 5(e) and (f), the low binding energy component located at 530.6 eV is attributed to O2− ions in the crystal lattice of wurtzite-type ZnO surrounded by Zn (or doped Al) atoms, and the high binding energy component located at 531.8 eV is attributed to surface adsorbed Ox− ions like O−, O2− and O2−.36–38 O2 combines with one electron to form O2−, and then O2− combines with one electron to form O−.39 However, only the surface-adsorbed Ox− can react with gas. So the improvement of the area of the Ox− peak can directly affect the gas sensing performance.
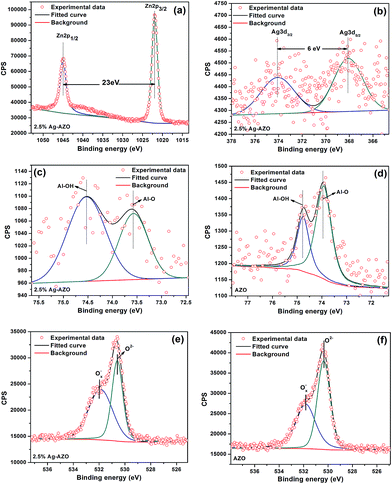 | ||
| Fig. 5 High-resolution spectra of (a) Zn 2p, (b) Ag 3d, (c) Al 2p and (e) O 1s of 2.5% Ag-AZO. High-resolution spectra of (d) Al 2p and (f) O 1s of AZO. | ||
3.2 Gas sensing property of Ag-AZO
The gas sensing performances of pure ZnO, AZO and x at% Ag-AZO were investigated by testing their gas responses to different objective gases of 100 ppm at various operating temperatures. In Fig. 6, we chose six types of VOCs and the temperature was set in the range from 200 °C to 300 °C to detect the gas sensing property of Ag-AZO. One can observe that Ag-AZO-based gas sensors show a relative improvement of gas response towards VOCs when compared with pure ZnO and AZO, and the 2.5 at% Ag-AZO-based gas sensor, in particular, shows highest gas response towards every gas at the operating temperature of 240 °C. The detailed data tested from the 2.5 at% Ag-AZO based gas sensor at the operating temperature of 240 °C towards 100 ppm n-butanol, methanol, acetone, ethanol, isopropanol and formaldehyde are 996.48, 448.42, 336.56, 444.04, 437.37 and 87.66, respectively, which are higher than those tested at the other temperatures. Moreover, we have listed the comparison of gas sensing performance of different materials-based gas sensors towards VOCs in Table 3. It can be seen that our composite exhibits a higher response, all of which can be contributed to the load of Ag on macro-/mesoporous AZO. Therefore the optimum operating temperature was set as 240 °C and the 2.5 at% Ag-AZO-based gas sensor was chosen to conduct the following test.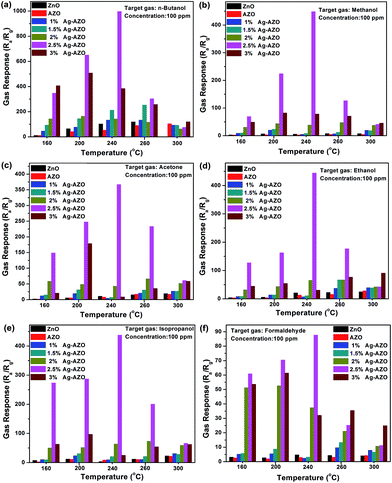 | ||
| Fig. 6 Gas response of pure ZnO, AZO and x at% Ag-AZO-based gas sensors towards 100 ppm (a) n-butanol, (b) methanol, (c) acetone, (d) ethanol, (e) isopropanol and (f) formaldehyde. | ||
| Materials | Concentration (ppm) | Temperature (°C) | Sensitivity | Ref. | |||||
|---|---|---|---|---|---|---|---|---|---|
| n-Butanol | Methanol | Acetone | Ethanol | Isopropanol | Formaldehyde | ||||
| Meso-/macroporous Co3O4 | 1000 | 120 | 27.7 | 13.0 | 16.8 | 22.0 | 19.0 | 7.2 | 16 |
| Co3O4 nanosheets | 300 | 100 | 767 | 94 | 234 | 15 | 353 | 36.4 | 40 |
| Nanoporous TiO2 | 500 | 370 | 7.56 | 9.86 | 25.97 | 11.19 | 5.35 | 3.53 | 41 |
| ZnO hollow spheres | 500 | 385 | 292 | 25.4 | — | 97.3 | 146 | 12.3 | 42 |
| Porous flower-like SnO2 | 260 | 100 | — | 5.1 | 5.7 | 6.4 | — | — | 43 |
| Pt–SnO2 nanocomposite | 100 | 50 | 44.2 | 2.7 | — | 8.3 | — | — | 44 |
| Magnetron-sputtered CuO NPs | 500 | 200 | — | 3.2 | — | 5.6 | — | — | 45 |
| Microporous Co3O4@C | 100 | 170 | — | 11 | 7.8 | 14.7 | — | — | 46 |
| Er–SnO2 nanobelts | 100 | 230 | — | — | 4.8 | 5.3 | — | 9 | 47 |
| Au–WO3 nanofibers | 100 | 250 | 229.7 | 8.1 | 22.3 | 90.8 | — | — | 48 |
| Macro-/mesoporous Ag-AZO | 100 | 240 | 994.8 | 448.42 | 336.56 | 444.04 | 437.37 | 87.66 | This work |
As a typical n-type metal oxide, the gas response (Ra/Rg) of the ZnO-based gas senor shows a rise when reducing gas is injected into the testing equipment. The same type of response and recovery curves are shown in Fig. 7, indicating that the added Ag-AZO maintains the n-type semiconducting characteristic. The 2.5 at% Ag-AZO-based gas sensor was tested towards 100 ppm different VOCs at the optimum operating temperature of 240 °C. One can observe that the response and recovery time of this sensor have been marked out. The response times (time needed to reach 90% of the adsorption platform) towards n-butanol, methanol, acetone, ethanol, isopropanol and formaldehyde were calculated as 66, 18, 69, 36, 26 and 47 s, respectively, and the recovery times (time need to return to 10% above the original response in air) were 25, 8, 13, 12, 9 and 5 s, correspondingly. All of these results illustrate that the 2.5 at% Ag-AZO-based gas sensor reveals relatively quick response and recovery times to VOCs.
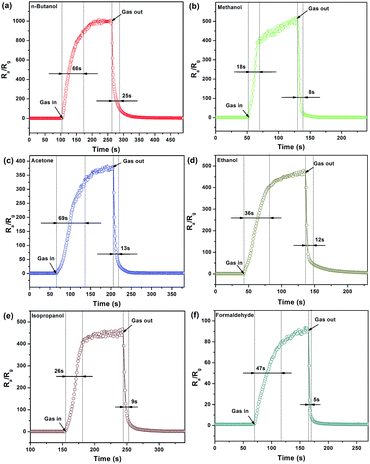 | ||
| Fig. 7 Typical response and recovery times of the 2.5 at% Ag-AZO-based gas sensor to 100 ppm (a) n-butanol, (b) methanol, (c) acetone, (d) ethanol, (e) isopropanol and (f) formaldehyde. | ||
Afterwards, in order to analyze the effect of gas concentrations on gas sensitivities, n-butanol was chosen as the objective gas because the gas sensor has the highest gas response towards n-butanol, which can be more convenient to observe and analyze. As an example, the sensing property of the 2.5 at% Ag-AZO-based gas sensor was tested towards 1–100 ppm n-butanol at the optimum operating temperature of 240 °C. Dynamic response and recovery curves to n-butanol of different concentrations (1–100 ppm) are shown in Fig. 8(a). Even at a low detection limit of 1 ppm, the gas response is about 14.66, which indicates its good sensitivity towards low-concentration VOCs. When concentration reaches 100 ppm, it shows an excellent gas response, as high as 996.48. The injection of n-butanol results in a rise of gas response and every adsorption platform returns to its baseline value after the gas is released. As shown in Fig. 8(b), with the enhancement of gas concentration, gas response shows a corresponding improvement. These phenomena indicate that the adsorption towards n-butanol by Ag-AZO-based gas sensors is reversible.
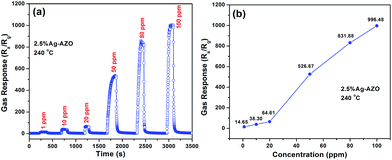 | ||
| Fig. 8 (a) Dynamic sensing properties for 2.5% Ag-AZO to n-butanol from 1 to 100 ppm at 240 °C. (b) Gas responses to different concentrations of n-butanol of 2.5% Ag-AZO at 240 °C. | ||
In practice, long-term stability is one of the key problems to determine the practical application of gas sensors.49 To detect the stability of the 2.5 at% Ag-AZO-based gas sensor, we conducted the test at the optimum operating temperature of 240 °C to three randomly selected VOCs, including n-butanol, methanol and acetone. In Fig. 9, one can observe a downward trend of gas responses towards the three types of VOCs. In the first few days, the gas responses decayed sharply and then tended to be stable with slight swings in the rest of the time. The possible reasons for the oscillation can be explained as follows. For one thing, the core of this kind of gas sensor is welded above bakelite base through four platinum wires, which are utilized for the output of electric current and signal. During the long-term stability test conducted at 240 °C the strength of the metal wires decreased. Once the gas sensor is in use it is inevitable that it will suffer bumps and vibrations. When the welding points are not firm enough, the stability of this sensor will be affected. For another point, Ag is added to improve the selectivity and sensitivity of gas sensors, but the main disadvantage is that Ag atoms easily migrate in the electric field and the environment of high temperature and high humidity.50 Moreover, the grain size is considered as one of the most important parameters to affect the stability of the gas sensor. The grain size might grow during the experiment, which can change the resistance of the sensor and further influence the stability.51 In addition to these reasons, numerous factors closely influence the stability performance of sensors, such as structural transformation, phase transformation, poisoning, degradation of contacts and heaters, bulk diffusion, errors in design, change of humidity, fluctuations of temperature in the surrounding atmosphere and interference effects.52 The prepared gas sensors are barely satisfactory in their long-term stability performance, which is an unfavorable factor needing to be overcome for its application in the long run.
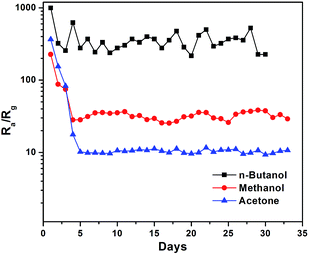 | ||
| Fig. 9 Long-term stability of the 2.5% Ag-AZO-based gas sensor towards 100 ppm n-butanol, methanol and acetone tested once a day for 30 days. | ||
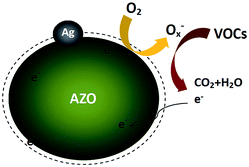
Based on the abovementioned results, the enhancement of gas sensing properties is related to the following issues. For one thing, the special microstructure of the prepared samples synthesized by a self-sustained solution combustion method exhibits abundant pore structure, which is better for gas circulation and provides sufficient surface area. Moreover, the excellent gas response can be attributed to the increased amount of absorbed Ox− ions (for example O−, O2− and O2−) influenced by Al doping. A large number of electrons are released when the positions of Zn2+ are replaced by Al3+ ions,13,53 resulting in the improvement of conductivity. The possible mechanism is as follows:
| Al2O3 + ZnO → ZnZn + 2AlZn+ + 3OOx + (1/2)O2(g) + 2e | (1) |
These descriptive electrons are easily captured by the adsorbed oxygen to form Ox− ions,39 which play an important role to enhance the gas sensing property.4,9–12 The decrease of free electrons may increase resistance of the gas sensor. On the contrary, when gas sensors are exposed to VOCs, Ox− ions can react with these reducing gases with the release of captured electrons, resulting in the decrease of resistance.14,31 The reaction process is as follows:
| VOCs + Ox → CO2 + H2O + e | (2) |
Thus, the testing atmosphere switching between VOCs and air can cause a distinct change in conductivity of the sensors, which can directly enhance gas sensing performance. Fig. 10 graphically displays the mechanism of the entire reaction.
As has been reported in ref. 14, 54 and 55, Ag nanoparticles can prominently enhance the gas sensing property of metal semiconductor materials like ZnO and SnO2. The work function of AZO (5 at% Al-doped ZnO) has been studied.56 The energy band structure of metal Ag and AZO before and after contact are displayed in Fig. 11. In Fig. 11(b), the electrons flow across the interface which evidently increases the electron concentration on the AZO surface, because the electrons transfer from a metal having a lower work function (Wm) to a semiconductor with a higher work function (Ws). Once the Ag-functionalized AZO-based gas sensor is exposed to air, the oxygen will capture electrons from the surface of AZO to form Ox−, as observed in the XPS results, leading to an increase in resistance. Ox− can react with VOCs and break the VOC molecules into H2O and O2, releasing electrons back to the conduction band of ZnO, which is the same as the process in Fig. 10. The released electrons will lead to a decrease in resistance of the gas sensor.14,57,58 Therefore, the resistance of the gas sensor is greatly influenced by Ag and Ox−, which can strongly affect the gas response of the gas sensor by switching the resistance between air and objective gas. Thus, we can obtain gas sensors with high sensitivity.
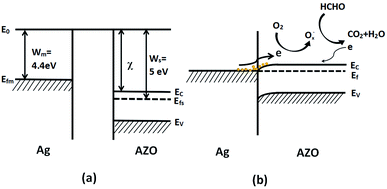 | ||
| Fig. 11 Schematic of the energy band structure of the Ag-functionalized AZO (a) in air and (b) in VOCs. | ||
Ag can efficiently increase the capacity of adsorbed oxygen and accelerate the reaction between Ox− ions and objective VOCs due to its highly catalytic activation. Moreover, the catalyst metal Ag can resolve hydrocarbons into more active smaller molecules to promote the reaction between Ox− ions and reducing gases.
4. Conclusions
Ag-Functionalized macro-/mesoporous AZO powders were successfully synthesized through a one-step solution combustion method. The XRD results show that Al element exists by replacing the position of Zn2+ existing like Al ions in the bulk, and Ag exists like metallic silver, which coincide with the XPS results. The microstructures observed by SEM and TEM all show a macro-/mesoporous hierarchical architecture, which is beneficial to the flowing of gas. Specific surface area tested by BET indicates enough surface area to promote the contact between gas and active sites on the surface of the prepared samples. Furthermore, this structure can obtain more Ox− to directly affect gas sensing performance. During the test, it is found that the Ag-functionalized AZO based gas sensors show superior gas sensing properties to both AZO- and pure ZnO-based gas sensors. In particular, the 2.5 at% Ag-AZO-based gas sensor shows the highest response towards 100 ppm VOCs at the optimum operating temperature of 240 °C. Especially, it reaches as high as 996.48 when testing n-butanol. Many factors closely relate to the excellent gas sensing performance for example the structure of the samples, specific surface area, defects and so on. The mechanism of gas sensing properties needs to be further researched. Moreover, the long-term stability testing is barely satisfactory; it is necessary to overcome this shortcoming in order to broaden its application in reality.Acknowledgements
This work was supported by the National Natural Science Foundation of China (Grant No. 51262029).Notes and references
- C. Jia, S. Batterman and C. Godwin, Atmos. Environ., 2008, 42, 2083 CrossRef CAS.
- M. Leidinger, T. Sauerwald, T. Conrad, W. Reimringer, G. Ventura and A. Schütze, Procedia Eng., 2014, 87, 1449 CrossRef CAS.
- T. Salthammer, Int. J. Hyg. Environ. Health, 2015, 218, 433 CrossRef CAS PubMed.
- H. Wang, Y. Qu, H. Chen, Z. D. Lin and K. Dai, Sens. Actuators, B, 2014, 201, 153 CrossRef CAS.
- F. M. Liu, X. Yang, B. Wang, Y. H. Guan, X. S. Liang, P. Sun and G. Y. Lu, Sens. Actuators, B, 2016, 229, 200 CrossRef CAS.
- J. Zhou, N. S. Xu and Z. L. Wang, Adv. Mater., 2006, 18, 2432 CrossRef CAS.
- Q. Wan, Q. H. Li, Y. J. Chen, T. H. Wang, X. L. He, J. P. Li and C. L. Lin, Appl. Phys. Lett., 2004, 84, 3654 CrossRef CAS.
- J. R. Huang, Y. J. Wu, C. P. Gu, M. H. Zhai, Y. F. Sun and J. H. Liu, Sens. Actuators, B, 2011, 155, 126 CrossRef CAS.
- H. Y. Huang, P. C. Xu, D. Zheng, C. Z. Chen and X. X. Li, J. Mater. Chem. A, 2015, 3, 6330 CAS.
- D. W. Zhang, X. F. Wu, N. Han and Y. F. Chen, J. Nanopart. Res., 2013, 15, 1580 CrossRef.
- W. H. Li, X. F. Wu, N. Han, J. Y. Chen, X. H. Qian, Y. Z. Deng, W. X. Tang and Y. F. Chen, Sens. Actuators, B, 2016, 225, 158 CrossRef CAS.
- N. S. Ramgir, M. Kaur, P. K. Sharma, N. Datta, S. Kailasaganapathi, S. Bhattacharya, A. K. Debnath, D. K. Aswal and S. K. Gupta, Sens. Actuators, B, 2013, 187, 313 CrossRef CAS.
- R. Yoo, S. Cho, M. J. Song and W. Lee, Sens. Actuators, B, 2015, 221, 217 CrossRef CAS.
- C. J. Dong, X. Liu, B. Q. Hang, S. J. Deng, X. C. Xiao and Y. D. Wang, Sens. Actuators, B, 2016, 224, 193 CrossRef CAS.
- C. S. Lee, I. D. Kim and J. H. Lee, Sens. Actuators, B, 2013, 181, 463 CrossRef CAS.
- S. J. Deng, N. Chen, D. Y. Deng, Y. X. Li, X. X. Xing and Y. D. Wang, Ceram. Int., 2015, 41, 11004 CrossRef CAS.
- D. Hu, X. Liu, S. J. Deng, Y. J. Liu, Z. P. Feng, B. Q. Han, Y. Wang and Y. D. Wang, Phys. E, 2014, 61, 14 CrossRef CAS.
- Z. Zhou, K. Kato, T. Komaki, M. Yoshino, H. Yukawa, M. Morinaga and K. Morita, J. Eur. Ceram. Soc., 2004, 24, 139 CrossRef CAS.
- R. Deng, Y. M. Zou, Z. Chen, G. S. Jiang and H. G. Tang, Mater. Lett., 2007, 61, 3582 CrossRef CAS.
- X. Liu, K. M. Pan, W. B. Li, D. Hu, S. Y. Liu and Y. D. Wang, Ceram. Int., 2014, 40, 9931 CrossRef CAS.
- M. Hjiri, L. E. Mir, S. G. Leonardi, A. Pistone, L. Mavilia and G. Neri, Sens. Actuators, B, 2014, 196, 413 CrossRef CAS.
- X. X. Xing, T. Chen, Y. X. Li, D. Y. Deng, X. C. Xiao and Y. D. Wang, Sens. Actuators, B, 2016, 237, 90 CrossRef CAS.
- F. Khan, S. H. Baek and J. H. Kim, J. Alloys Compd., 2014, 584, 190 CrossRef CAS.
- F. Khan, S. H. Baek, J. Y. Lee and J. H. Kim, J. Alloys Compd., 2015, 647, 566 CrossRef CAS.
- F. Khan, S. H. Baek and J. H. Kim, J. Alloys Compd., 2016, 682, 232 CrossRef CAS.
- H. Y. Song, H. Yang and X. C. Ma, J. Alloys Compd., 2013, 578, 272 CrossRef CAS.
- X. Liu, N. Chen, X. X. Xing, Y. X. Li, X. C. Xiao, Y. D. Wang and I. Djerdj, RSC Adv., 2015, 5, 54372 RSC.
- M. Behrens, G. Lolli, N. Muratova, I. Kasatkin, M. Hävercker, R. N. d'Alnoncourt, O. Storcheva, K. Köhler, M. Muhler and R. Schlögl, Phys. Chem. Chem. Phys., 2013, 15, 1374 RSC.
- M. Louhichi, S. Romdhane, A. Fkiri, L. S. Smiri and H. Bouchriha, Appl. Surf. Sci., 2015, 356, 998 CrossRef CAS.
- H. M. Zhou, D. Q. Yi, Z. M. Yu, L. R. Xiao and J. Li, Thin Solid Films, 2007, 515, 6909 CrossRef CAS.
- S. L. Zhang, J. O. Lim, J. S. Huh, J. S. Noh and W. Lee, Curr. Appl. Phys., 2013, 13, S156 CrossRef.
- X. L. Yan, D. Hu, H. S. Li, L. X. Li, X. Y. Chong and Y. D. Wang, Phys. B, 2011, 406, 3956 CrossRef CAS.
- T. Potlog, D. Duca and M. Dobromir, Appl. Surf. Sci., 2015, 352, 33 CrossRef CAS.
- I. Iatsunskyi, M. Kempiński, M. Jancelewicz, K. Załęski, S. Jurga and V. Smyntyna, Vacuum, 2015, 113, 52 CrossRef CAS.
- L. Li, L. Fang, X. J. Zhou, Z. Y. Liu, L. Zhao and S. Jiang, J. Electron Spectrosc. Relat. Phenom., 2009, 173, 7 CrossRef CAS.
- Z. C. Pan, X. L. Tian, S. K. Wu, X. Yu, Z. L. Li, J. F. Deng, C. M. Xiao, G. H. Hu and Z. G. Wei, Appl. Surf. Sci., 2013, 265, 870 CrossRef CAS.
- A. Machocki, T. Ioannides, B. Stasinska, W. Gac, G. Avgouropoulos, D. Delimaris, W. Grzegorczyk and S. Pasieczna, J. Catal., 2004, 227, 282 CrossRef CAS.
- H. Aono, E. Traversa, M. Sakamoto and Y. Sadaoka, Sens. Actuators, B, 2003, 94, 132 CrossRef CAS.
- A. Chowdhuri, S. K. Singh, K. Sreenivas and V. Gupta, Sens. Actuators, B, 2010, 145, 155 CrossRef CAS.
- S. J. Deng, X. Liu, N. Chen, D. Y. Deng, X. C. Xiao and Y. D. Wang, Sens. Actuators, B, 2016, 233, 615 CrossRef CAS.
- N. Chen, Y. X. Li, D. Y. Deng, X. Liu, X. X. Xing, X. C. Xiao and Y. D. Wang, Sens. Actuators, B, 2017, 238, 491 CrossRef CAS.
- B. Q. Han, X. Liu, X. X. Xing, N. Chen, X. C. Xiao, S. Y. Liu and Y. D. Wang, Sens. Actuators, B, 2016, 237, 423 CrossRef CAS.
- C. P. Gu, X. J. Xu, J. R. Huang, W. Z. Wang, Y. F. Sun and J. H. Liu, Sens. Actuators, B, 2012, 174, 31 CrossRef CAS.
- L. W. Wang, Y. H. Wang, K. F. Yu, S. P. Wang, Y. Y. Zhang and C. H. Wei, Sens. Actuators, B, 2016, 232, 91 CrossRef CAS.
- H. Y. Yan, X. Q. Tian, F. G. Ma and J. Sun, Sens. Actuators, B, 2015, 221, 599 CrossRef CAS.
- J. J. Zhang, Y. Q. Liang, J. Mao, X. J. Yang, Z. D. Cui, S. L. Zhu and Z. Y. Li, Sens. Actuators, B, 2016, 235, 420 CrossRef CAS.
- S. H. Li, Y. K. Liu, Y. M. Wu, W. W. Chen, Z. J. Qin, N. L. Gong and D. P. Yu, Phys. B, 2016, 489, 33 CrossRef CAS.
- X. Yang, V. Salles, Y. V. Kaneti, M. Liu, M. Maillard, C. Journet, X. Jiang and A. Brioude, Sens. Actuators, B, 2015, 220, 1112 CrossRef CAS.
- X. Y. Cai, D. Hu, S. J. Deng, B. Q. Han, Y. Wang, J. M. Wu and Y. D. Wang, Sens. Actuators, B, 2014, 198, 402 CrossRef CAS.
- D. A. Luh, C. H. Huang, C. M. Cheng and K. D. Tsuei, Appl. Surf. Sci., 2015, 354, 235 CrossRef CAS.
- I. Simon, N. Bârsan, M. Bauer and U. Weimar, Sens. Actuators, B, 2001, 73, 1 CrossRef CAS.
- G. Korotcenkov and B. K. Cho, Sens. Actuators, B, 2011, 156, 527 CrossRef CAS.
- M. Hjiri, L. E. Mir, S. G. Leonardi, A. Pistone, L. Mavilia and G. Neri, Sens. Actuators, B, 2014, 196, 413 CrossRef CAS.
- I. S. Hwang, J. K. Choi, H. S. Woo, S. J. Kim, S. Y. Jung, T. Y. Seong, I. D. Kim and J. H. Lee, ACS Appl. Mater. Interfaces, 2011, 3, 3140 CAS.
- L. Xu, R. Q. Xing, J. Song, W. Xu and H. W. Song, J. Mater. Chem. C, 2013, 1, 2174 RSC.
- M. Wei, C. F. Li, X. R. Deng and H. Deng, Energy Procedia, 2012, 16, 76 CrossRef CAS.
- S. Park, S. Park, S. Lee, H. W. Kim and C. Lee, Sens. Actuators, B, 2014, 202, 840 CrossRef CAS.
- P. Sun, X. Zhou, C. Wang, K. Shimanoe, G. Lu and N. Yamazoe, J. Mater. Chem. A, 2014, 2, 1302 CAS.
| This journal is © The Royal Society of Chemistry 2016 |

