Glycerol as green hydrogen source for catalytic reduction over anisotropic silver nanoparticles†
A. D. Vermaa,
R. K. Mandalb and
I. Sinha*a
aDepartment of Chemistry, Indian Institute of Technology (Banaras Hindu University), Varanasi 221005, India. E-mail: isinha.apc@iitbhu.ac.in
bDepartment of Metallurgical Engineering, Indian Institute of Technology (Banaras Hindu University), Varanasi 221005, India
First published on 25th October 2016
Abstract
The search for nanomaterials for catalysis of transfer hydrogenation reactions with green hydrogen sources is an important topical issue. In this work we show that anisotropic silver nanoparticles act as efficient catalysts for p-nitrophenol (Nip) reduction with glycerol, a renewable biomass byproduct, as the green hydrogen source. Anisotropic silver nanoparticles (AgNPs) were prepared using polyol method in presence of Cu2+ salt as an etchant. These AgNPs are found to be a combination of mixture of anisotropic shapes and spherical faceted nanoparticles. The percentage of anisotropic shapes in the distribution changes with amount of etchant used. Effect of shape and size of AgNPs on the catalytic kinetics of Nip reduction using glycerol as a hydrogen source was investigated. The AgNPs sample having more nanoparticles with anisotropy and finer average particle size exhibits better kinetics, lower activation energy and better turnover frequency (TOF).
1. Introduction
The catalytic reduction of nitroarenes to aminoarenes by transfer hydrogenation methodologies is an important class of organic transformations which is frequently carried out using costly and/or toxic reductants like metal hydrides, metal borohydrides, hydrazine etc.1–3 The synthesis of aminoarenes is important because of various important applications such as corrosion inhibition, hair dyeing, useful intermediates in the pharmaceutical industry etc.4–6 Naturally, an area of topical research is the search for nanocatalysts over which efficient transfer hydrogenation of such reactions using more ecofriendly or green hydrogen sources can be executed. Biomass-derived chemicals are renewable, environment friendly and probably the most advantageous alternatives for replacing harmful and costly chemicals.7,8 In this respect, glycerol is a promising substance since it is a major byproduct of the biodiesel industries and is also obtained from other industrial processes involving biomass such as during the conversion of cellulose and lignocellulose.9 It exhibits unique combination of desirable properties necessary for use as reducing agent as well as a solvent for synthetic chemistry. Glycerol exhibits high polarity, low toxicity and flammability, high boiling point, ability to form strong hydrogen bonds and to dissolve both organic and inorganic compounds.10–15 Thus, glycerol as a hydrogen donor entails easy separation of product, transition metal complex recycling, and microwave assisted reactions. Furthermore, aerobic oxidation of glycerol over catalysts results in a variety of useful products such as dihydroxyacetone, glyceraldehyde, glyceric acid, glycolic acid, hydroxypyruvic acid, oxalic acid, and tartronic acid.16,17Among the available nitroarenes, the reduction of p-nitrophenol (Nip) using NaBH4 as the reductant has been studied extensively as a model pollutant and catalytic reduction reaction. Given its model behavior, this reaction has been used to compare the kinetics of catalytic reduction over various nanoparticles. In contrast to this conventional reaction, in which NaBH4 is used as a reductant, glycerol can work both as reductant as well as the solvent. In the present work we investigate the catalytic reduction of p-nitrophenol to p-aminophenol (AP) as a model representative of nitroarenes using glycerol as the reductant in a mixture of glycerol and water as the reaction medium. Current literature suggests that there are only few reports of nanomaterials used as catalysts in reduction of nitroarenes to aminoarenes using glycerol as the reductant. In most of these studies glycerol has been used to serve as solvent. A survey of recent literature shows that nanoparticles of Ru, Ni, Ir, Fe3O4–Ni have been used as catalysts for this class of reactions.3,18–20
In this communication we show that anisotropic silver nanoparticles (AgNPs) act as efficient catalysts for this reaction. It is well-known that shape, size and composition of nanoparticles affect their catalytic activities. One popular and simple route for preparation of anisotropic AgNPs, is by polyol route in presence of etchants like H2O2, chloride ion, bromide ion and Cu2+ ions.21,22 In the present study, first of all, we report the effect of amount of Cu2+ etchant on the type of anisotropic AgNPs formed. We then discuss the effect of shape and size of the prepared AgNPs on the kinetics of the transfer hydrogenation using glycerol as a hydrogen source. To the best of our knowledge this is a first report of silver nanoparticles being utilized as catalyst for the transfer hydrogenation reaction of Nip to AP using glycerol as a hydrogen donor. Effects of temperature on the reaction and thereby on activation energies are discussed.
2. Methodology
2.1. Synthesis of Ag nanoparticles
Materials used for the synthesis of AgNPs were AgNO3 (Merck), (CH3COO)2Cu·H2O (Merck), ethylene glycol (Merck) and polyvinylpyrrolidone (PVP) (Himedia). All reagents used were of analytical reagent grade and used without further purification. To prepare AgNPs sample designated as C1, first 49.5 mL 0.015 M AgNO3, 0.5 mL 0.015 M (CH3COO)2Cu·H2O and 25 mL 0.48 M PVP (in terms of monomer unit) solutions were made in ethylene glycol (EG) and then were mixed in a 100 mL two necked flask. N2 gas was bubbled at room temperature for about 30 min to remove oxygen dissolved in the solution. The reaction mixture was then kept in preheated oil bath at 175 °C and heated at this temperature with continuous stirring. The oil bath was maintained at 175 ± 3 °C for the next 10 minutes. During this process, the color of the reaction mixture initially turned blue and later to light yellow. Throughout this process, N2 was continuously being bubbled through reaction mixture flask. The time of heating was such that only the reduction of silver salt could occur. Therefore, the role of the copper salt in this reaction system is that of an etchant. In this preparation protocol for sample C1 the amount of the etchant (CH3COO)2Cu·H2O was taken such that the initial silver to copper salt solution precursors in ethylene glycol was in the ratio of 99![[thin space (1/6-em)]](https://www.rsc.org/images/entities/char_2009.gif) :
:![[thin space (1/6-em)]](https://www.rsc.org/images/entities/char_2009.gif) 1 in terms of millimoles. The same procedure was adopted to synthesize AgNPs samples C2, C3 and C4. Only the amount of the etchant (CH3COO)2Cu·H2O was changed such that the initial silver to copper salt solution precursors in ethylene glycol were in the ratio of 90
1 in terms of millimoles. The same procedure was adopted to synthesize AgNPs samples C2, C3 and C4. Only the amount of the etchant (CH3COO)2Cu·H2O was changed such that the initial silver to copper salt solution precursors in ethylene glycol were in the ratio of 90![[thin space (1/6-em)]](https://www.rsc.org/images/entities/char_2009.gif) :
:![[thin space (1/6-em)]](https://www.rsc.org/images/entities/char_2009.gif) 10, 66.5
10, 66.5![[thin space (1/6-em)]](https://www.rsc.org/images/entities/char_2009.gif) :
:![[thin space (1/6-em)]](https://www.rsc.org/images/entities/char_2009.gif) 33.5 and 50
33.5 and 50![[thin space (1/6-em)]](https://www.rsc.org/images/entities/char_2009.gif) :
:![[thin space (1/6-em)]](https://www.rsc.org/images/entities/char_2009.gif) 50 in terms of millimoles for AgNPs sample C2, C3 and C4 respectively. For the sake of comparison, AgNPs sample (denoted by C0) was also synthesized in absence of any etchant by the same protocol as given above.
50 in terms of millimoles for AgNPs sample C2, C3 and C4 respectively. For the sake of comparison, AgNPs sample (denoted by C0) was also synthesized in absence of any etchant by the same protocol as given above.
2.2. Analysis
X-ray diffraction measurements were done using Rigaku Miniflex 600 Japan. Dried powder samples were measured in XRD from 2 theta 30–90 degree at the scan rate of 1° per min and the step size was kept to be 0.02. Agilent Cary 60 spectrophotometer was used to record the UV-Vis absorption spectra of the AgNPs aqueous dispersions from 350–1100 nm (10 times dilution was done before recording the absorbance). The TEM studies of the AgNPs samples were carried out with FEI Technai-20 G2 operating at voltage of 200 kV. AgNPs samples were re-dispersed in ethanol to a dilution of about 10 times to that of UV-Vis absorption measurement. This solution was sonicated for 30 min in water bath. One drop of this sonicated sample was dropped on carbon coated Ni grid (200 mesh). This grid was dried for 12 hours in vacuum desiccator before imaging.2.3. Catalytic reduction of p-nitrophenol (Nip)
For this purpose, 2 mL of 2.67 M glycerol solution was taken in a standard quartz cuvette of 1 cm path length. 0.15 mL of 1.2 × 10⁻³ M Nip was added to this. Then 0.1 M NaOH solution was added to the above reaction mixture so that the pH of solution turns basic (∼8.5). This cuvette, containing the reaction mixture, was maintained at 338 K. After this, 50 μL of the as prepared C1-AgNPs sol solution was added. The absorption spectrum of this reaction mixture was recorded after every one-minute time interval. The same procedure was repeated to monitor the kinetics of the C1-AgNPs catalyzed reaction at four temperatures 323, 328, 333 and 338 K. Kinetics of C2, C3 and C4-AgNPs were also monitored at these temperatures. Further, turn over frequencies (TOF) were also calculated by dividing amount of product formed or amount of reactant used by the amount of catalyst and the time required to of reduce the reactant in case of 100% conversion. Here we used the amount of Nip consumed with time for TOF calculation.3. Results and discussion
3.1. Characterization of AgNPs
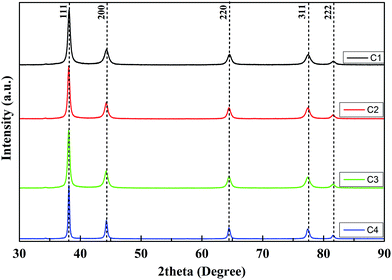
The X-ray diffraction pattern of the nanoparticle powder samples (Fig. 1) shows five peaks at 38.18°, 44.40°, 64.66°, 77.07° and 81.25°.As per XRD data reported for silver in JCPDS-ICDD (card no. 87-0720), these correspond to the [111], [200], [220], [311] and [222] planes of FCC silver. TEM micrographs of AgNPs samples C1, C2, C3 and C4 are shown in Fig. 2. The size distribution histograms of the respective AgNPs samples are displayed as inset in these figures. The average size of nanoparticles observed in samples C1, C2, C3 and C4 are ∼45, ∼58, ∼65 and ∼135 nm respectively. The crystallite sizes of AgNPs samples were calculated by the Scherrer formula. Crystallite sizes for samples C1, C2, C3 and C4 were found to be 13.9, 14.6, 16.9, 31.2 nm respectively. Since these sizes are smaller than the average nanoparticle sizes, therefore, we can conclude that the AgNPs samples prepared are made of multiple crystallites. The AgNPs size increases with the Cu2+ etchant concentration. Furthermore, the nature of shape anisotropy also changes with the etchant. We observe that at low etchant concentration (sample C1) various anisotropic shapes like rod, triangle, square and hexagon are present. However, the percentage of spherical faceted particles formed (in C1) is the largest. Table 1 gives the percentage distribution of various anisotropic shapes formed in various AgNPs samples. As the amount of Cu2+ salt was increased, the percentage of various anisotropic shapes decreased from C1 to C4. In all cases spherical faceted nanoparticles dominate the distribution. In C4, along with some of these shapes, nanowires were also formed.
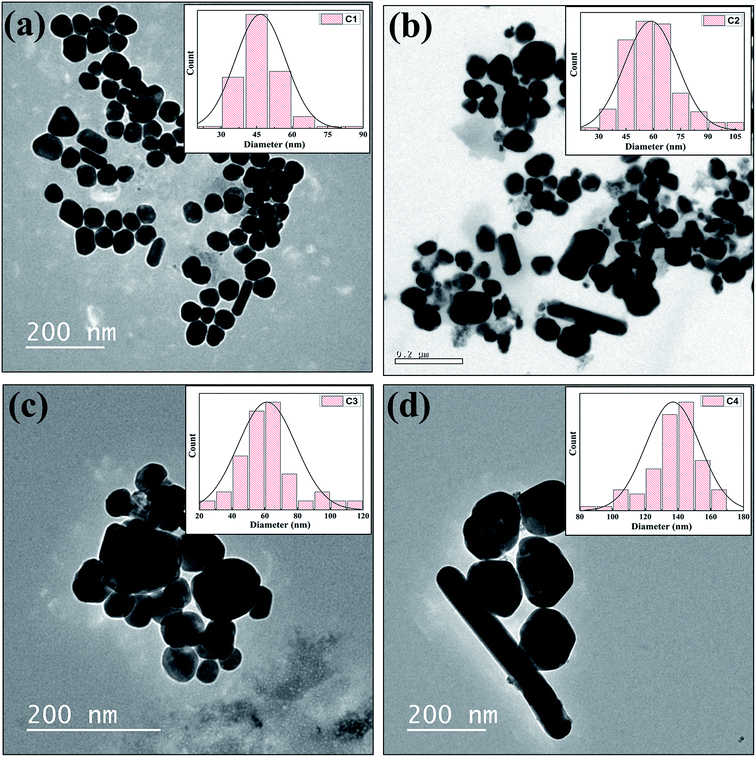 | ||
| Fig. 2 TEM images of C1, C2, C3 and C4 AgNPs shown as (a), (b), (c) and (d) respectively (particle size distributions are shown as inset of their corresponding TEM micrograph). | ||
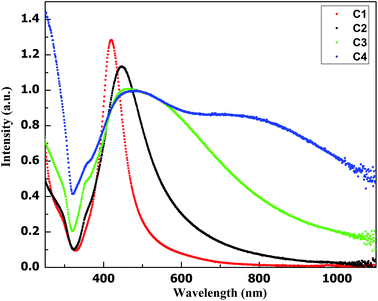
Fig. 3 shows LSPR absorbance spectra of aqueous dispersions of AgNPs samples. For samples C1, C2, C3 and C4 LSPR absorbance maxima are observed at 420, 445, 465 and 475 nm respectively. Ag nanostructures show different LSPR bands depending upon the size and shape of nanoparticles. Mock et al. reported that faceted spherical particles show a red shift in LSPR absorbance from ∼410 to ∼490 nm with the nanoparticle size variation from ∼40 to ∼90 nm.23 The gradual red shift in transverse LSPR with increase in the average particle size (from C1 to C4) is in agreement with observations in reference.23 As mentioned earlier, in all the four AgNPs samples faceted spherical shapes are in majority. AgNPs sample C1 exhibits maximum number of anisotropic shapes, whereas in other three samples the percentage of anisotropic shapes are less. The LSPR absorbance spectrum of sample C4, owing to the presence of nanowires, displays a longitudinal LSPR at 750 nm.24
3.2. Catalytic study
There was no reduction of Nip by glycerol in absence of catalyst (Fig. 4a). The decrease in intensity of absorbance at ∼406 nm (nitrophenolate ion) with time and simultaneous increase of a new absorbance peak at ∼306 nm and a small hump at ∼274 nm was observed showing the formation of AP and dihydroxyacetone respectively (Fig. 4b). This indicates that Nip was reduced to AP and glycerol was oxidized to dihydroxyacetone in presence of AgNPs as a catalyst.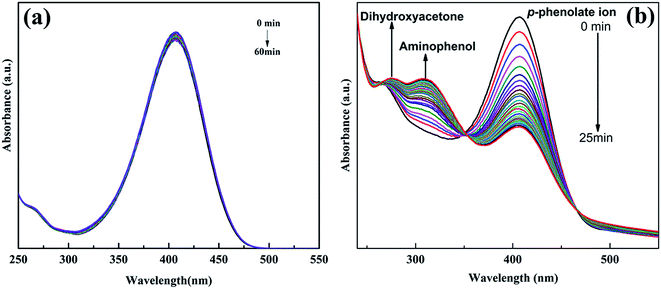 | ||
| Fig. 4 UV-Vis absorption spectra of Nip versus time of the blank sample (without AgNPs catalyst) (a) and in presence of C1 AgNPs catalyst (b). | ||
The general form of the rate equation for reduction of Nip is given by the following equation.
 | (1) |
 | (2) |
 | (3) |
The slope of the linear fit of  vs. ln
![[thin space (1/6-em)]](https://www.rsc.org/images/entities/char_2009.gif) At plot gives the order n.26,27 The value of n is found to be ∼2 for all AgNPs catalyst samples prepared. Thus, the kinetics followed is second order kinetics with respect to Nip when glycerol is the hydrogen source. This is in contrast to the pseudo first order (or in some cases zero order) kinetics reported for reduction of Nip with NaBH4 in presence of different nanocatalysts.27–29
At plot gives the order n.26,27 The value of n is found to be ∼2 for all AgNPs catalyst samples prepared. Thus, the kinetics followed is second order kinetics with respect to Nip when glycerol is the hydrogen source. This is in contrast to the pseudo first order (or in some cases zero order) kinetics reported for reduction of Nip with NaBH4 in presence of different nanocatalysts.27–29
Consequently, in Fig. 5 we plot 1/At versus time integrated kinetics plots for C1, C2, C3 and C4 catalyzed reactions. As expected in all these plots 1/At changes linearly with time. The kapp values were determined from the slope of the linear fit of (1/At) with time. The kapp values are given in Table 2. It can be seen that the kapp for C1 is highest and then the values decrease as for C2, C3 and C4 AgNPs. This correlates well with the increase in nanoparticle size from C1 to C4. As the nanoparticle size increases, the surface area of the catalyst and thus the number of surface active sites decreases. The kapp value of C1 is relatively higher than the rest of the samples. This possibly is because C1 AgNPs has the smallest average nanoparticle size with larger number of anisotropic shapes. As we move from C1–C4, the sizes of catalysts increase and the percentage of anisotropic shapes decreases, hence kapp decreases from C1 to C4.
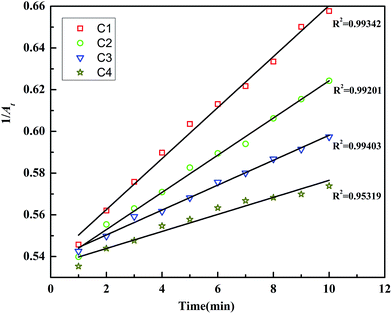 | ||
| Fig. 5 Variation of 1/At [absorbance (A) measured at λ = 406 nm] versus time (t) for C1, C2, C3 and C4 AgNPs. | ||
| Sr. no. | Catalyst | Apparent reaction rate (kapp) (mol−1 l min−1) | Activation energy (Ea) (kJ mol−1) | ||
|---|---|---|---|---|---|
| kapp | R2 | Ea | R2 | ||
| 1 | C1-AgNPs | 0.0122 | 0.99342 | 24.98 | 0.99631 |
| 2 | C2-AgNPs | 0.0089 | 0.99201 | 41.96 | 0.99462 |
| 3 | C3-AgNPs | 0.0059 | 0.99403 | 47.56 | 0.99775 |
| 4 | C4-AgNPs | 0.0041 | 0.95319 | 60.95 | 0.99052 |
| 5 | C0-AgNPs | 0.00937 | 0.988 | 52.77 | 0.99399 |
To find the activation energies of catalyst for Nip reduction, the reactions were carried out at different temperatures. These experiments showed that kapp for all AgNPs catalyst increased with temperature. The classical Arrhenius equation was employed to find out the activation energies of catalyst. Fig. 6 shows ln![[thin space (1/6-em)]](https://www.rsc.org/images/entities/char_2009.gif) kapp versus 1/T plots for all the samples C1, C2, C3 and C4. A linear fit was obtained in all the cases as per linearized Arrhenius eqn (4).
kapp versus 1/T plots for all the samples C1, C2, C3 and C4. A linear fit was obtained in all the cases as per linearized Arrhenius eqn (4).
ln![[thin space (1/6-em)]](https://www.rsc.org/images/entities/char_2009.gif) kapp = ln kapp = ln![[thin space (1/6-em)]](https://www.rsc.org/images/entities/char_2009.gif) A − Ea/RT A − Ea/RT
| (4) |
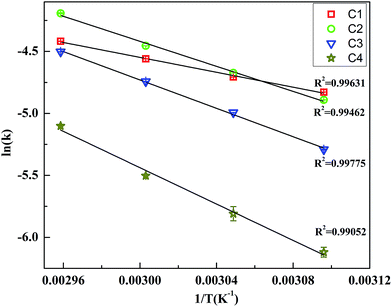 | ||
| Fig. 6 Arrhenius plot for Nip reduction reaction catalyzed by C1, C2, C3 and C4 AgNPs. Please note that for most data points, error bars are smaller than the size of the symbol used. | ||
The activation energy (Ea) was obtained from the slope (−Ea/R) of the linear fits to the plots. The values computed are in agreement with the catalytic activity of AgNPs samples. The activation energy increases from C1 to C4. As mentioned in Section 2, for the sake of comparison AgNPs were also synthesized in absence of etchant. The average size of AgNPs formed without etchant is 60 nm (Fig. S2 ESI†). Almost spherical nanoparticles (but faceted) are formed. The activation energy for AgNPs without using Cu2+ etchant was found to be 52.77 kJ mol−1 (Fig. S4 ESI†). In contrast to this the average size of C3 AgNPs is ∼65 nm, while the activation energy is 47.56 kJ mol−1. Sample C2 has an average size of 58 nm and Ea ∼ 41.96 kJ mol−1. From this comparison, we can infer that the lesser Ea of C2 and C3 is due to the anisotropic shapes present in the sample. For instance, in the paper published by Xia et al.,30 the authors reported that the activation energy of hydrogenation of benzene for anisotropic nanocrystals was almost three times lower. Narayanan et al. also showed that activation energy changes with anisotropic shapes of the catalyst.31
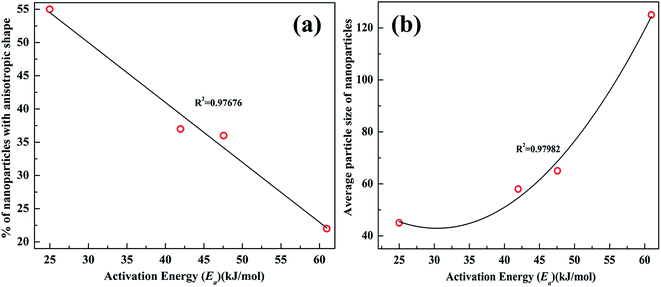
Furthermore, the activation energy value of C1 is nearly half of the values found for other catalysts. This is possibly due to the larger percentage of smaller anisotropic particles in C1. From the trend of Ea values it appears as if activation energy values are correlated with the percentage of anisotropic nanoparticles in the AgNPs sample. To verify this, we plotted percentage of nanoparticles with anisotropic shapes (excluding long nanowires) against activation energy (Fig. 7a). There seems to be an approximately linear relation between percentage of nanoparticles with anisotropic shapes and their activation energies.
As mentioned in Section 3.1, a comparison of crystallite size from XRD and nanoparticle size from TEM analysis shows that the nanoparticles are composed of multiple crystallites. Therefore, change in Ea from sample C1 to C4 could also be due to change in grain boundary densities with increase in particles sizes.32,33 Grain boundaries are high energy regions, therefore, Ea could also change due to change in grain boundary density with increase in particle size. To explore whether grain boundaries affect the activation energy or not we have plotted the activation energy against average size of the nanoparticles. The plot is non-linear and agrees with a second order polynomial fit. The activation energy increases with size of the nanoparticles (Fig. 7b). This may be because of decrease in grain boundary density with increase in the size of the nanoparticles.
Rate constant alone is not sufficient to compare the catalytic activity due to various reasons. The actual amount of catalyst and products are not considered in determining the rate constants. Furthermore, the orders of the reactions may be different. Therefore, we calculated turnover frequency (TOF) to compare the activities of these catalysts. The comparisons of rates and TOF for all four systems are tabulated in Table 3. In ref. 1 and 10 glycerol was used as the solvent. On the hand, in ref. 3, 10% glycerol was used as the hydrogen source under inert gas atmosphere and solvothermal conditions. In contrast to these (ref. 1, 3 and 10), in the present study all reactions were carried out at ∼65 °C with only 16% glycerol as the reductant. More importantly, the TOF values for all AgNPs catalysts are much higher than the earlier three studies. As shown in Fig. 7, with decreasing percentage of anisotropic shapes the activation energy decreases. Moreover, as we go from C1 to C4 the AgNPs size also increases, which means that the overall nanoparticle surface area and consequently the number of active catalytic sites also decreases. Owing to a combination of these two factors, the TOF values decrease as we go from C1 to C4.
| Sr. no. | Catalyst | Nitroarenes | Reaction conditions | TOF (min−1) | Reference |
|---|---|---|---|---|---|
| 1 | Fe3O4–Ni | 4-Nitrophenol | In glycerol at 80 °C | 2.4 × 10⁻² | 1 |
| 2 | Ru/MgLaO | Nitroarenes | In water–10% glycerol at 170 °C and inert gas pressure (N2 gas) 1 MPa in autoclave | ∼2.6 × 10⁻² | 3 |
| 3 | RANEY® Ni | Nitrobenzene | In glycerol at 70 °C | ∼4.37 × 10⁻⁴ | 10 |
| 4 | C1-AgNPs | 4-Nitrophenol | In water–16% glycerol at 65 °C | 80 | This study |
| 5 | C2-AgNPs | 4-Nitrophenol | In water–16% glycerol at 65 °C | 42 | This study |
| 6 | C3-AgNPs | 4-Nitrophenol | In water–16% glycerol at 65 °C | 27 | This study |
| 7 | C4-AgNPs | 4-Nitrophenol | In water–16% glycerol at 65 °C | 19 | This study |
4. Conclusions
Anisotropic AgNPs have been found to act as efficient catalysts for Nip transfer hydrogenation using glycerol as a green hydrogen source. The AgNPs were synthesized by a polyol process in presence of different amounts of Cu2+ salt etchant. Different etchant percentages were used to prepare four AgNPs samples. The percentage of particles with anisotropic shapes decreases with the amount of etchant. The average nanoparticle size increased with etchant concentration and on excess etchant use nanowires were also formed. All AgNPs samples were found to catalyze reduction of p-nitrophenol using glycerol as the hydrogen source. The rate of the reaction decreases with increase in average size of the nanoparticles due to consequent decrease in surface active sites. At the same time with decrease in percentage of particles with anisotropic shapes in the catalyst sample there is concomitant increase in activation energy of the reaction. An approximately linear relation has been found between the percentage of nanoparticles with anisotropic shapes and activation energy. Overall the efficacy of the catalyst decreased with increase in average particle size and decrease in extent of anisotropy. In contrast to the conventional reaction with NaBH4 as the reducing agent, this reaction with glycerol hydrogen source follows second order kinetics with respect to Nip.Acknowledgements
One of the authors (ADV) acknowledges financial support received from UGC in form of SRF.References
- M. B. Gawande, A. K. Rathi, P. S. Branco, I. D. Nogueira, A. Velhinho, J. J. Shrikhande, U. U. Indulkar, R. V. Jayaram, C. A. A. Ghumman, N. Bundaleski and O. M. N. D. Teodoro, Chem.–Eur. J., 2012, 18, 12628 CrossRef CAS PubMed.
- X. Cui, Y. Deng and F. Shi, ACS Catal., 2013, 3, 808 CrossRef CAS.
- M. Sudhakara, G. Naresha, G. Rambabu, C. Anjaneyulu, A. H. Padmasri, M. L. Kantama and A. Venugopala, Catal. Commun., 2016, 74, 91 CrossRef.
- M. S. Dieckmann and K. A. Gray, Water Res., 1996, 30(5), 1169 CrossRef CAS.
- I. Zaharia, I. Diaconu, E. Ruse and G. Nechifor, Digest Journal of Nanomaterials and Biostructures, 2012, 7(3), 1303 Search PubMed.
- D. Patil, S. Nag, A. Basak and A. Nag, Int. J. Chem. Sci., 2008, 6, 11 CAS.
- X. Chen, S. Shen, L. Guo and S. S. Mao, Chem. Rev., 2010, 110, 6503 CrossRef CAS PubMed.
- P. M. Donate, Chem. Biol. Technol. Agric., 2014, 1(4), 1 Search PubMed.
- S. Dutta and S. Pal, Biomass Bioenergy, 2014, 62, 182 CrossRef CAS.
- A. Wolfson, C. Dlugy, Y. Shotland and D. Tavor, Tetrahedron Lett., 2009, 50, 5951 CrossRef CAS.
- A. Wolfson, C. Dlugy and Y. Shotland, Environ. Chem. Lett., 2007, 5, 67 CrossRef CAS.
- A. Wolfson, A. Atyya, C. Dlugy and D. Tavor, Bioprocess Biosyst. Eng., 2010, 33, 363 CrossRef CAS PubMed.
- A. Wolfson and C. Dlugy, Chem. Pap., 2007, 61, 228 CAS.
- Y. Gu and F. Jérôme, Green Chem., 2010, 12, 1127 RSC.
- A. E. Díaz-Álvarez, J. Francos, B. Lastra-Barreira, P. Crochet and V. Cadierno, Chem. Commun., 2011, 47, 6208 RSC.
- D. Tavor, S. Popov, C. Dlugy and A. Wolfson, Org. Commun., 2010, 3(4), 70 CAS.
- D. Hekmat, R. Bauer and J. Fricke, Bioprocess Biosyst. Eng., 2003, 26, 109 CrossRef CAS PubMed.
- H. C. Maytum, J. Francos, D. J. Whatrup and J. M. J. Williams, Chem.–Asian J., 2010, 5, 538 CrossRef CAS PubMed.
- T. Zweifel, J. V. Naubron, T. Buttner, T. Ott and H. Grutzmacher, Angew. Chem., Int. Ed., 2008, 47, 3245 CrossRef CAS PubMed.
- M. Pietrowski, Green Chem., 2011, 13, 1633 RSC.
- R. Keunen, N. Cathcart and V. Kitaev, Nanoscale, 2014, 6, 8045 RSC.
- X. Tang and M. Tsuji, Syntheses of Silver Nanowires in Liquid Phase, ed. Nicoleta Lupu, Nanowires Science and Technology, 2010, p. 25 Search PubMed.
- J. J. Mock, M. Barbic, D. R. Smith, D. A. Schultz and S. Schultz, J. Chem. Phys., 2002, 116, 6755 CrossRef CAS.
- Y. Sun, Nanoscale, 2010, 2, 1626 RSC.
- S. Wunder, F. Polzer, Y. Lu, Y. Mei and M. Ballauff, J. Phys. Chem. C, 2010, 114, 8814 CAS.
- X. Gu, W. Qi, X. Xu, Z. Sun, L. Zhang, X. Liu, X. Pan and D. Su, Nanoscale, 2014, 6, 6609 RSC.
- S. K. Alla, A. D. Verma, V. Kumar, R. K. Mandal, I. Sinha and N. K. Prasad, RSC Adv., 2016, 6, 61927 RSC.
- A. D. Verma, R. K. Mandal and I. Sinha, Catal. Lett., 2015, 145, 1885 CrossRef CAS.
- B. Baruah, G. J. Gabriel, M. J. Akbashev and M. E. Booher, Langmuir, 2013, 29, 4225 CrossRef CAS PubMed.
- J. Chen, B. Lim, E. P. Lee and Y. Xia, Nano Today, 2009, 4, 81 CrossRef CAS.
- R. Narayanan and M. A. El-Sayed, Nano Lett., 2004, 4(7), 1343 CrossRef CAS.
- X. Feng, K. Jiang, S. Fan and M. W. Kanan, J. Am. Chem. Soc., 2015, 137, 4606 CrossRef CAS PubMed.
- X. Feng, K. Jiang, S. Fan and M. W. Kanan, ACS Cent. Sci., 2016, 2, 169 CrossRef CAS PubMed.
Footnote |
| † Electronic supplementary information (ESI) available. See DOI: 10.1039/c6ra23676f |
| This journal is © The Royal Society of Chemistry 2016 |

