S. Oprea*,
V. O. Potolinca and
C.-D. Varganici
“Petru Poni” Institute of Macromolecular Chemistry, Aleea Grigore Ghica Voda No. 41-A, 700487, Iasi, Romania. E-mail: stefop@icmpp.ro; Fax: +40 232 211299
First published on 31st October 2016
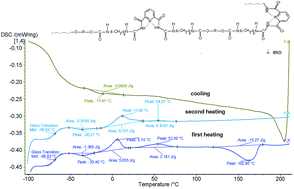
The synthesis of new heterocyclic polyurethane materials is an attractive way to study structure–property relationships. In this work we report on the introduction of 2,6-pyridinedicarboxamide into the main chains of linear and crosslinked polyurethanes. These materials were synthesized using the same soft block (Terathane 1400) and different hard blocks via a two-step polymerization method. The FTIR spectra indicated that the inclusion of pyridine derivative into polyurethane urea chain structure had been successful. The obtained polyurethane matrix structure was characterized through fewer specific intermolecular hydrogen bonds between the pyridine units, urethane and amide groups, due to the fact that the 2,6-pyridinedicarboxamide units are likely to adopt syn–syn conformations when in solid state. These heterocyclic polyurethanes also exhibit improved thermal stability (as measured by TGA) compared with conventional polyurethanes. Stress–strain curves show that the tensile strength and elongation at break are higher in the case of crosslinked samples. The properties of the linear heterocyclic polyurethanes were all compared to the properties of the crosslinked heterocyclic polyurethanes.
Pyridine derivatives, such as 2,6-pyridinedicarboxamide derivatives, have been found to reduce the viability of telomerase-positive glioma and to block cell proliferation.13 2,6-Pyridinedicarboxamide was studied for applications such as molecular delivery systems.14 Oligoamides with 2,6-pyridinedicarboxamide derivatives have the ability to stabilize themselves by intramolecular interactions between the amidic hydrogen and the oxygen atoms and the adjacent pyridine nitrogen.15 Thus, 2,6-pyridinedicarboxamide tends to adopt a syn–syn conformation.16 A series of 2,6-pyridinedicarboxamide derivatives containing two α-amino acid pendant groups,17 poly(amide-triazole) that contain 2,6-pyridinedicarboxamide18 were found to be excellent organogelators or presented supramolecular self-assembled gels for chemo-sensing applications.19
This work reports on the use of 2,6-pyridinedicarboxamide as chain extender and the effect of its mixture with different crosslinkers for the synthesis of new polyurethane urea elastomers. A comparative study was performed on the structure–properties relationships of these materials, given the syn–syn conformation of the 2,6-pyridinedicarboxamide. As a result, it was found that the reduced structural flexibility of the hard domains influences the photo-physical properties of these materials. This work continues our investigation on the introduction of heterocyclic ring moieties into the polyurethane backbone chains and their structure–properties relationships.
Fig. 1 shows the conformation structures of the 2,6-pyridinedicarboxamide used in these syntheses.
![]() | ||
Fig. 1 Conformations that may be formed by 2,6-pyridinedicarboxamide. In the case of conformation A, the 2,6-pyridinedicarboxamide bonds with the polymeric chain through intra-molecular hydrogen bonds formed between the amide N–H and the nitrogen from pyridine.14 |
Samples | Polyether/HDI/chain extenders molar ratio | Type of chain extenders |
---|---|---|
P1 | 1![]() ![]() ![]() ![]() |
2,6-Pyridinedicarboxamide |
P2 | 1![]() ![]() ![]() ![]() |
2,6-Pyridinedicarboxamide + glycerine |
P3 | 1![]() ![]() ![]() ![]() |
2,6-Pyridinedicarboxamide + castor oil |
P4 | 1![]() ![]() ![]() ![]() |
2,6-Pyridinedicarboxamide + pyrogallol |
P5 | 1![]() ![]() ![]() ![]() |
2,6-Pyridinedicarboxamide + diethylene triamine |
In the first step, a macro-diisocyanate prepolymer was prepared by reaction of the required molar ratio of dried Terathane 1400 and HDI, in a melt at 80 °C for 2 h under stirring in an oil bath. In the second step, the obtained macro-diisocyanate was chain-extended with PDCAM, or PDCAM along with different crosslinkers, at 80 °C for another 2 h (Fig. 2). In the case of two different chain extenders equal moles of the chain extenders were used. The FTIR analysis was used to ensure the complete disappearance of the characteristic NCO absorption band at 2260 cm−1.20 Due to the fact that the obtained polyurethane urea films have poor solubility in the deuterated dimethyl sulfoxide (DMSO-de), specific solvent, we are unable to perform the molecular weight distribution and NMR characterization. The polymer films, dried in an oven at 80 °C, were used to study the photo-physical properties of these polyurethane urea materials.
Thermogravimetric measurements (TGA) were performed on STA 449F1 Jupiter Netzsch (Germany) equipment. The measurements were made in the temperature range of 20–700 °C under a nitrogen flow (50 mL min−1) using a heating rate of 10 °C min−1.
Differential scanning calorimetry (DSC) measurements were conducted on a DSC 200 F3 Maia device (Netzsch, Germany) at a heating and cooling rate of 10 °C min−1, under a nitrogen inert atmosphere at a flow rate of 50 mL min−1.
To measure the stress as function of strain, dumbbell-shaped specimens (ISO 37 type 2) were cut and tested using a Shimadzu EZTest (Japan) tensile machine equipped with a 5 kN load cell. The tests were performed at room temperature (23 °C), with a cross-head speed of 50 mm min−1. All the tests were repeated 3 times and the averaged values were reported.
The surface tension of the polyurethane urea surfaces was measured by means of static contact angle using the static drop method on a Dataphysics Contact Angle System KSV CAM 101(KSV Instruments LTD, Finland) equipped with special optical system and CCD camera connected to a computer in order to capture and analyze the contact angles. Contact angle measurements were performed at room temperature using de-ionized water and ethylene glycol. Each contact angle measurement was recorded within the first 10–20 s following the placement of the sessile drop over a fresh surface region and repeated for cross-verification. The contact angle was measured with an accuracy of ±2°.
Fluorescence spectra were measured by using UV spectroscopy on JEOL-60 MHz, SPECORD M-80, and SPECORD UV-VIS spectrophotometers. The fluorescence spectra were obtained at room temperature with equipment containing a double monochromator with a diffraction network of the GDM-1000 type, a compensatory printer of the K-201 type and a selective amplifier.
![]() | ||
Fig. 3 IR-spectra of PDCAM-based polyurethanes recorded in the wavenumber ranges 3500–3200 cm−1 and 1800–900 cm−1. |
From the FTIR spectra, it can easily be observed that there are two typical absorption bands at 3308–3342 cm−1 (N–H stretching vibration) and 1620–1720 cm−1 (CO stretching vibration) which are specific to the study of intra and intermolecular hydrogen bonding after the formation of urethane groups.8
The C–O–C stretching vibration appears as a strong peak at 1105 cm−1 which means that the ether group is involved in H-bonding.
In addition to the NH absorption broad band with peaks at 3337 cm−1 and 3323 cm−1, the linear sample (P1) also presents a small absorption peak at 3465 cm−1 (free NH). This indicates that the linear polyurethane cannot form all the possible hydrogen bonds between the urethane groups (CO and N–H) and the pyridine moieties due to the specific rigid syn–syn structure of the latter, nor all the intra-molecular hydrogen bonds15 (Fig. 2). Additionally, the chemical crosslinks further reduce the freedom of movement of the molecular chains and, in the case of samples that include castor oil, its dangling chain hinder the formation of hydrogen bonds so that the samples crosslinked with castor oil exhibit a shoulder at 3342 cm−1 which is attributed to the NH groups free of H-bonds.
The absorption peaks for the stretching vibration of the pyridine ring clearly appears at the frequencies of 1536 cm−1 and 778 cm−1, both for linear samples and for cross-linked samples. Compared with 2,3-dihidroxypyridine8 or 2,3-diaminopyridine21 in which the functional groups (OH or NH2) are bonded directly to the pyridine rings, thus enhancing the formation of stronger hydrogen bonds, in the case of 2,6-pyridinedicarboxamide the rigid syn–syn structure thereof and its intra-molecular hydrogen bonds hinders the obtainment of strong hydrogen bonds.
The linear polyurethane with PDCAM moieties (P1) presents a splitting of the carbonyl absorption peak at 1720 cm−1 (hydrogen-bonded urethane) and at 1700 cm−1 (free urea).
Besides the carbonyl absorption peaks at 1720 cm−1 and 1700 cm−1, the samples crosslinked with glycerin and castor oil also exhibit an additional shoulder at 1681 cm−1 (corresponding to the mono-dentate urea). Small absorption peaks also appear at 1623 cm−1 or 1627 cm−1, which can be attributed to the bi-dentate hydrogen bonding of the urea group.3 These urea group hydrogen bonds appear with those crosslinkers which have an aliphatic chemical structure which allows for more movement of the molecular chains. The same behavior can be observed in samples with DETA as a crosslinker, albeit at a lower intensity, despite the fact that this sample has many urea groups. The presence of amide groups and the syn–syn structure of PDCAM make it easier for intra-molecular H-bonding with pyridine nitrogen to occur, in such a way that this pyridine derivative loses many of its intermolecular hydrogen bonds. Additional specific peaks appear at 1536 cm−1 for the bending vibration of the NH group and at 1211 cm−1 for the C–O linkage of the ester group. The inclusion of the amide groups into the urethane urea hard segment has the effect reducing the degree of intermolecular hydrogen bonding for the studied samples.3
The FTIR analysis of the obtained polyurethane urea is of a complex nature, due to the presence of three different types of carbonyl groups – urethane, urea and amide – which can achieve hydrogen bonds with the corresponding species. In addition, samples crosslinked with castor oil also exhibit ester carbonyl groups besides other carbonyl groups.
In order to determine the relative contribution of various carbonyl bands in the total carbonyl bands area, and therefore, in order to perform a quantification of these systems in the region carbonyl self-association, the carbonyl stretching vibration region was resolved into the individual components using a curve-fitting procedure.22
Fig. 4 shows the spectra of the associated peaks of the carbonyl region bands resolved by Gaussian curves, of values shown in Table 2.
Sample | Peak position, cm−1 (% area) | |||||
---|---|---|---|---|---|---|
1 | 2 | 3 | 4 | 5 | 6 | |
P1 | — | 1722 (13) | 1704 (36) | 1696 (8) | 1640 (7) | — |
P2 | — | 1722 (20) | 1699 (20) | 1680 (4) | 1664 (2) | 1627 (1) |
P3 | 1743 (8) | 1721 (12) | 1701 (24) | 1680 (3) | 1665 (1) | 1624 (4) |
P4 | 1748 (7) | 1721 (18) | 1700 (16) | 1685 (9) | 1665 (1) | 1631 (2) |
P5 | — | 1720 (24) | 1700 (7) | 1687 (10) | 1663 (2) | 1621 (1) |
The first difference when comparing these spectra is the lack of the absorption of linear PDCAM-based polyurethane urea in the region of the ester carbonyl groups and of the hydrogen bonded heteroatom of the pyridine ring, around 1743 cm−1 and around 1625 cm−1 respectively. The lack of the absorption peak from 1622 cm−1 can be explained by the fact that PDCAM brings a specific structure with intra-molecular hydrogen bonds which were formed between the heteroatom of the pyridine ring and the –NH groups, not enabling them to form intermolecular bonds with the hetero atom from pyridine (N–H⋯N–Py).
The absorbance of the associated urethane carbonyl bands, band 2 and band 3, assigned to free and associated urethane groups, is higher when the hard segment includes crosslinkers with OH active groups (P2, P3, P4), while the absorbance of band 4 assigned to bonded urea groups increases when there is more urea content within the hard segment (P5).
Comparing the obtained peak areas (Table 2) reveals that the hard segment structure determines the number and strength of the hydrogen bonds of the urethane and urea carbonyl groups. As the number of hydrogen bonds and cohesion of the carbonyl groups increase, it results in improved phase-separation microstructure and better mechanical properties.21
Samples | Step 1 T (°C)/mass change (%) | Step 2 T (°C)/mass change (%) | Step 3 T (°C)/mass change (%) | Tmax (°C) | Residual mass (%) |
---|---|---|---|---|---|
a Tmax – temperature that corresponds to the maximum rate of decomposition.b Residual mass – percentage of residue remained at the end of thermal degradation. | |||||
P1 | 262–332/14 | 332–384/26 | 385–457/56 | 409 | 2.22 |
P2 | 261–347/15 | 347–387/20 | 387–452/61 | 410 | 3.22 |
P3 | 317–376/20 | 376–392/1 | 392–461/77 | 420 | 1.77 |
P4 | 276–348/8 | 348–389/12 | 389–462/73 | 419 | 5.35 |
P5 | 257–333/10 | 333–385/16 | 385–454/70 | 418 | 2.33 |
The thermal analysis values show that the main thermal decomposition begins at about 260 °C and lasts until about 450–460 °C. The first step of the weight loss occurs starting from the temperature range of 257–317 °C and ends in the temperature range of 332–376 °C, the range coinciding with the onset temperatures one of the second thermal decomposition stage which ends in the domain 384–392 °C. According to the literature, the first two thermal decomposition stages correspond to depolymerization through urethane bond dissociation with hard segment decomposition,24 meaning that two of the above mentioned reaction mechanisms are overlapping.25 The third stage of thermal decomposition occurs starting from the temperature range of 385–392 °C and ends in the temperature range of 452–462 °C with a major mass loss (56–77%), attributed to the polymer chains complex decomposition by random scission reactions, together with soft segments and remaining crosslinker moieties.23,26 The TGA curves (Fig. 5) of the PDCAM-based polyurethanes show the effect of the PDCAM chain extender on the thermal stability of the samples, which is depends on the chemical structure of the crosslinkers. The maximum decomposition temperature (Tmax) occurs in the range of 409–420 °C. The lowest value characterizes samples with PDCAM (P1) and PDCAM with Gly as crosslinkers (P2), because the rigid conformational structure of PDCAM prevents the formation of multiple connections, compared with the samples crosslinked with other chain-extenders with multiple active groups which form strong hydrogen bonds that makes weight loss occurrence more difficult. As expected, this is in good agreement with the total weight loss corresponding to the first two stages, which is the highest for P1 (40%) and P2 (35%), followed by P5 (26%), P3 (21%) and P4 (20%), the last sample yielding the highest residual mass value (5.35%) (Table 3). The thermal decomposition residue left at the final stage is closely related to the hard domain structure. The fact that PDCAM tends to form links within the hard domain structure based on a syn–syn conformational structure only allows for the formation of fewer hydrogen bonds of only medium strength between active groups.16,27
DSC curves present a glass transition temperature, corresponding to soft segments, in the range −67 °C to −73 °C, with little influence from the structure of the hard domains. P1, P2 and P4 samples exhibit a less intense exothermic transition in the range −30 °C to −35 °C, which corresponds to the predominant soft segments crystallization,23 explained by the minor structural reordering of the samples. The endothermic transition with peaks in the range 2–15 °C is the melting process28 with a corresponding crystallization profile on the cooling curves between −40 and −11 °C. The samples also exhibit a less intense endothermic transition in the range 53–66 °C, only on the first heating curve and with no corresponding exothermic transition on the cooling curves, confirming the less crystalline structure of the obtained polymers. Samples P1, P2, P3 and P5 exhibit an intense exothermic process in the range 161–171 °C. This transition is associated with the formation of ordered urea hydrogen bonds.29 Sample P4 does not undergo this transition at similar temperatures from within the studied range, this transition actually taking place at even higher temperatures than the maximum studied temperature from the chosen range. This is another proof of the fact that the presence of PDCAM in the main polyurethane chain generates weak interconnections between molecular chains due to their particular structure.
The linear sample (P1) showed weaker values of tensile strength and elongation compared to the crosslinked samples. This can be explained by the syn–syn structure of the PDCAM when it is included into molecular chains, thus effectively preventing a higher degree of inter-cohesion bonding between the molecular chains. The amidic protons from PDCAM are hydrogen bonded with the pyridine's nitrogen atoms that cannot take part in intermolecular hydrogen bonds.30
The highest value of the tensile strength (9.3 MPa) and highest fracture strain (540%) was obtained in the case of polyurethanes crosslinked with DETA (P5). This is a result of the multiple urea groups that increase the intermolecular H-bonding.
High values of the tensile strength (7 MPa) were also obtained for polyurethane samples crosslinked with castor oil (P3). This is explained by the plasticizing effect of the dangling chains from the castor oil which increases the freedom of movement of the molecular chains that create a better packing of the molecular matrix, thus increasing the possibility of obtaining multiple physical cross-linking points by intermolecular hydrogen bonds.
Contact angle values are specific for each polymeric film surface as a result of the interaction between the three interfaces described by Young's equation:33
γSV = γSL + γLV![]() | (1) |
The water contact angle and surface tension measurements of the PDCAM-based polyurethanes are presented in Tables 4 and 5.
Samples | Water | Ethylene glycol | ||
---|---|---|---|---|
θ (°) | Wa (mN m−1) | θ (°) | Wa (mN m−1) | |
P1 | 89 ± 0.7 | 73 | 68 ± 1.1 | 65 |
P2 | 69 ± 1.1 | 98 | 48 ± 1.5 | 74 |
P3 | 80 ± 0.8 | 84 | 68 ± 0.8 | 65 |
P4 | 86 ± 1.2 | 77 | 67 ± 1.2 | 66 |
P5 | 81 ± 0.9 | 83 | 66 ± 1.3 | 67 |
Samples | γpSV (mN m−1) | γdSV (mN m−1) | γSL (mN m−1) | |
---|---|---|---|---|
Water | Ethylene glycol | |||
a p-polar, d-disperse. | ||||
P1 | 5.8 | 17.2 | 22.6 | 5.3 |
P2 | 13.5 | 24.0 | 12.1 | 1.7 |
P3 | 16.7 | 7.7 | 12.8 | 6.8 |
P4 | 8.5 | 14.7 | 18.5 | 4.5 |
P5 | 13.8 | 10.5 | 13.7 | 5.1 |
The water contact angle was wider (89°) for the linear samples of the PDCAM-based polyurethane (P1) as a result of the PDCAM's rigid structure which hindered the placement of the polar groups on the polymeric film surfaces. The lowest water contact angle values were obtained for samples crosslinked with glycerin (P2, 69°) and castor oil (P3, 80°). This is a result of the chemical structure of glycerin that provides enough flexibility to allow polar groups to reach the film surface. Samples with castor oil as a crosslinker presented a much higher contact angle value (80°) determined by the plasticizing effect of the dangling chains that ensures the freedom of movement of the chains, as well as by the hydrophobic nature of the castor oil.
The interfacial tension within the polymeric film-water system is determined by the polar and dispersion interactions.34 The linear sample that has only PDCAM into its hard segments exhibits increased surface tension values, while the samples crosslinked with glycerin or castor oil have the smallest values (Table 5). It should also be noted that the contact angle and surface energy values for tests performed with ethylene glycol have the same trend as those generated by water testing.
The inclusion of PDCAM moieties into the polyurethane main chain had a negative impact on the wetting performance of the samples.
The emission spectra of the PDCAM-based polyurethanes are shown in Fig. 8. All the PDCAM-based polyurethane films present broad emission bands with multiple peaks and shoulders.
Among these peaks, one may notice the sharp peaks at 422.5 nm for samples P2 and P3 and another peak at about 485 nm appearing in the case of all the samples. Other emission peaks of lower intensity appear at 448 nm, 460 nm and 528 nm. This broad emission band can be a result of the segregation of the polyurethane chains4 and of the complex structure of the hard domain due to the particular structure of PDCAM.
The intensity of the emission maxima are different depending on the hard segment structure, with higher values for samples with PDCAM and DETA (P5) followed in descending order by the samples with PDCAM and CO (P3) and the samples with PDCAM and Gly (P2). The lowest values of the emission maxima were obtained for samples with PDCAM (P1) and for samples with PDCAM and PYR (P4). This behavior can be explained by the rigid spacer with intra-molecular charge transfer quenching35 which changes depending on the used crosslinkers. The low fluorescence emission of PDCAM-based polyurethanes (P1) can be explained by a “structural self-quenching effect”,36 due to the molecular structure of PDCAM through the concomitant presence of multiple electron-donating nitrogen atoms from the pyridine ring and electron accepting carbonyls from the carboxamide groups. This particular aspect of PDCAM decreases connectivity through hydrogen bonding of the pyridine ring to the polyurethane backbone, while at the same time decreasing the charge migration between polar groups.
This journal is © The Royal Society of Chemistry 2016 |