Norbornene derived nanocarrier reduces isoniazid mediated liver toxicity: assessment in HepG2 cell line and zebrafish model†
Thangam Anjua,
Radhakrishnan Preetha*b,
Raja Shunmugam*c,
Shivshankar R. Manec,
Jesu Arockiarajd and
Venkatesh Kumaresand
aDepartment of Biotechnology, School of Bioengineering, SRM University, Kattankulathur, 603 203, Chennai, Tamil Nadu, India
bDepartment of Food and Process Engineering, School of Bioengineering, SRM University, Kattankulathur, 603203 Chennai, Tamil Nadu, India. E-mail: preetha.r@ktr.srmuniv.ac.in; Tel: +91-44-27417000
cPolymer Research Centre, Department of Chemical Sciences, Indian Institute of Science Education and Research Kolkata (IISER K), India
dDivision of Fisheries Biotechnology & Molecular Biology, Department of Biotechnology, Faculty of Science and Humanities, SRM University, Kattankulathur, 603 203, Chennai, Tamil Nadu, India
First published on 6th December 2016
Abstract
The aim of this study was to investigate the protective effect of the stimuli-responsive norbornene-based nanocarrier complex of isoniazid, compared to pure isoniazid, on liver cells, by in vivo and in vitro methods. Hepatic damage induced in a zebrafish model by isoniazid resulted in significant alterations in liver histology, gene expression of drug metabolizing genes, reduced glutathione (GSH) levels, and DNA damage. An increased level of intracellular reactive oxygen species (ROS) was detected in HepG2 cells on exposure to isoniazid. Interestingly, the isoniazid conjugated nanocarrier exhibited a more protective effect on liver cells compared to isoniazid. A significant reduction in the cyp2p6 gene, elevation in GSH levels, reduced DNA damage, and a normal histological tissue pattern was observed in liver tissues exposed to the isoniazid conjugated nanocarrier. Also, the isoniazid conjugated nanocarrier showed negligible ROS generation and in vitro cytotoxicity in HepG2 cells. These encouraging results may prompt further research in the advance of norbornene-based nano systems in nanotherapeutics and biomedical applications.
Introduction
Biomedical polymers are gaining importance due to their non-toxic, non-immunogenic, water soluble, and biodegradable nature.1,2 Recently there has been an increase in norbornene-based polymeric systems designed for drug delivery. These polymers are of great interest in industrial and academic research due to their potential applications in drug delivery and biomaterials. Ring-opening metathesis polymerization (ROMP) is the method usually preferred for polymer synthesis because of its high functional group tolerance, excellent control of molecular weight, and ability to provide a narrow polydispersity index (PDI).3 The ROMP technique is used to develop biocompatible polymeric systems, such as functionalizing norbornene moieties with a variable number of ethylene glycol/ethylene oxide units. Due to their general biocompatibility, such materials are intensively explored for their applications in the field of medical diagnostics, drug delivery and tissue engineering.4 Notably, ROMP polymers containing polynorbornene backbones have been demonstrated to be non-toxic in a variety of systems including mammalian cell lines.5–9 Cationic polynorbornene derivatives, designed for antibacterial activity showed selectivity in inhibition of bacterial growth over mammalian cells.10 As research into applications involving the interaction of biological systems with ROMP generated polymers grows, one needs to be assured of the toxicity and in vivo interactions in the clinical use of these materials. However, there is little detailed in vivo toxicity research reported on these systems and hence in the current study, we have examined the effects of a norbornene derived polymeric nanocarrier, by in vitro and in vivo assays.Isoniazid (INH), rifampicin (RIF), pyrazinamide (PYZ), and ethambutol (ETM) are the commonly used first-line drugs against TB (tuberculosis). Isoniazid, one of the primarily used first-line TB drugs, proven to induce liver toxicity even when given at the recommended doses.11–14 The nano-carrier used in the present study is a norbornene derived isoniazid copolymer (INH-CP), with high drug content as well as controlled release in a systematic manner. The hydrophobic core of this nano carrier consists isoniazid and retinol, to overcome its side effects on eye due to usage of the drug. To achieve the controlled as well as sustained drug release, the drugs are linked to the polymer backbone through acyl hydrazine linker.15 It also has a hydrophilic polyethylene glycol (PEG) containing shell structure that plays important role in biocompatibility and prolonged circulation. In the previous report, this newly designed nano carrier has been examined for its sustained release, cellular uptake and specific delivery using A549 cells (lung cancer cell lines).16 In our other unpublished report on comparative study on the anti-mycobacterial activity of the nano drug system (INH-CP) and INH at different concentrations against H37Rv strain of Mycobacterium tuberculosis, we have identified the minimum inhibitory concentrations of isoniazid and INH-CP (ESI ST1†). However, biosafety of this norbornene derived isoniazid copolymer, remains unknown on liver cells, at in vitro and in vivo.
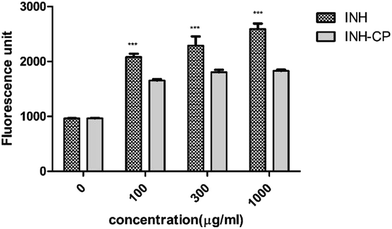
At this context in the present study, a preliminary in vitro investigation was conducted to study the effect of isoniazid and norbornene derived isoniazid copolymer on the viability of human HepG2 cells and the underlying reactive oxygen species generation (ROS) involved in the oxidative damage to the cells. To assess the in vivo biotoxicity of the norbornene-based nanocarrier, zebra fish model was used, with the hope of providing preliminary biosafety profile and hepatoprotective ability of the nano system. Zebra fish is proven to be cheap, quick and facile preclinical model to assess the toxicity of nanomaterials.17 Although a lower order vertebrate, zebra fish (Danio rerio), have similar molecular and cellular processes that can accurately model human physiology. Though zebra fish liver architecture is different to the mammalian liver; the main physiological processes remain similar, histological patterns of injury comparable to mammals and the liver injury biomarkers can be quantified in the zebra fish circulation.18
Zebra fish metabolize drugs using similar pathways as humans; they possess a wide range of cytochrome P450 enzymes enabling metabolic reactions including hydroxylation, conjugation, oxidation, demethylation and de-ethylation.19 Cytochrome P450 (CYP450) superfamily are the phase I metabolizing enzymes primarily present in drug-eliminating organs, including the liver, kidney and intestinal tract. They are often responsible for many idiosyncratic hepatotoxicity due to the formation of reactive metabolites of the drug.20 In the anti-tubercular treatment, the CYP2E1 gene has been reported to be associated with INH-induced hepatitis.21,22 In isoniazid metabolic pathway INH is either undergo hydrolysis (amidase mediated) or acetylation (NAT2 mediated) to form products such as hydrazine (hepatotoxic) and acetyl isoniazid (non toxic) respectively (Fig. S1†). Due to involvement of CYP2E1 hydrazine gets converted to toxic metabolites such as acetyldiazene, ketene and acetylonium ions. The above metabolites are further detoxicified and excreted from the body by the involvement of Glutathione S-transferases (GST) and glutathione (GSH).23,24
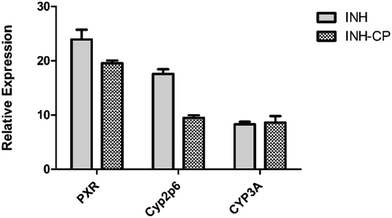
Cytochrome P4503A (CYP3A) is the major drug-metabolizing enzyme in the human liver and is responsible for the clearance of many commonly used drugs. Isoniazid treatment when combined with other tubercular drug, rifampicin is expected to increase hepatotoxicity by inducing CYP3A metabolic activity (Li et al. 1997 (ref. 25)). Hence CYP3A level was assessed in the present study. Most drugs that induce levels of CYP3A are thought to do so primarily via PXR activation.26 Pregnane X Receptor (PXR) is a nuclear receptor regulating transcription of many drug metabolizing enzymes. Human PXR is involved in regulation of most xenobiotics toxicity through CYP3A4-mediated hepatic metabolism in the presence of PXR ligand. Isoniazid is also a ligand for PXR receptor. A report from Li et al. 2013,27 has proved that risk of hepatotoxicity is higher in co treatment of RIF and INH via pregnane X receptor-mediated pathway. Overall the hepatotoxicity of the anti-tubercular drugs is because of their metabolites from phase I metabolism.24 To our advantage the PXR and CYP3A genes of zebra fish have been shown to be conserved.28,29 Though there is no direct CYP2E1 ortholog, zebra fish Cyp2p6 is 43% identical and represent the closest CYP2E1 homologs to the human protein.30 Therefore, the effect of INH and INH-CP on gene expression of PXR, CYP3A, and CYP2E1 genes has been analyzed in the current work.
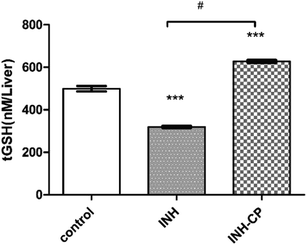
Oxidative stress is known to be the important factor in the progression of Anti-Tuberculosis Drugs (ATD) mediated Drug-Induced Liver Injury (DILI). Schwab and Tuschl, 2003,31 have demonstrated that INH could produce apoptosis in HepG2 cells even at millimolar concentrations and Slater et al., 1995 (ref. 32) has reported that one of the most reproducible inducers of cell apoptosis is mild oxidative stress. And the findings of S. Bhadauria et al., 2010 (ref. 33) has confirmed an increase in ROS generation in HepG2 cells on isoniazid exposure. Therefore, the current study attempts to identify the level of ROS production in INH and INH-CP treatment on HepG2 cells. Increased oxidative stress and raised levels of reactive oxygen species (ROS) due to the generation of reactive ATD metabolites are closely associated with decreased glutathione levels. GSH reacts to a broad selection of ROS creating GSSG (glutathione disulfide).34 GSH is a tripeptide(γ-glutamylcysteinyl glycine), a major antioxidant, which is a co-substrate to glutathione transferases in the detoxification of xenobiotics.35 Measuring GSH levels in the cells is one way to analyze oxidative stress. GSH measurement is also widely used to evaluate the toxicity of different nano particles (NPs).36 Studies have reported INH-induced formation of toxic metabolites leads to depletion of GSH stores and subsequent hepatotoxicity.37
DNA damage by oxidative stress is the other major cause for DILI by of anti-tuberculosis drugs.38
Isoniazid induces DNA damage by generation of hydroxyl free radicals (˙OH) in the presence of metal ions.39 There is also a report on unscheduled DNA synthesis and chromosomal abberations in cell lines on exposure to isoniazid.40 Moreover, cytochrome P450 2E1-mediated drug metabolism is responsible for reactive oxygen species generation, leading to DNA strand breaks.41 The single cell gel electrophoresis assay (SCGE), also known as comet assay is a simple, rapid, cheap, and sensitive method to detect DNA damage.42
The aim of the current research work was to assess the effect of norbornene derived isoniazid copolymer in: (a) hepatocellular carcinoma (HepG2) cell line, (b) to evaluate DILI in zebra fish model by visual assessment, quantification of the total glutathione level (tGSH), scoring histopathology, gene expression analysis and DNA damage. As per our knowledge this is first report of this kind for evaluating liver toxicity of the stimuli-responsive norbornene derived polymeric nanocarrier.
Materials and methods
Chemicals
Reduced glutathione (GSH), 5,5-dithiobis, 2-nitrobinzoic acid (DTNB), β-nicotinamideadenine dinucleotide 2′-phosphate reduced tetrasodium salt (NADPH), ethidium bromide (EtBr), 5-sulfosalicylic acid dihydrate (SSA), Normal Melting Agarose (NMA), Low Melting Point Agarose (LMPA), isoniazid and rifampicin (Hi Media, India). Glutathione reductase (GR) purchased from Sigma-Aldrich Co, St. Louis, USA.Cell culture
Hepatocellular carcinoma (HepG2) cell line was obtained from NCCS, Pune, India. Dulbecco's Modified Eagle's Medium with HAMS F-12 mixture, thiazolyl tetrazolium bromide (MTT), trypsin, ethylenediaminetetraacetic acid, sodium bicarbonate, penicillin and streptomycin were purchased from Sigma-Aldrich. Fetal bovine serum (FBS) and phosphate buffered saline (10×) were purchased from Gibco, Invitrogen Life Technologies.Preparation of stimuli-responsive nano carrier nano systems
Norbornene derived isoniazid copolymer (INH-CP) system was synthesized and characterized at Polymer Research Centre, Department of Chemical Sciences, Indian Institute of Science Education and Research Kolkata (IISER K), India and was characterized and reported earlier (Shunmugam et al.16). The nano carrier synthesis scheme is given in Fig. 1.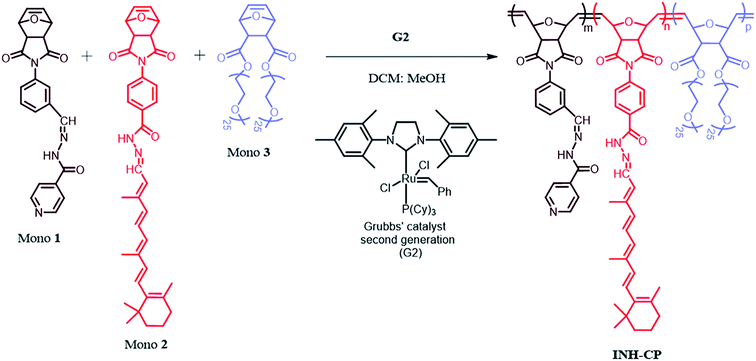 | ||
| Fig. 1 Schematic representation of INH-CP synthesis.16 | ||
In vitro cytotoxicity evaluation
![[thin space (1/6-em)]](https://www.rsc.org/images/entities/char_2009.gif) 000 IU mL−1 penicillin and 10
000 IU mL−1 penicillin and 10![[thin space (1/6-em)]](https://www.rsc.org/images/entities/char_2009.gif) 000 μg mL−1 streptomycin in a 25 cm2-culture flask in a CO2 incubator at 37 °C and 5% CO2 under controlled humidified atmosphere. Once the cells reached ∼90% confluency, they were trypsinized using trypsin (0.05%) – EDTA (0.54 mM) solution, washed thoroughly with media and subcultured into a 75 cm2 culture flask for expansion. This process was repeated twice till the cells attained a consistent growth phase. Once after the cells attained consistent growth phase, they were trypsinized at 80% confluency and then utilized for the assay.
000 μg mL−1 streptomycin in a 25 cm2-culture flask in a CO2 incubator at 37 °C and 5% CO2 under controlled humidified atmosphere. Once the cells reached ∼90% confluency, they were trypsinized using trypsin (0.05%) – EDTA (0.54 mM) solution, washed thoroughly with media and subcultured into a 75 cm2 culture flask for expansion. This process was repeated twice till the cells attained a consistent growth phase. Once after the cells attained consistent growth phase, they were trypsinized at 80% confluency and then utilized for the assay.In vivo toxicity evaluation
![[thin space (1/6-em)]](https://www.rsc.org/images/entities/char_2009.gif) :
:![[thin space (1/6-em)]](https://www.rsc.org/images/entities/char_2009.gif) 10 light/dark cycle and were fed twice daily with (1% fish weight per day) dry flake diet (Taiyo Flakes, Taiyo Feed Mill Pvt Ltd, India) and Artemia (Beryl Aqua, Fish farm, Chennai, India).
10 light/dark cycle and were fed twice daily with (1% fish weight per day) dry flake diet (Taiyo Flakes, Taiyo Feed Mill Pvt Ltd, India) and Artemia (Beryl Aqua, Fish farm, Chennai, India).All the procedures were conducted by reference to the guidelines of OECD 203 (OECD 203, 1992).45 After acclimatization, fish (weight 0.43 ± 0.07 g) were randomly selected and divided into the exposed and control group. Test concentrations for LC50 were fixed at 25, 50, 75, 100, 125 and 150 mg L−1 for INH and INH-CP, in triplicates. Test suspensions were prepared and dispensed using magnetic stirrer for 20 minutes. The control was kept under the same condition without the addition of test samples. Animals were checked twice daily for any mortality and behavioral changes at an interval of 24, 48, 72 and 96 hours. Abnormalities in behavior such as loss of equilibrium, swimming behavior, respiratory function and pigmentation were recorded daily. The LC50 dose was calculated by using the software, Statistical Product and Service Solution 23.0 (SPSS, USA). All the animal experiments were conducted according to the procedures of Committee for the Purpose of Control and Supervision of Experiments on Animals (CPCSEA) as instructed by Institutional Animal ethical guidelines, SRM University.
Real-time quantitative PCR was performed on a Light Cycler 96 Real-Time PCR system with SYBR Green Master Mix (Takara Bio, USA). The 20 μL qRT PCR mix consisted of 2 μL of cDNA, 10 μL SYBR Green Master Mix, 1 μL of forward/reverse primers (10 mM) and 7 μL of nuclease free water. A real-time PCR assay was conducted using the following PCR protocol: denaturation for 35 s at 95 °C, followed by 40 cycles of 5 s at 95 °C, and 1 min at 60 °C. The transcript of the housekeeping gene β-actin was used to standardize the results by eliminating variations in mRNA and cDNA quantity and quality, and each mRNA level is expressed as its ratio with the corresponding β-actin mRNA level.
Primer sequences and their annealing temperatures and amplification efficiencies are listed in Table 1.
| Gene name | Forward primer | Reverse primer | Annealing temperature | Reference |
|---|---|---|---|---|
| β-Actin | GAC CTG ACT GAC TAC CTC | ATA CCG CAA GAT TCC ATA C | 55.4 °C | 52 |
| cyp2p6 | ACTGAGACCACCTCCACCAC | CATTGGTGTAGGGCATGTTG | 62 °C | 24 |
| CYP3A | TTGAGGAGCGGTGGTGAGCATTAG | TGGAGAGAGTGAACTTCGGATTCG | 61.7 °C | 52 |
| PXR | ATGCGGCGACAAATCTACTGGC | TGTGAAGTGTGGCAGAGAGGTG | 60.5 °C | 52 |
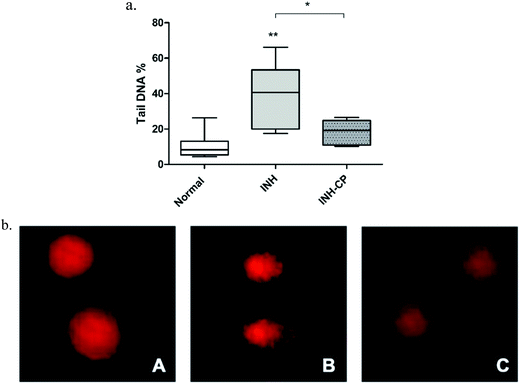
The cells that had undergone DNA damage appeared as comets, with a tail of fragmented and decondensed DNA, while the control cells had a rounder and condensed nucleus. The migration of the DNA is a function of the number of breaks and the tail length.49 Three measures of DNA damage: DNA percentage in tail, tail moment and Olive moment,50 was calculated using Open comet image analysis software. The % DNA in comet tail is the relative fluorescence intensity (DNA concentration) in the tail, and it is computed as the total comet tail intensity (It) divided by the total comet intensity (IC), multiplied by 100.51,52 % DNAt = It/IC × 100.
The tail moment was introduced by Olive et al., 1990 (ref. 53) and which is calculated by multiplying tail length and fluorescence intensity of the tail. Tail migration length is the distance from the middle of nucleoid core of the comet to the end of the tail, generally presented in microns (μm). Migration length is expected to be proportional to the level of DNA single stranded breaks (SSB) and alkali-labile site (ALS), and inversely proportional to the extent of DNA cross-linking.48 In our study, we have used the percentage of DNA in the tail as a measure of DNA damage.
Results
In vitro cytotoxicity assays
In vivo assessment of INH and INH-CP effect in adult zebra fish
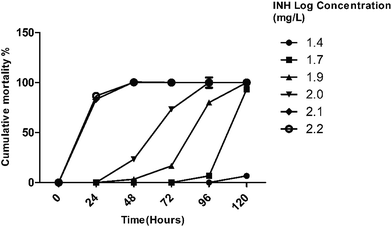
Exposure to >100 mg L−1 of isoniazid caused 100% mortality within 72 hours. The effect of exposure duration on INH toxicity was also examined. It was observed that toxic responses were more severe following longer exposure. Hence mortality in INH treatment was both dose- and time-dependent. The concentrations causing 10%, 50% and 90% of mortality (LC10, LC50 and LC90, respectively) in the toxicity experiments and their corresponding 95% confidence intervals (CI) were calculated by Probit analysis using SPSS (version 23.0). The calculated LC10, LC50 and LC90 values are given in Table 2. However, no mortalities or morphological abnormalities in was observed in INH-CP treatment even up to a concentration of 150 mg L−1 and a period of 7 days exposure. The sub-lethal dose of 50 mg L−1 for isoniazid, was used for examining the changes in gene expression and GSH levels.
| Time (hours) | LC10 (95% CI) | LC50 (95% CI) | LC90 (95% CI) |
|---|---|---|---|
| 48 | 86.802 (23.47–102.24) | 109.694 (68.84–118.09) | 138.623 (129.123–213.22) |
| 72 | 71.986 (54.094–80.903) | 86.407 (74.531–93.469) | 103.719 (96.140–115.34) |
| 96 | 50.779 (36.552–58.813) | 64.836 (54.545–71.483) | 82.783 (75.45–93.730) |
The cumulative mortality data plotted against log of dose concentration is given in Fig. 4. Using the statistical analysis, it was found that 96 h LC50 for INH and INH-CP system were significantly different (p < 0.05).
Discussion
The present study provides an overview of effects of isoniazid, and the norbornene derived isoniazid copolymer (INH-CP) system on HepG2 cell line and adult zebra fish model. The various endpoints measured in the animal model study are 96 h LC50 value and behavioral changes, histopathological examination of liver, GSH levels, changes in gene expression of drug metabolizing genes (CYP3A, cyp2p6 and PXR) and DNA damage by Comet assay.Behavioral changes during the treatment increased with dose and duration of exposure. On initial exposure to different concentrations of INH there were no behavioral alterations but at the end of the exposure, fish exhibited characteristic avoidance behavior by rapid and erratic swimming with jerky movements and hyperexcitability. Such abnormal behavior and altered movements may be associated with enzymatic and ionic disturbances in blood and tissues.54,55 Finally, the fish were found dead at the bottom of the tank; the control fish remained alive and active throughout the experimental period. Therefore, toxic effects of the standard drug (INH) was evidently different from the norbornene based nanocarrier complexed INH drug. Acute toxicity experiments show that INH toxicity was dose dependent, similar results have been reported in zebra fish embryos by Zhang Yun., et al., 2015.56 Of the two samples tested, isoniazid and INH-CP, the median lethal concentration for 96 h studies of isoniazid, was found to be 64.83 mg L−1.
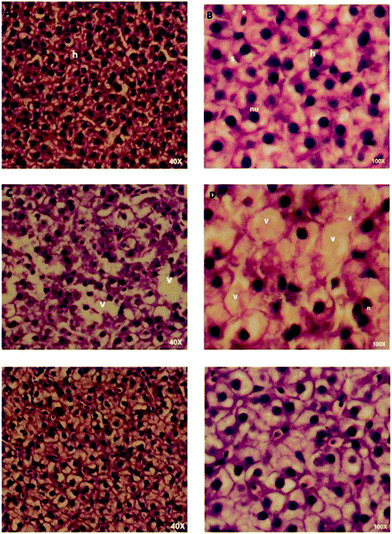
Histopathological evaluation of zebra fish liver after treatment with INH and INH-CP was conducted. Histological findings in the INH treatment (75 mg L−1) for 96 h indicate that in the adult zebra fish liver, hepatocytes cell membranes were disintegrated. The cytoplasm of the hepatocytes was moderately glycogen like – vacuolation, and also observed inflammation in the tissue. These findings indicate the INH treatment caused destructive effect in the liver tissue of zebra fish.55 Lipid accumulation with cell membrane rupture indicates deleterious effect.55 However, the isoniazid encapsulated treatment, at a dose of 150 mg for 7 days, the liver tissues did not show any adverse changes, like disintegration of cells or vacuolation in the structure of the hepatic tissue, ensuring protective effect of isoniazid when complexed in the norbornene-based system.
Measuring the level of total GSH (non-enzymatic antioxidant) is an important biomarker to study antioxidant defense system in animals. A change in tGSH level is thought to be an adaptive response of cells against oxidative stress.57 A depletion of the antioxidant enzyme has been observed in INH treatment of 50 mg L−1 for 96 hours. INH complexed in norbornene-based nano carrier, at a dose of (150 mg L−1) showed an increase in the level of the antioxidant enzyme (GSH), which can be for reducing the oxidative damage.57 However, a decrease in the GSH level during INH treatment represent severe oxidative stress and which in turn indicates the antioxidant defence system is overwhelmed by ROS.58,59
CYP2E1 has been reported for isoniazid toxicity in human hepatocytes and rats.60,61 CYP2E1 is involved in the metabolism of INH, resulting in hepatotoxic intermediates.62,63 Therefore, increase in cyp2p6 (homolog of CYP2E1) expression in INH exposure, is a sign of oxidative stress. The INH complexed norbornene-based nano carrier treatment resulted in decrease in the cyp2p6 gene expression, exhibiting control over the production of toxic metabolites from INH. But there was no difference in CYP 3A mRNA expression in INH and INH-CP treatments. The induction of PXR gene in INH-CP treatment indicate, it might be an inducer of the pregnane X receptor (PXR) gene. Our data also supports the previous findings that zebra fish homologs of the mammalian drug metabolizing genes (PXR, CYP3A and CYP2E1) are expressed in the zebra fish liver and suggest possible involvement of genes in metabolizing INH-CP system in zebra fish.29,30
Comet assay is a rapid, sensitive and economic technique for the detection of single strand breaks, hence suggested as a good nonspecific biomarker of genotoxicity in aquatic species.64
Comet assay was performed to evaluate the potential genetic damage to the hepatocytes of zebra fish on exposure to the drugs. Liver cells subjected to INH show extremely significant increase in % tail DNA compared to healthy untreated zebra fish liver cells DNA, indicate DNA damage. The percentage DNA in tail is directly proportional to the amount of damaged DNA,65 and similar results were reported earlier for isoniazid.66,67 However interestingly in the present study administration of INH complexed in norbornene-based nanocarrier showed significant reduction of DNA damage, suggesting a protective role of the norbornene-based nano carrier on liver cells. This is the first report on the protective effect of this isoniazid complexed norbornene-based nanocarrier on liver cells.
Conclusion
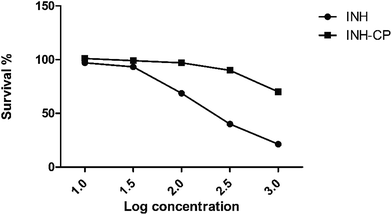
The in vitro and in vivo investigations reveal that the newly designed stimuli-responsive norbornene derived isoniazid copolymer reduces the toxic effects of INH and provides protection against the drug-induced liver toxicity. In vitro cytotoxicity assays in HepG2 cells showed that norbornene derived isoniazid copolymer had no toxicity up to 1000 μg mL−1. However, isoniazid showed 78% mortality at the same concentration. The acute in vivo toxicity studies using zebra fish model reveal that even at a higher concentration norbornene derived isoniazid copolymer, exhibit no mortality compared to isoniazid, and also observed no significant morphological or behavioral changes in zebra fish. Histopathology of INH-CP treated zebra fish liver tissues showed almost normal architecture even after treatment duration of 7 days. The findings from QPCR of PXR, CYP3A, cyp2p6 genes, total glutathione level (non-enzymatic markers of oxidative stress) and ROS production mediated DNA damage by comet assay, indicate the hepatoprotective and non-toxic nature of INH-CP system compared to INH. The present study on zebra fish model and Hep G2 cells, is the first report of the protective effect of norbornene derived isoniazid copolymer isoniazid on liver cells.Acknowledgements
We wish to thank the Department of Biotechnology, SRM University for the financial support of this project. One of the authors, Anju would like to thank Dr Winkin Santhosh (Assistant Professor, Nandanam Arts College, Chennai), Dr Kanchana Mala, SRM Medical Research, Mr Faizal Nizam, (Division of Fisheries Biotechnology & Molecular Biology, Faculty of Science and Humanities, SRM University), Dr M. R. Ganesh, (ISISM, SRM University), Dr G. Shivashekar and Dr Srinarthana (Department of Pathology, SRM Medical College and Research Centre), Dr Bhaskar (Department of Chemistry, SRM University) and Dr A. Subbarayan and Mr Nilkanth for their support in statistical analysis. We would also like to thank Mrs Mekala, Mrs Gayathri and Mr Balaji, DTP section, SRM University.References
- A. Godwin, K. Bolina, M. Clochard, E. Dinand, S. Rankin, S. Simic and S. Brocchini, J. Pharm. Pharmacol., 2001, 53, 1175–1184 CrossRef CAS PubMed.
- M. Kovar, L. Kovar, V. Subr, T. Etrych, K. Ulbrich, T. Mrkvan, J. Loucka and B. Rihova, J. Controlled Release, 2004, 99, 301–314 CrossRef CAS PubMed.
- P. R. Patel, R. C. Kiser, Y. Y. Lu, E. Fong, W. C. Ho, D. A. Tirrell and R. H. Grubbs, Biomacromolecules, 2012, 13(8), 2546–2553 CrossRef CAS PubMed.
- A. Leitgeb, J. Wappel and C. Slugovc, Polymer, 2010, 51, 2927–2946 CrossRef CAS.
- Handbook of Metathesis, ed. R. H. Grubbs, Wiley-VCH, Weinheim, 2003, vol. 3, p. 26, Trnka TM Search PubMed.
- R. H. Grubbs, Acc. Chem. Res., 2001, 34, 18–29 CrossRef.
- J. E. Gestwicki, L. E. Strong, C. W. Cairo, F. J. Boehm and L. L. Kiessling, Chem. Biol., 2002, 9, 163–169 CrossRef CAS PubMed.
- E. M. Kolonko, J. K. Pontrello, S. L. Mangold and L. L. Kiessling, J. Am. Chem. Soc., 2009, 131, 7327–7333 CrossRef CAS PubMed.
- K. Lienkamp, A. E. Madkour, A. Musante, C. F. Nelson, K. Nusslein and G. N. Tew, J. Am. Chem. Soc., 2008, 130, 9836–9843 CrossRef CAS PubMed.
- M. F. Ilker, G. N. Tew and E. B. Coughlin, in Antiterrorism and Homeland Defense, ed. J. Reynolds et al., ACS Symposium Series, American Chemical Society, Washington, DC, 2007, p. 175 Search PubMed.
- A. Tostmann, M. J. Boeree, R. E. Aarnoutse, W. C. de Lange, A. J. van der Ven and R. Dekhuijzen, J. Gastroenterol. Hepatol., 2008, 23, 192–202 CrossRef CAS PubMed.
- D. S. Askgaard, T. Wilcke and M. Dssing, Thorax, 1995, 50, 213–214 CrossRef CAS PubMed.
- A. Tostmann, et al., Int. J. Antimicrob. Agents, 2008, 31, 577–580 CrossRef CAS PubMed.
- M. Singh, P. Sasi, G. Rai, V. H. Gupta, D. Amarapurkar and P. P. Wangikar, Medicinal Chemistry Research, 2011, 20(9), 1611–1615 CrossRef CAS.
- D. L. Chen, G. Y. Wang, B. Xu and K. S. Hu, J. Photochem. Photobiol., B, 2002, 66, 188 CrossRef CAS.
- S. R. Mane, V. N. Rao, K. Chatterjee, H. Dinda, S. Nag, A. Kishore, J. D. Sarma and R. Shunmugam, J. Mater. Chem., 2012, 22, 19639–19642 RSC.
- V. E. Fako and D. Y. Furgeson, Adv. Drug Delivery Rev., 2009, 61, 478–486 CrossRef CAS PubMed.
- G. J. Lieschke and P. D. Currie, Nat. Rev. Genet., 2007, 8, 353–367 CrossRef CAS PubMed.
- A. D. B. Vliegenthart, C. S. Tucker, J. D. Pozo and J. W. Dear, Br. J. Clin. Pharmacol., 2014, 78(6), 1217–1227 CrossRef CAS PubMed.
- D. R. Nelson, L. Koymans, T. Kamataki, J. J. Stegeman, R. Feyereisen, D. J. Waxman, M. R. Waterman, O. Gotoh, M. J. Coon, R. W. Estabrook, I. C. Gunsalus and D. W. Nebert, Pharmacogenetics, 1996, 6(1), 1–42 CrossRef CAS PubMed.
- J. Watanabe, S. Hayashi and K. Kawajiri, J. Biochem., 1994, 116(2), 321–326 CAS.
- S. Hayashi, J. Watanabe and K. Kawajiri, J. Biochem., 1991, 110(4), 559–565 CAS.
- T. Sotsuka, Y. Sasaki, S. Hirai, F. Yamagishi and K. Ueno, In Vivo, 2011, 25, 803–812 CAS.
- P. Das Roy, M. Majumder and B. Roy, Pharmacogenomics, 2008, 9(3), 311–321 CrossRef CAS PubMed.
- A. P. Li, M. K. Reith, A. Rasmussen, J. C. Gorski, S. D. Hall, L. Xu, D. L. Kaminskiand and L. K. Cheng, Chem.-Biol. Interact., 1997, 107(1–2), 17–30 CrossRef CAS PubMed.
- J. M. Lehmann, D. D. McKee, M. A. Watson, T. M. Willson, J. T. Moore and S. A. Kliewer, J. Clin. Invest., 1998, 102, 1016–1023 CrossRef CAS PubMed.
- F. Li, J. Lu, J. Cheng, L. Wang, T. Matsubara, I. L. Csanaky, C. D. Klaassen, F. J. Gonzalez and X. Ma, Nat. Med., 2013, 19(4), 418–420 CrossRef CAS PubMed.
- A. C. Bainy, A. Kubota, J. V. Goldstone, R. Lille-Langøy, S. I. Karchner, M. C. Celander, A. Goksøyr and J. J. Stegeman, Aquat. Toxicol., 2013, 142, 447–457 CrossRef PubMed.
- T. Bresolin, M. de Freitas Rebelo and A. Celso Dias Bainy, Comp. Biochem. Physiol., Part C: Toxicol. Pharmacol., 2005, 140(3–4), 403–407 CrossRef PubMed.
- O. Tsedensodnom, A. M. Vacaru, D. L. Howarth, C. Yin and K. C. Sadler, Dis. Models & Mech., 2013, 6, 1213–1226 CAS.
- C. E. Schwab and H. Tuschl, Hum. Exp. Toxicol., 2003, 22, 607–615 CAS.
- A. F. Slater, C. Stefan, I. Nobel, D. J. van den Dobbelsteen and S. Orrenius, Toxicol. Lett., 1995, 82, 149–153 CrossRef PubMed.
- S. Bhadauria, R. Mishra, R. Kanchan, C. Tripathi, A. Srivastava, A. Tiwari and S. Sharma, Toxicol. Mech. Methods, 2010, 20(5), 242–251 CrossRef CAS PubMed.
- S. J. Stohs and D. Bagchi, Free Radical Biol. Med., 1995, 18, 321–336 CrossRef CAS PubMed.
- A. N. Glazer and E. L. Smith, in The Enzymes ed. P. D. Boyer, Academic Press, New York, third edn, 1971, vol. 3, p. 502 Search PubMed.
- C. Harris and J. M. Hansen, Methods Mol. Biol., 2012, 889, 325 CAS.
- J. S. Crippin, Am. J. Gastroenterol., 1993, 88(4), 590–592 CAS.
- B. Sangameswaran, S. K. Baljeet, S. Arpita, K. Ilango and P. D. Govind, Continental Journal of Pharmaceutical Sciences, 2012, 6, 30–35 CrossRef.
- K. Ito, K. Yamamoto and S. Kawanishi, Biochemistry, 1992, 31(46), 11606–11613 CrossRef CAS PubMed.
- R. F. Whiting, L. Wei and H. F. Stich, Mutat. Res., Fundam. Mol. Mech. Mutagen., 1979, 62(3), 505–515 CrossRef CAS PubMed.
- A. A. Caro and A. I. Cederbaum, Annu. Rev. Pharmacol. Toxicol., 2004, 44, 27–42 CrossRef CAS PubMed.
- R. R. Tice, E. Agurell, D. Anderson, B. Burlinson, A. Hartmann and H. Kobayashi, et al., Environ. Mol. Mutagen., 2008, 35, 206–221 CrossRef.
- T. Mosmann, J. Immunol. Methods, 1983, 65(1–2), 55–63 CrossRef CAS PubMed.
- Z. Mostafavi-Pour, F. Khademi, F. Zal, A. R. Sardarian and F. Amini, Hepatitis Mon., 2013, 13(8), 11447 Search PubMed.
- OECD, Fish acute toxicity test, Organization for economic cooperation and development, Paris, 1992 Search PubMed.
- A. G. E. Pearse, in Histochemistry. Theoretical and Applied, Analytical technology, Churchill-Livingstone, Edinburgh, London, 4th edn, 1985, vol. 2, p. 441 Search PubMed.
- I. Rahman, A. Kode and S. K. Biswas, Nat. Protoc., 2006, 1, 3159 CrossRef CAS PubMed.
- R. R. Tice, E. Agurell, D. Anderson, B. Burlinson, A. Hartmann, H. Kobayashi, Y. Miyamae, E. Rojas, J. C. Ryu and Y. F. Sasaki, Environ. Mol. Mutagen., 2000, 35, 206–221 CrossRef CAS PubMed.
- N. P. Singh, M. T. McCoy, R. R Tice and E. L. Schneider, Exp. Cell Res., 1998, 175, 184–191 CrossRef.
- T. S. Kumaravel and A. N. Jha, Mutat. Res., 2006, 605, 7–16 CAS.
- CometScore Tutorial, http://AutoComet.com, accessed May 2016.
- A. Schnurstein and T. Braunbeck, Ecotoxicol. Environ. Saf., 2001, 49, 187–196 CrossRef CAS PubMed.
- P. L. Olive, J. P. Banath and R. E. Durand, Radiat. Res., 1990, 122, 86–94 CrossRef CAS PubMed.
- A. Larsson, B. E. Bengtsson and C. Haux, Aquat. Toxicol., 1981, 1(1), 19–35 CrossRef CAS.
- J. C. Wolf, W. A. Baumgartner, V. S. Blazer, A. C. Camus, J. A. Engelhardt, J. W. Fournie, S. Frasca Jr, D. B. Groman, M. L. Kent, L. H. Khoo, J. M. Law, E. D. Lombardini, C. R. Fehlert, H. E. Segner, S. A. Smith, J. M. Spitsbergen, K. Weber and M. J. Wolfe, Toxicol. Pathol., 2015, 43, 297–325 CrossRef PubMed.
- Z. Yun, W. Yuan, C. W. Yun, S. Chen, W. Xi min, H. Qiuxia, H. Li wen, W. Xue, H. Jian and L. Kechun, Shandong Sci., 2015, 28(5), 14–21 Search PubMed.
- J. M. Zodrow, J. J. Stegeman and R. L. Tanguaya, Aquat. Toxicol., 2004, 66, 25–38 CrossRef CAS PubMed.
- A. Dubey, M. Goswami, K. Yadav and D. Chaudhary, PLoS One, 2015, 10(5), e0127493 Search PubMed.
- E. Oberdörster, Environ. Health Perspect., 2004, 112, 1058–1062 CrossRef.
- J. Yue, R. X. Peng, J. Yang, R. Kong and J. Liu, Acta Pharmacol. Sin., 2004, 25, 699–704 CAS.
- J. Yue and R. Peng, Br. J. Pharmacol., 2009, 157, 331–333 CrossRef CAS PubMed.
- D. E. Ryan, L. Ramanathan, S. Iida, P. E. Thomas, M. Haniu, J. E. Shively, C. S. Lieber and W. Levin, J. Biol. Chem., 1985, 260(10), 6385–6393 CAS.
- Y. S. Huang, H. D. Chern, W. J. Su, J. C. Wu, S. C. Chang, C. H. Chiang, F. Y. Chang and S. D. Lee, Hepatology, 2003, 37(4), 924–930 CrossRef CAS PubMed.
- C. L. Mitchelmore and J. K. Chipman, Mutat. Res., 1998, 399, 135–147 CrossRef CAS PubMed.
- A. R. Collins, M. Dobson, G. Dusinska, G. Kennedy and R. Stetina, Mutat. Res., 1997, 375, 183–193 CrossRef CAS PubMed.
- S. K. Jatav, A. Kulshrestha, A. Zacharia, N. Singh, G. Tejovathi, P. S. Bisen and G. B. Prasad, J. Evidence-Based Complementary Altern. Med., 2014, 19(3), 189–194 CrossRef PubMed.
- M. Sankar, J. Rajkumar and J. Devi, Pak. J. Pharm. Sci., 2015, 28(3), 983–990 CAS.
Footnote |
| † Electronic supplementary information (ESI) available. See DOI: 10.1039/c6ra23557c |
| This journal is © The Royal Society of Chemistry 2016 |

