Synthesis and application of magnetic reduced graphene oxide composites for the removal of bisphenol A in aqueous solution—a mechanistic study

Penglei Wangab, Xin Zhouab, Yagang Zhang*abc, Lulu Wangab, Keke Zhiab and Yingfang Jiangab
aCenter for Green Chemistry and Organic Functional Materials Laboratory, Xinjiang Technical Institute of Physics and Chemistry, Chinese Academy of Sciences, Urumqi 830011, China. E-mail: ygzhang@ms.xjb.ac.cn; Fax: +86-991-3838957; Tel: +86-18129307169
bUniversity of Chinese Academy of Sciences, Beijing 100049, China
cDepartment of Chemical & Environmental Engineering, Xinjiang Institute of Engineering, Urumqi 830023, China

Received 21st September 2016 , Accepted 20th October 2016

First published on 21st October 2016


Abstract

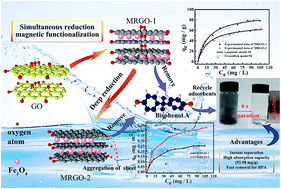
Two kinds of magnetic reduced graphene oxide composites (MRGO) namely MRGO-1 and MRGO-2 with different reduction degrees are synthesized by a facile method. MRGO-2 is obtained by further reduction of MRGO-1 using hydrazine to obtain a relatively deeper reduction degree. Removal of bisphenol A (BPA) from aqueous solution using MRGO-1 and MRGO-2 is investigated. The kinetics and isotherm data of BPA absorbed by MRGO-1 and MRGO-2 are both well fitted with the pseudo-second-order kinetic model and the Langmuir isotherm, respectively. The maximum adsorption capacity of MRGO-1 and MRGO-2 for BPA obtained from the Langmuir isotherm is 92.98 mg g−1 and 71.66 mg g−1 at 288.15 K, respectively. Furthermore, the used MRGO-1 and MRGO-2 could be collected and recycled efficiently via an external magnet. The BPA adsorption capacity of the MRGO-1 still remained greater than 86% of the initial adsorption capacity after nine repeated absorption–desorption cycles. A thermodynamic study shows that the adsorption is a spontaneous and exothermic process. The maximum adsorption capacity of MRGO-1 for BPA is higher than that of MRGO-2, implying a deeper reduction process to MRGO-2 from MRGO-1 is not essential for the removal of BPA from aqueous solution. The energy is saved by omitting the deep reduction process. It is also found that if severe aggregation of graphene sheets in the deep reduction process to MRGO-2 from MRGO-1 can be alleviated, the corresponding absorption capacity of MRGO-2 for BPA may be greatly improved.

1. Introduction

Endocrine-disrupting chemicals (EDC) can interfere with mammalian development through mimicking the action of the sex hormone oestradiol, and the exposure of developing rodents to high doses of EDCs will advance puberty and alter their reproductive function.1 Hence, EDCs have drawn considerable attention and concern in recent years.2 Bisphenol A (BPA), an EDC, is widely used as an intermediate in the production of polycarbonate and epoxy resins, flame retardants and other special products.3 BPA has been reportedly detected in waste landfill leachates, rivers, seas and soils.3,4 Moreover, the natural degradation of BPA requires more than 90 years, which means that the pollution resulting from accumulated BPA can last for several decades once released into water or soil.5 Therefore, the removal of BPA from contaminated wastewater is becoming an important issue in environmental pollution remediation and wastewater purification.

To remove BPA from polluted aqueous systems, various methods have been developed, such as adsorption,2,6–14 heterogeneous Fenton degradation,15 ozonation and catalytic ozonation,16,17 biological treatment.18 Among those, adsorption is a superior and widely used method due to the low cost, simple operation condition and high efficiency.2 A variety of carbon-based materials have been reported for the removal of BPA in aqueous solution.2,9–12 As one of the most commonly used adsorbents, activated carbon is versatile for organic pollutants removal, but it has several defects, including slow pollutant uptake19 and relatively weak removal capacity for many hydrophilic micropollutants. Furthermore, the regeneration of used activated carbon is quite energy consuming (usually requiring heating to 500–900 °C), which does not fully restore its original performance.20 As a result, other kinds of adsorbents, such as carbon nanotubes,14,21 porous carbon,22 graphene composites,2,11 have been developed recently.

Graphene is a single atomic layer of sp2-hybridized carbon arranged in a honeycomb structure. The remarkable properties of graphene, such as extremely high surface area (with a calculated value of 2630 m2 g−1),23 excellent chemical stability,24 and graphitized basal plane structure,23 leading its strong π–π interactions with the aromatic compounds. Besides, as graphene based materials, graphene oxides (GO), has also been extensively investigated to remove organic pollutants due to its large specific surface area and a variety of oxygenated functional groups. Major mechanism of organic chemicals absorbed on graphene based materials is proposed to be hydrophobic interactions, hydrogen bonds, π–π interactions, electrostatic interactions. Xu et al.2 found that the reduced graphene oxides (RGO) presented very high adsorption capacity and fast adsorption rate for BPA. Both π–π interactions and hydrogen bonds might be responsible for the adsorption of BPA on RGO.2 Cortes-Arriagada et al.10 and Zhong et al.12 also demonstrated that the π–π stacking and hydrogen bonding interaction played main role in the adsorption of BPA on GO by theoretical calculation using Density Functional Theory (DFT). GO, whose basal planes are decorated mostly with epoxide and hydroxyl groups, the edges are presumably modified by carbonyl and carboxyl groups due to the presence of oxidized graphene sheets,25,26 these oxygen-containing groups on the GO and RGO basal plate can form hydrogen bonds with hydroxyl groups of BPA.10,12,27 Whereas the graphitized basal plane structure of GO is strongly disrupted due to the presence of abundant oxygen-containing groups,26 which may reduce the π–π interactions between graphene-based materials and BPA. Although the reduction or de-oxygenation of GO result in significant restoration of the sp2 carbon sites leading to re-graphitization,28 the de-oxygenation of GO will also impair the hydrogen bonding interactions between graphene based materials and BPA. In addition, severe aggregation of graphene layers during the acute reduction process of GO will reduce its specific surface areas,2,28,29 which may decrease its absorption ability for organic pollutions. Thus, it is interesting and important to investigate the reduction process of RGO and its influence on the absorption ability for BPA. To our best of knowledge, this type of study has not been reported.

Graphene-based materials are difficult to separate from water because of their small particle size and excellent dispersibility in water,30 which makes it difficult to recycle absorbents. In the past few years, magnetic separation has emerged as a useful tool which simply involves applying an external magnetic field to collect the used adsorbents from solution. Compared with traditional methods, such as filtration, centrifugation or gravitational separation, magnetic separation is less energy consuming and can achieve better separation efficiency especially for adsorbents with small particle size. In this way, used magnetic nano adsorbents are easy to be retrieved from the reaction system under a magnetic field, and then retrieved adsorbents are regenerated for reuse. These advantages of magnetic graphene and magnetic reduced graphene oxides (MRGO) are potentially beneficial to the real applications.

In this work, MRGO were synthesized and applied to remove BPA from aqueous solutions. The objectives of this paper are (1) synthesize and characterize the MRGO (2) investigate the adsorption behaviour of MRGO with different reduction degree for the removal of BPA in aqueous solutions by controlling different experimental conditions such as the absorption time, BPA concentration, temperature, pH (3) compare and evaluate the adsorption capacity of MRGO with different reduction degree for the removal of BPA in aqueous solution (4) propose possible adsorption mechanism of BPA on MRGO through adsorption kinetics, isotherms, and thermodynamic studies.

2. Experimental

2.1 Materials

Natural graphite powder (200 mesh, 99.9% purity), bisphenol A (97% purity) were purchased from the Alfa Aesar Chemical Co., Ltd. The molecular structure of bisphenol A is shown in Fig. 1. All other chemicals are analytical grade and purchased from Tianjin Zhiyuan Chemical Co., Ltd. All of the chemicals were used without further purification unless notified. Ultrapure water was used throughout the experiments.
image file: c6ra23542e-f1.tif
Fig. 1 Molecular structure of BPA.

2.2 Synthesis of GO

GO was prepared from graphite powder according to an established procedure with minor modifications.31 In a typical procedure, 9[thin space (1/6-em)]:[thin space (1/6-em)]1 mixture of concentrated H2SO4/H3PO4 (360[thin space (1/6-em)]:[thin space (1/6-em)]40 mL) was added to 1000 mL round bottom flask. The flask was placed in an ice bath and the mixture of graphite powder (3.0 g, 1 wt equiv.) and KMnO4 (18.0 g, 6 wt equiv.) was added slowly to the flask while the temperature was kept below 10 °C. The mixture was heated to 50 °C and stirred for 12 h. After that, the reaction was cooled down to room temperature and poured onto ice cold water (400 mL), then H2O2 (30%) aqueous solution were added to the suspension to stop the reaction until the color of the suspension changed to bright yellow. The suspension were repeatedly centrifuged and washed first with HCl (30%) solution then with ultrapure water until the pH value of the supernatant was neutral (pH = 7). The collected precipitate was vacuum-dried overnight at room temperature and graphite oxide flakes were obtained. Finally, GO was obtained through an ultrasonic treatment of the graphite oxide flakes which were dispersed in ultrapure water.

2.3 Synthesis of MRGO

MRGO were synthesized by in situ chemical co-precipitation method.32 A representative procedure is as follows: 1.5 g of GO was dispersed in 600 mL of ultrapure water by ultrasonic treatment (150 W) until it became clear with no visible particulate matter. Then an aqueous solution of 5.4 g FeCl3·6H2O and 2.8 g FeSO4·7H2O was added dropwise to GO solution at room temperature with stirring under N2 atmosphere. The temperature of solution was raised to 80 °C, 50 mL ammonia solution (30%) was added to make solution pH = 10 and the mixture was sequentially stirred for 30 min to promote the complete growth of the magnetite nanocrystals. The suspensions were cooled down to room temperature, and then samples were centrifuged and washed with water and ethanol three times, finally dried in vacuum oven overnight. Those products obtained were labelled as MRGO-1.

In order to obtain MRGO with deeper reduction degree, the above described process was slightly modified, the aqueous solution of 5.4 g FeCl3·6H2O and 2.8 g FeSO4·7H2O was added dropwise to GO solution, the other part of the process was all the same. At last, 10 mL of hydrazine hydrate (80%) was added under constant stirring for 4 h at 90 °C. Other protocols were the same as the above methods. The products obtained were labelled as MRGO-2.

2.4 Characterization of GO and MRGO

X-ray diffraction (XRD) analysis was performed using a diffractometer (D8-ADVANCE, Bruker AXS, Germany) with Cu Kα radiation of wavelength λ = 0.1541 nm at 40 kV and 40 mA. Transmission electron microscopy (TEM) was used to investigate the microstructures of MRGO-1 and MRGO-2 with an electron microscope (FEI Tecnai G20, FEI, America) at voltage of 200 kV. The magnetic properties of the MRGO-1 and MRGO-2 were measured using MPMS XL-7, (Quantum Design, America). The samples were characterized by Fourier transform infrared spectroscopy (FTIR) (FTS165, BIO-RAD, USA) to monitor the surface functional groups using KBr plate. The BET specific surface areas (SBET) of MRGO-1 and MRGO-2 were determined with an Autosorb-1-C Chemisorption/Physisorption Analyzer (Quantachrome, USA) by nitrogen adsorption at 77.3 K using the Brunauer–Emmett–Teller (BET) method to calculate the specific surface areas. The surface element compositions were characterized using X-ray photoelectron spectroscopy (XPS) carried out on a Thermo ESCALAB 250XI spectrometer using monochromatic 150 W Al Kα radiations. Raman spectra were recorded from 40 to 4000 cm−1 on a micro laser Raman spectrometer (Horiba Scientific, France). The zeta potentials for a suspension of 0.2 g L−1 MRGO-1 and MRGO-2 in 0.1 M KNO3 solution were determined using a Zetasizer Nano ZS90 (Marlven), five runs and ten cycles were set for each measurement. Each sample was measured five times. Thermogravimetric analysis (TGA) was carried out in air using a TGA analyzer (Nietzsche, STA449F3, Germany). The amount of iron oxide in magnetic MRGO-1 and MRGO-2 was measured from ambient temperature up to 800 °C at heating rate of 10 °C min−1.

2.5 Adsorption studies

The adsorption of BPA by MRGO-1 and MRGO-2 were performed using batch uptake experiment. The stock solution of BPA was prepared by dissolving 1.0 g BPA in ethanol/water (200 mL/800 mL), and was further diluted with water to the desired concentrations before using. The initial pH of the aqueous solution was adjusted with 0.1 M HCl or 0.1 M NaOH. All adsorption experiments were performed in sealed 250 mL glass conical bottles that contained 20 mg of adsorbents and 100 mL of a BPA solution at different concentrations. The bottles were placed in a shaking bath with a shaking speed of 200 rpm at set temperature. After adsorption experiments, the adsorbents were removed using a permanent magnet and the supernatant was collected. The concentration of BPA in the supernatant was quantified by measuring the absorbance of the solution using UV-Vis spectrophotometer (UV-2600, SHIMADZU, Japan) at 276 nm. The adsorption capacity of BPA was calculated according to eqn (1).
 
image file: c6ra23542e-t1.tif(1)
where Co and Ce (mg L−1) represent the initial and equilibrium concentrations of BPA aqueous solution, V (L) is the volume of the solution, and m (g) is the mass of the adsorbent.

Adsorption kinetic study was carried out with an initial BPA concentration of 50 mg L−1 at 288.15 K, pH 6.0 to determine the minimum time required to reach equilibrium concentration of BPA in uptake experiment. The concentrations of BPA were measured at different time intervals from 5 min to 300 min. Adsorption isotherms of different adsorbents (MRGO-1 and MRGO-2) were obtained at 288.15 K with initial BPA concentrations varied from 10 to 120 mg L−1 and initial pH of 6.0. To evaluate the thermodynamic properties of BPA by MRGO-1, absorption isotherms of MRGO-1 for BPA were also obtained at 313.15 K and 323.15 K (at pH = 6.0), respectively. The effect of pH on the adsorption of BPA using MRGO was investigated at different pH values varied from 3 to 10 with an initial BPA concentration of 50 mg L−1 at 288.15 K.

2.6 Regeneration and recycling of MRGO

The used MRGO were collected from the suspension by magnet. Then, the used MRGO were placed into conical flask containing 50 mL methanol solvents solution. After shaking for 1 h, placed on a shaker, and then separated from the suspension by magnet. Finally, the regenerated MRGO were dried at 60 °C for 2 h.

3. Results and discussion

3.1 Characterization of MRGO-1 and MRGO-2

XRD measurements were carried out to investigate the phase structure of the obtained samples. Fig. 2A shows the XRD patterns of the graphite and GO. The diffraction peak of the graphite at 2θ = 26.1° indicates an interlayer spacing of 0.34 nm. After oxidation, the characteristic graphite peak disappeared and was displaced by a new peak at 2θ = 10.4° with 0.937 nm d-spacing. The increased d-spacing of GO sheets is due to the introduction of oxygen-containing functional groups on the graphite sheets causing an atomic-scale roughness on the graphite sheets.33,34 All these results indicated GO is successfully synthesized. Fig. 2B shows the XRD patterns of MRGO-1 and MRGO-2. The diffraction patterns for MRGO-1 and MRGO-2 have mainly six broad peaks at 30.4°, 35.6°, 43.3°, 53.2°, 56.9° and 62.7°, corresponding to (2 2 0), (3 1 1), (4 0 0), (4 2 2), (5 1 1) and (4 4 0) of Fe3O4 (JCPDS no. 001-1111). The very weak peak at 24.4° (0 0 2) corresponding to the graphene can be clearly seen. The results suggest that Fe3O4 nanoparticles deposited on the GO surface can suppress the stacking of graphene layers.33 In addition, other weak peaks are attributed to a little γ-Fe2O3 phase.
image file: c6ra23542e-f2.tif
Fig. 2 XRD patterns of the graphite and GO (A), XRD patterns of the MRGO-1 and MRGO-2 (B).

The morphology of MRGO-1 and MRGO-2 was characterized by TEM. Fig. 3A, B, D and E show TEM images of MRGO-1 and MRGO-2. As can be seen from the TEM images of MRGO-1 and MRGO-2 Fe3O4 nanoparticles are uniformly distributed on the surface of reduced graphene oxides (RGO), and the graphene sheets show folding nature which is clearly visible. High resolution TEM (HRTEM) was also used to characterize MRGO-1 and MRGO-2. In Fig. 3C and F, the lattice fringes are 0.252 nm and 0.252 nm in MRGO-1 and MRGO-2, which correspond to the (3 1 1) lattice planes of Fe3O4. Besides, the energy dispersive X-ray spectroscopy (EDX) clearly shows the existence of iron (Fe) in the MRGO-1 and MRGO-2 composites in Fig. S1. The EDX results also show the relative differences in element composition of MRGO-1 and MRGO-2, especially for carbon (C) and oxygen (O). The C/O ratio of MRGO-1 is less than that of MRGO-2. In summary, TEM, HRTEM and EDX indicate coexistence of Fe3O4 nanoparticles and RGOs in MRGO-1 and MRGO-2, which is well consistent with the XRD results.


image file: c6ra23542e-f3.tif
Fig. 3 TEM images (A and B) and HRTEM images (C) of MRGO-1, TEM images (D and E) and HRTEM images (F) of MRGO-2; EDX element composition data of MRGO-1 and MRGO-2 below the TEM images.

The chemical structures of GO, MRGO-1 and MRGO-2 were investigated by FTIR and the resulting spectra is shown in Fig. 4. The FTIR spectrum of GO exhibits the characteristic peaks for O–H (3410 cm−1), C[double bond, length as m-dash]O (1729 cm−1), aromatic C[double bond, length as m-dash]C (1631 cm−1), carboxy C–O (1405 cm−1), epoxy C–O (1217 cm−1) and alkoxy C–O (1053 cm−1).31,33,34 The FTIR spectrum of MRGO-1 exhibits the characteristic peaks for O–H (3410 cm−1), COO (1597 cm−1 and 1392 cm−1), C[double bond, length as m-dash]C (1552 cm−1), epoxy C–O (1181 cm−1) and alkoxy C–O (1053 cm−1). Obvious decrease in the intensity of the characteristic absorption bands of oxygen functionalities compared to GO, suggesting that GO has been reduced in the preparation process of MRGO-1. Fan et al.35 also observed that exfoliated GO can be reduced under strongly alkaline conditions at moderate temperatures (50–90 °C). The FTIR spectrum of MRGO-2 shows three peaks at 3410 cm−1, 1556 cm−1 and 1181 cm−1, which correspond to the O–H stretching vibration, aromatic C[double bond, length as m-dash]C stretch and C–O stretch. The band at 584 cm−1 is attributed to Fe–O.36 There is an obvious decrease for absorption bands of oxygen functionalities compared to MRGO-1, indicating the MRGO-1 is further reduced to MRGO-2.


image file: c6ra23542e-f4.tif
Fig. 4 FT-IR spectra of GO, MRGO-1 and MRGO-2.

TGA curves for MRGO-1 and MRGO-2 were measured from 25 to 800 °C in air with a heating rate of 10 °C min−1 as showed in Fig. 5. Based on the weight loss upon graphene combustion and the assumption that Fe3O4 was fully oxidized to Fe2O3 at 400 °C, the content of Fe3O4 in nanocomposites is calculated to be 62.83 wt% and 67.66 wt% for MRGO-1 and MRGO-2, respectively. Apparently, the content of reduced graphene oxides (RGO) (37.17%) in MRGO-1 is slightly higher than that of RGO (32.34%) in MRGO-2, which is due to more oxygen containing functional groups presented in MRGO-1.


image file: c6ra23542e-f5.tif
Fig. 5 TGA curves of MRGO-1 (A) and MRGO-2 (B).

Significant structural changes occurring during the reduction processing from GO to MRGO-1, and then to the MRGO-2, are also reflected in Raman spectra. The Raman spectrums show two characteristic peaks in both GO, MRGO-1 and MRGO-2 (Fig. 6). One is G band at ∼1588 cm−1, which signifies the sp2 carbon atoms in a graphitic 2D hexagonal lattice. The D band at 1341 cm−1 indicates the sp3 carbon atoms of defects and disorder.37 The intensity ratio of D/G bands (ID/IG) is generally accepted to reflect the graphitization degree of carbonaceous materials and the defect density.38 The value of ID/IG of MRGO-2 (1.21) is higher than that of MRGO-1 (1.02) and GOs (0.72), which is ascribed to the increase in the number of polyaromatic domains in reduction process.39 It also indicates decrease in the average size of the sp2 domains upon reduction of GO and MRGO-1. The possible explanation is that a certain amount of new graphitic domains are created that are smaller in size compared to the ones present in GO before reduction.28 Therefore, MRGO-1 and MRGO-2 obtained through reduction treatment result in the partially restoration of the sp2 carbon sites, which leading to the increase in degree of graphitization.


image file: c6ra23542e-f6.tif
Fig. 6 Raman spectra of (a) GOs, (b) MRGO-1 and (c) MRGO-2.

Magnetization spectrums (Fig. 7) of the MRGO-1 and MRGO-2 were measured at room temperature over the range of −20 to 20 kOe. The saturation magnetization of MRGO-1 and MRGO-2 are calculated to be 15.6 and 14.7 emu g−1, respectively, indicating a high magnetism. The magnetic hysteresis loops are S-like curves. The magnetic remanence of the MRGO-1 and MRGO-2 are 0.61863 and 0.54761 emu g−1, indicating there is almost no remaining magnetization when the external magnetic field was removed. Thus MRGO-1 and MRGO-2 exhibit superparamagnetic behavior. A simple laboratory set-up was established and conducted to evaluate the magnetic separation effect of MRGO-1, as shown in Fig. 7 (bottom inset). After adsorption, MRGO-1 was completely separated from the aqueous solution within 6 s in the presence of an external magnet.


image file: c6ra23542e-f7.tif
Fig. 7 Magnetization curve of MRGO-1 and MRGO-2 at room temperature. The bottom inset is the photographs of MRGO-1 dispersed in 50 mg L−1 BPA aqueous solution in the absence (left) and presence (right) of an external magnet.

XPS measurements were conducted to further analyze surface element composition and chemical states. XPS survey spectrums of the MRGO-1 and MRGO-2 in Fig. 8A show photoelectron lines at binding energy of 285, 530 and 711 eV which are attributed to C 1s, O 1s and Fe 2p, respectively. In the spectrum of Fe 2p (Fig. 8B), the peaks of Fe 2p3/2 and Fe 2p1/2 are showed up at 711.2 and 724.9 eV rather than at 710.35 and 724.0 eV which is evidence for γ-Fe2O3.40 This result implies successful formation of Fe3O4 phase in the RGO. The C 1s peaks of the MRGO-1 and MRGO-2 were shown in Fig. 8C and D, the peaks at 284.7, 286.2, 287.9 eV and 289 eV correspond to aromatic rings (C–C/C[double bond, length as m-dash]C), the epoxy/hydroxyls carbon (C–O/C–OH), the carbonyl carbon (C[double bond, length as m-dash]O), and the carboxylate carbon (O–C[double bond, length as m-dash]O),36 respectively. The quantitative analysis shows that the content of oxygen-containing carbon in the MRGO-2 is lower than that of MRGO-1, which also supports that MRGO-2 is further reduced compared to MRGO-1. These results are well consistent with FT-IR and Raman studies.


image file: c6ra23542e-f8.tif
Fig. 8 XPS spectra of GO, MRGO-1 and MRGO-2. (A) Survey spectra, high resolution (B) Fe 2p peaks of MRGO, (C) C 1s peaks of MRGO-1, (D) C 1s peaks of MRGO-2.

The nitrogen adsorption–desorption curve was obtained to evaluate the specific surface area and pore size distribution. Fig. 9A shows the SBET of the MRGO-1 and MRGO-2 are measured as 310.04 m2 g−1 and 145.74 m2 g−1. MRGO-1 and MRGO-2 both show type IV isotherms classified by IUPAC with the distinct hysteresis loops close to H3 type feature. It further suggests that the MRGO-1 and MRGO-2 have a characteristic of typical lamellar stacking. The specific surface area of MRGO-1 and MRGO-2 are significantly lower than the theoretical surface area for isolated graphene sheets (2620 m2 g−1) is probably due to the aggregation of the GOs upon reduction.41 Compared to MRGO-1, the lower surface area of MRGO-2 may be caused by the deeper reduction process. Noticeably, such a high surface area (310.04 m2 g−1) for MRGO-1 is significantly superior to most of Fe3O4–graphene composites reported in the literature.12,29,42,43 Moreover, Fig. 9B also shows the pore size distribution of MRGO-1 and MRGO-2. The total pore volumes of MRGO-1 and MRGO-2, calculated from the nitrogen adsorption isotherm, are 0.2968 and 0.2850 cm3 g−1, respectively. The average pore diameter of MRGO-1 and MRGO-2 are 3.829 and 7.822 nm, respectively.


image file: c6ra23542e-f9.tif
Fig. 9 Nitrogen adsorption and desorption isotherms (A) and pore size distribution profile (B) of MRGO-1 and MRGO-2.

3.2 BPA adsorption kinetics

The effect of time on the adsorption of BPA by MRGO-1 and MRGO-2 was studied and summarized in Fig. 10 in order to evaluate the BPA adsorption and to probe the equilibration time for maximum uptake. Results indicate that BPA removal using MRGO-1 and MRGO-2 is time dependent. The adsorption capacity of MRGO-1 and MRGO-2 increases quickly in the first 30 min until the adsorption equilibrium was reached within about 4 h. Based on this result, an uptake time of 4 h was chosen for BPA absorption by MRGO-1 and MRGO-2. Two well established kinetic models (pseudo-first-order and pseudo-second-order) were applied to evaluate the efficiency of adsorption and investigate the mechanism of the adsorption process.44,45 For the pseudo-first-order model, the absorption capacity can be expressed by Lagergren's rate.
 
ln(qeqt) = ln[thin space (1/6-em)]qek1t (2)
where qe and qt (mg g−1) represent adsorbed BPA amounts on MRGO-1 and MRGO-2 at equilibrium and various times t, respectively, and k1 is the rate constant of the pseudo-first-order model of adsorption (1/min). The values of qe and k1 can be determined from intercept and slope of the linear plot of ln(qeqt) against t as described in Fig. S2A and S2B.

image file: c6ra23542e-f10.tif
Fig. 10 Effect of time on the adsorption of BPA by MRGO-1 and MRGO-2 (20 mg of adsorbent and 100 mL of 50 mg L−1 BPA at 288.15 K).

The pseudo-second-order model includes all the steps of adsorption including external film diffusion, adsorption, and internal particle diffusion which is summarized in eqn (3).46

 
image file: c6ra23542e-t2.tif(3)
where qe and qt are defined the same as in the pseudo-first-order model and k2 is the rate constant of the pseudo-second-order model of adsorption (g mg−1 min−1). The slope and intercept of the linear plot of t/qt against t determine the values of qe and k2 as described in Fig. S2C and S2D. The rate constants of the kinetic models (k1 and k2) and qe (cal) are calculated from slope and intercept of plot and are presented in Table 1. The correlation coefficient R2 value for the pseudo-second-order model of MRGO-1 and MRGO-2 both exceed 0.999, which is much higher than that of the pseudo-first-order model. These results imply that the pseudo-second-order kinetic model fits the adsorption kinetics better than the pseudo-first-order model, which suggests absorption is dependent on the amount of solute adsorbed on the adsorbent surface as well as the amount adsorbed at equilibrium.27,45,47,48 Note that the adsorption rate constant k2 (0.00576 g mg−1 min−1) and the equilibrium absorption capacity (60.94 mg g−1) of MRGO-1 are both higher than that of MRGO-2. This means MRGO-1 is more effective to adsorb BPA than MRGO-2. Moreover, the adsorption rate constant k2 of MRGO-1 for BPA removal is also relatively higher compared to values of other carbonaceous adsorbents previously reported in the literatures as shown in Table 2.

Table 1 Kinetic parameters for the adsorption of BPA by MRGO-1 and MRGO-2
Pseudo-first-order Pseudo-second-order
Adsorbents qe (mg g−1) k1 (1/min) R2 qe (mg g−1) k2 (mg g−1 min−1) R2
MRGO-1 35.47 0.06419 0.8736 60.94 0.00576 0.9997
MRGO-2 14.99 0.01787 0.8816 45.25 0.00355 0.9991


Table 2 The adsorption rate constant for the adsorption of BPA by different absorbent
Absorbents BPA Co (mg L−1) Amount of absorbent (g L−1) k2a (mg g−1 min−1) Reference
a The adsorption rate constant from pseudo-second-order model and the unit is normalized to mg g−1 min−1.
As-grown CNTs 10.0 0.125 0.008167 9
rGOs 1.0 0.02 0.002183 12
Magnetic rGOs 1.0 0.02 0.002383 12
1.0 CEC-HDTMA 100 NA 0.005483 49
Activated carbon-PCB 60 0.25 0.003030 50
Fe3O4/GO hybrids 50 0.5 0.000941 47
MRGO-1 50 0.2 0.005761 This work
MRGO-2 50 0.2 0.003551 This work


3.3 BPA adsorption isotherms

The adsorption isotherm models can be used to investigate the interaction between the absorbents and the adsorbates when the adsorption process reaches equilibrium. It also allows us to estimate the maximum adsorption capacity. Fig. 11 shows the adsorption isotherms of BPA by MRGO-1 and MRGO-2 at 288.15 K. The adsorption capacity of MRGO-1 and MRGO-2 increases with the concentration of BPA and finally reaches saturation gradually. Langmuir and Freundlich isotherm models are employed to evaluate the adsorption process. The Langmuir isotherm model assumes monolayer adsorption on a surface with a finite number of identical sites, that all sites are energetically equivalent and there is no interaction between adsorbed molecules51 (see eqn (4))
 
image file: c6ra23542e-t3.tif(4)

image file: c6ra23542e-f11.tif
Fig. 11 Adsorption isotherms of BPA by MRGO-1 and MRGO-2 at 288.15 K. The solid lines are the Langmuir model simulation; the dotted lines are the Freundlich model simulation.

In eqn (4), qe represents the adsorbed BPA per gram of absorbent (mg g−1) at equilibrium, Ce represents the equilibrium concentration of BPA in solution (mg L−1), KL is Langmuir constant (L mg−1), which is related to the affinity of the binding sites, and qm represents the theoretical maximum adsorption capacity of the adsorbent (mg g−1).

The Freundlich model is an empirical expression, which assumes that a multilayer adsorption occurs on the heterogeneous surface or surface supporting sites of various affinities. The equation is commonly described as shown in eqn (5).52

 
qe = KFCe1/n (5)
qe and Ce are defined as in the Langmuir isotherm and KF and n are the Freundlich constants that represent the adsorption capacity and adsorption strength. The magnitude of 1/n quantifies the degree of heterogeneity of the adsorbents surface and the favorability of adsorption. If n > 1, suggesting favorable adsorption.49 The relative parameters calculated from non-linear fits of Langmuir and Freundlich models of BPA adsorption by MRGO-1 and MRGO-2 are summarized in Table 3.

Table 3 Adsorption isotherm parameters for BPA on MRGO-1 and MRGO-2 at 288.15 K and pH 6.0
Langmuir model Freundlich model
Absorbents qm (mg g−1) Ka (L mg−1) R2 n KF (mg g−1) R2
MRGO-1 98.98 0.05566 0.9951 2.732 15.29 0.9773
MRGO-2 71.66 0.05681 0.9913 12.82 12.29 0.9759


According to the correlation coefficient (R2) values, adsorption of BPA by MRGO-1 and MRGO-2 fitted better by the Langmuir isotherm than the Freundlich isotherm. In other words, the adsorption of BPA by MRGO-1 and MRGO-2 take place in a monolayer adsorption manner. In addition, the maximum adsorption amount of MRGO-1 and MRGO-2 for BPA at 288.15 K is 92.98 mg g−1 and 71.66 mg g−1, respectively. Clearly, the maximum adsorption amount of MRGO-1 is higher than that of MRGO-2 for BPA, which is also decent and even superior values compared to the ones using other adsorbents previously reported in the literatures summarized in Table 4. Previous literature has reported that Fe3O4 has almost no adsorption for BPA.14 It is reasonable and understandable that adsorption capacity of MRGO-1 and MRGO-2 for BPA is lower than that of graphene and SWCNTs because of the high Fe3O4 content in MRGO-1 and MRGO-2. The specific adsorption capacity of RGO in MRGO is actually higher. According to the TGA data, the content of RGO in MRGO-1 is 37.17%, the maximum adsorption amount for BPA by RGO in MRGO-1 is calculated to 250.15 mg g−1. For MRGO-2, the maximum adsorption amount of RGO in MRGO-2 is calculated to 221.58 mg g−1. The relatively higher adsorption amount of BPA on RGO in MRGO than that of reported graphene is ascribed to the more adsorption site of RGO in MRGO, because the presence of Fe3O4 is able to prevent the aggregation of graphene sheet.

Table 4 Adsorption capacity of BPA by MRGO-1, MRGO-2 and other materials reported in previous literature
Adsorbent pH T (K) SBET (m2 g−1) Max Qea (mg g−1) Reference
a Maximum adsorption capacity obtained from the Langmuir model or from the adsorption capacity at the highest initial concentration.b Data not available.
Graphene 6 302.15 327 181.6 2
Porous carbon produced at 700 °C NAb 296.15 251 11.4 22
Porous carbon produced at 1000 °C NAb 296.15 300 41.8 22
SWCNTs 6.5 NAb 520 199 11
rGO-1 6.5 NAb 330 152 11
MWCNTs 6.5 NAb 120 59.4 11
Graphite 6.5 NAb NAb 4.14 11
Commercial graphene 6.5 NAb NAb 26.0 11
Magnetic rGOs 6.5 293 128 48.74 12
ZFAF prepared from coal fly ash 11.2 288.15 2.8 3.5 13
SMZFA L prepared from coal fly ash 9.6 288.15 50.6 56.8 13
Surfactant-modified montmorillonite NAb 288.15 NAb 20.7–32.0 53
HDTMA-modified SAz-2-MMT 7 297.15 76 151.52 49
Fe3O4/GO 6 288.15 127 84.75 47
10% CNTs/Fe3O4 6.2 288.15 17.9 38 14
20% CNTs/Fe3O4 6.2 288.15 34.3 40 14
50% CNTs/Fe3O4 6.2 288.15 50.6 48 14
Modified CNTs 6 280.15 95 70 9
P-CDP 7 288.15 263 88 54
MRGO-1 6 288.15 310 92.98 This work
MRGO-2 6 288.15 146 71.66 This work


3.4 Adsorption thermodynamic study

Thermodynamic parameters provide valuable information about the energy change in the system as well as help predicting the distribution of species upon reaching the equilibrium.55 The adsorption of BPA by MRGO-1 was investigated at 288.15, 313.15 and 328.15 K. As shown in Fig. 12, the adsorption capacity of MRGO-1 decreases with increasing temperature, indicating that the lower temperature is desirable for the adsorption of BPA. This result indicates that BPA absorption on MRGO-1 is an exothermic process. The thermodynamic parameters, including Gibbs free energy change (ΔG°), enthalpy change (ΔH°) and entropy change (ΔS°) for BPA adsorption by MRGO-1 were determined by varying the temperature of adsorption system. The standard free energy change (ΔG°) can be calculated from the following equation.
 
ΔG° = −RT[thin space (1/6-em)]ln[thin space (1/6-em)]K° (6)
R is the universal gas constant (8.314 J mol−1 K−1) and T is the absolute temperature. K1, the distribution adsorption coefficient, is obtained from eqn (7).46
 
image file: c6ra23542e-t4.tif(7)

image file: c6ra23542e-f12.tif
Fig. 12 Adsorption isotherms of BPA by MRGO-1 at three different temperatures (288.15 K, 313.15 K and 318.15 K).

The adsorption equilibrium constant, K°, can be calculated by plotting ln[thin space (1/6-em)]K1 versus Ce and extrapolating Ce to zero. The value of the intercept is ln[thin space (1/6-em)]K. The standard enthalpy change (ΔH°) and the standard entropy change (ΔS°) are calculated from eqn (8).

 
image file: c6ra23542e-t5.tif(8)

The slope and intercept of ln[thin space (1/6-em)]K° versus 1/T are −ΔH°/R and ΔS°/R. The linear fit obtained is displayed in Fig. S3. The thermodynamic parameters calculated at three different temperatures are summarized in Table 5. The negative standard free energy change (ΔG°) indicates that the adsorption is spontaneous. The negative ΔH° value implies the exothermic character of adsorption, which is also supported by the results that the adsorption capacity of BPA decreased when temperature increased. The negative standard entropy change (ΔS°) reflects decreased randomness at the solid liquid interface during the adsorption of BPA on MRGO-1.9

Table 5 Thermodynamic parameters of BPA adsorption by MRGO-1
Thermodynamic constant T (K)
288.15 313.15 328.15
ln[thin space (1/6-em)]K° 1.202 0.8992 0.4684
ΔG° (kJ mol−1) −2.979 −2.341 −1.278
ΔH° (kJ mol−1) −19.82
ΔS° (J mol−1 K−1) −52.27


Generally, physical absorption has characteristic ΔG° value in the range of 20 to 0 kJ mol−1, while for chemical absorption, ΔG° value is in the range of 400 to 80 kJ mol−1.55 As can be seen in Table 5, ΔG values varied from −2.979 to −1.278 kJ mol−1 within measured temperature range, indicating MRGO-1 and BPA form weak interaction associated to physical absorption process. In addition, for chemical absorption process, the ΔH value ranges from 83 to 830 kJ mol−1 while for physical absorption, the ΔH value ranges from 8 and 25 kJ mol−1.55 The ΔH value for BPA adsorption by MRGO-1 is 19.82 kJ mol−1, also indicating physical absorption occurs in BPA uptake by MRGO.

3.5 Effect of initial pH on adsorption of BPA by MRGO-1 and MRGO-2

The solution pH is another important factor that determines the adsorption capacity of an adsorbent considering it can change the net charge of the adsorbents and adsorbates during adsorption process. Fig. 13 shows the effect of the solution pH on BPA adsorption by MRGO-1 and MRGO-2 within the pH range from 3.0 to 10.0. It can be seen that adsorption capacity of BPA shows almost no change within pH range of 3–8, whereas an obviously adsorption decreasing was observed within pH range of 8–10. This result can be explained by the net charge of adsorbents and BPA at different pH values. As shown in Fig. S4, MRGO-1 and MRGO-2 were both negatively charged when the pH value varied from 5 to 10. The BPA molecules can present in three different forms in aqueous media, namely, non-dissociated molecules (BPA), BPA monoanions (BPA-1) and BPA dianions (BPA-2). pKa1 = 8.0 is associated with the formation of the monoanion and pKa2 = 9.0 is related to the dianion.56 Thus, the observed decrease of adsorption capacity of MRGO-1 and MRGO-2 within the pH ranges of 8–10 could be due to the repulsive electrostatic interactions between the negatively charged surface of MRGO and BPA-1 or BPA-2.
image file: c6ra23542e-f13.tif
Fig. 13 The effect of pH on adsorption of BPA onto MRGO-1 (A) and MRGO-2 (B) (20 mg of adsorbent and 100 mL of 50 mg L−1 BPA at 288.15 K).

3.6 Recyclability of MRGO-1

The regeneration and recyclability of the absorbent are essential factors for its practical application. As shown in Fig. 14, the BPA adsorption capacity of the MARGO-1 remain greater than 86% of the initial adsorption capacity after nine repeated absorption–desorption cycles, indicating that the MRGO-1 possessed excellent recyclability and has great potential applications in removing organics from polluted water.
image file: c6ra23542e-f14.tif
Fig. 14 Adsorption of BPA by recycled MRGO-1 (20 mg of MRGO and 100 mL of 50 mg L−1 BPA at 288.15 K).

3.7 Adsorption mechanism

The possible interactions between the carbonaceous materials and organic chemicals are mainly π–π stacking, hydrogen bonding, electrostatic interaction and hydrophobic interactions.11,57 The dominant interaction in adsorption mechanism varies for different types of organic chemicals and adsorbents. To identify accurately the role of surface area in absorption of BPA by MRGO-1 and MRGO-2, the adsorption isotherms were normalized by surface area shown in Fig. 15. The surface area normalized adsorption capacity of MRGO-2 is much higher than that of MRGO-1.
image file: c6ra23542e-f15.tif
Fig. 15 Surface area normalized adsorption isotherms of BPA on MRGO-1 and MRGO-2.

Electrostatic interaction is often used to interpret the ionic organic chemicals adsorption onto oxygen-containing carbonaceous adsorbents, while based on the results of pH, the electrostatic interactions could not be the dominate force in adsorption process.

The intensity of hydrophobic interaction can be predicted by the octanol–water partition coefficient (Kow) of organic chemicals. The Kow (158.48) and low water solubility (120–300 mg L−1)12 of BPA possibly support the absorption of BPA on absorbents through hydrophobic interaction. Considering the fact that the surface area normalized adsorption capacity of MRGO-1 is much lower than that of MRGO-2 due to the higher oxygen contents in MRGO-1 than that in MRGO-2, hydrophobic interactions may play a role in adsorption of BPA by MRGO-1 and MRGO-2. According to the previous report, for BPA adsorption on carbonaceous adsorbents, the hydrophobic interaction does not play a dominate role.12 Instead, the π–π interactions and hydrogen bonding are mainly responsible for the adsorption of BPA on graphene based materials. Xu et al.2 found that RGO presented very high adsorption capacity and fast adsorption rate for BPA. Both π–π interactions and hydrogen bonds may be responsible for the adsorption of BPA on RGO. Cortes-Arriagada et al.10 also demonstrated that the π–π stacking and hydrogen bonding were main forces in the adsorption of BPA on GO by DFT calculations. In this work, we find that hydrogen bonding interaction is not the dominant factor for BPA adsorption by MRGO-1 and MRGO-2. Considering that oxygen-containing functional groups are in favour of the formation of hydrogen bonds between BPA molecules and MRGO, the surface area normalized adsorption capacity of MRGO-1 should be higher than that of MRGO-2 due to the fact that MRGO-1 has more oxygen-containing functional groups than MRGO-2 when hydrogen bond is the dominant adsorption force of BPA. However, the experimental result is completely opposite. MRGO-2 has more graphitized structure than MRGO-1 which could enhance π–π interactions between BPA and MRGO. The surface area normalized adsorption capacity of MRGO-2 is higher than that of MRGO-1, which supports strongly that π–π interaction between BPA and the graphene sheets of MRGO should be the dominant mechanism for the adsorption of BPA on MRGO. These results also imply that for RGO, if severe aggregation in the reduction process can be alleviated, deeper reduction of GO may be beneficial for its enhancement of absorption capacity of BPA due to strengthened π–π interactions.

4. Conclusions

MRGO was designed and prepared for BPA removal from aqueous solution via a co-precipitation method. The kinetics and isotherm data of BPA absorbed by MRGO with different reduction degree are both well fitted with the pseudo-second-order kinetic model and the Langmuir isotherm, respectively. It was found that the maximum adsorption capacity of MRGO-1 and MRGO-2 for BPA obtained from the Langmuir isotherm were 92.98 mg g−1 and 71.66 mg g−1 at 288.15 K, respectively. Results indicate MRGO-1 and MRGO-2 have excellent adsorption capacity and fast adsorption rate for BPA compared to other adsorbents reported in other literatures. Furthermore, thermodynamic study indicates the absorption of BPA by MRGO is a spontaneous exothermic process. Low temperature and close to neutral pH are found to be favourable for the adsorption of BPA. Moreover, the used MRGO-1 and MRGO-2 could be quickly and efficiently collected and recycled via an external magnet. The BPA adsorption capacity of the MARGO-1 still remain greater than 86% of the initial adsorption capacity after nine repeated absorption–desorption cycles. The SBET of MRGO-2 (145.74 m2 g−1) is lower than that of MRGO-1 (310.04 m2 g−1). This was proposed to severe aggregation of graphene sheet in MRGO-2 caused by further reduction treatment. The maximum adsorption amount of MRGO-1 was higher than that of MRGO-2, indicating deep reduction process may not be essential to remove BPA using Fe3O4–graphene based composite materials. However, if severe aggregation of graphene sheets in the deep reduction process can be alleviated, further reduction of MRGO could be beneficial owing to its helping strength of π–π interactions. Finally, π–π interaction between BPA and the graphene sheets of MRGO was found to be the dominant mechanism for the adsorption of BPA on MRGO.

Acknowledgements

This work was financially supported by “One Thousand Talents” Program (Y32H291501) of China, National Natural Science Foundation of China (21472235), Xinjiang Distinguished Youth Scholar Program (wr2015jq012).

Notes and references

  1. K. L. Howdeshell, A. K. Hotchkiss, K. A. Thayer, J. G. Vandenbergh and F. S. vom Saal, Nature, 1999, 401, 763–764 CrossRef CAS PubMed.
  2. J. Xu, L. Wang and Y. Zhu, Langmuir, 2012, 28, 8418–8425 CrossRef CAS PubMed.
  3. C. A. Staples, P. B. Dorn, G. M. Klecka, S. T. O'Block and L. R. Harris, Chemosphere, 1998, 36, 2149–2173 CrossRef CAS PubMed.
  4. T. Yamamoto, A. Yasuhara, H. Shiraishi and O. Nakasugi, Chemosphere, 2001, 42, 415–418 CrossRef CAS PubMed.
  5. L. N. Vandenberg, M. V. Maffini, C. Sonnenschein, B. S. Rubin and A. M. Soto, Endocr. Rev., 2009, 30, 75–95 CrossRef CAS PubMed.
  6. P. Wang, P. Xiao, S. zhong, J. Chen, H. Lin and X. Wu, J. Mater. Chem. A, 2016, 4, 15450–15456 CAS.
  7. Z. Zhang, H. Zhang, L. Zhu, Q. Zhang and W. Zhu, Chem. Eng. J., 2016, 283, 1273–1284 CrossRef CAS.
  8. L. Tang, Z. Xie, G. Zeng, H. Dong, C. Fan, Y. Zhou, J. Wang, Y. Deng, J. Wang and X. Wei, RSC Adv., 2016, 6, 25724–25732 RSC.
  9. C. Y. Kuo, Desalination, 2009, 249, 976–982 CrossRef CAS.
  10. D. Cortes-Arriagada, L. Sanhueza and M. Santander-Nelli, J. Mol. Model., 2013, 19, 3569–3580 CrossRef CAS PubMed.
  11. F. F. Liu, J. Zhao, S. Wang, P. Du and B. Xing, Environ. Sci. Technol., 2014, 48, 13197–13206 CrossRef CAS PubMed.
  12. Z. Jin, X. Wang, Y. Sun, Y. Ai and X. Wang, Environ. Sci. Technol., 2015, 49, 9168–9175 CrossRef CAS PubMed.
  13. Y. Dong, D. Wu, X. Chen and Y. Lin, J. Colloid Interface Sci., 2010, 348, 585–590 CrossRef CAS PubMed.
  14. S. Z. Li, Y. B. Gong, Y. C. Yang, C. He, L. L. Hu, L. F. Zhu, L. P. Sun and D. Shu, Chem. Eng. J., 2015, 260, 231–239 CrossRef CAS.
  15. X. J. Yang, P. F. Tian, C. X. Zhang, Y. Q. Deng, J. Xu, J. L. Gong and Y. F. Han, Appl. Catal., B, 2013, 134, 145–152 CrossRef.
  16. M. Umar, F. Roddick, L. Fan and H. A. Aziz, Chemosphere, 2013, 90, 2197–2207 CrossRef CAS PubMed.
  17. G. Li, Y. Lu, C. Lu, M. Zhu, C. Zhai, Y. Du and P. Yang, J. Hazard. Mater., 2015, 294, 201–208 CrossRef CAS PubMed.
  18. M. H. El-Naas, S. A. Al-Muhtaseb and S. Makhlouf, J. Hazard. Mater., 2009, 164, 720–725 CrossRef CAS PubMed.
  19. E. K. Putra, R. Pranowo, J. Sunarso, N. Indraswati and S. Ismadji, Water Res., 2009, 43, 2419–2430 CrossRef CAS PubMed.
  20. P. C. Chiang, E. E. Chang and J. S. Wu, Water Sci. Technol., 1997, 35, 279–285 CrossRef CAS.
  21. W. Chen, L. Duan, L. Wang and D. Zhu, Environ. Sci. Technol., 2008, 42, 6862–6868 CrossRef CAS PubMed.
  22. T. Asada, K. Oikawa, K. Kawata, S. Ishihara, T. Iyobe and A. Yamada, J. Health Sci., 2004, 50, 588–593 CrossRef CAS.
  23. J. C. Meyer, A. K. Geim, M. I. Katsnelson, K. S. Novoselov, T. J. Booth and S. Roth, Nature, 2007, 446, 60–63 CrossRef CAS PubMed.
  24. C. Lee, X. Wei, J. W. Kysar and J. Hone, Science, 2008, 321, 385–388 CrossRef CAS PubMed.
  25. H. Y. He, T. Riedl, A. Lerf and J. Klinowski, J. Phys. Chem., 1996, 100, 19954–19958 CrossRef CAS.
  26. S. Park and R. S. Ruoff, Nat. Nanotechnol., 2009, 4, 217–224 CrossRef CAS PubMed.
  27. Y. H. Zhang, Y. L. Tang, S. Y. Li and S. L. Yu, Chem. Eng. J., 2013, 222, 94–100 CrossRef CAS.
  28. S. Stankovich, D. A. Dikin, R. D. Piner, K. A. Kohlhaas, A. Kleinhammes, Y. Jia, Y. Wu, S. T. Nguyen and R. S. Ruoff, Carbon, 2007, 45, 1558–1565 CrossRef CAS.
  29. B. C. Qiu, Q. Y. Li, B. Shen, M. Y. Xing and J. L. Zhang, Appl. Catal., B, 2016, 183, 216–223 CrossRef CAS.
  30. J. Zhao, Z. Wang, J. C. White and B. Xing, Environ. Sci. Technol., 2014, 48, 9995–10009 CrossRef CAS PubMed.
  31. D. C. Marcano, D. V. Kosynkin, J. M. Berlin, A. Sinitskii, Z. Sun, A. Slesarev, L. B. Alemany, W. Lu and J. M. Tour, ACS Nano, 2010, 4, 4806–4814 CrossRef CAS PubMed.
  32. G. D. Sheng, Y. M. Li, X. Yang, X. M. Ren, S. T. Yang, J. Hu and X. K. Wang, RSC Adv., 2012, 2, 12400–12407 RSC.
  33. S. Guo, G. Zhang, Y. Guo and J. C. Yu, Carbon, 2013, 60, 437–444 CrossRef CAS.
  34. C. Sarkar, C. Bora and S. K. Dolui, Ind. Eng. Chem. Res., 2014, 53, 16148–16155 CrossRef CAS.
  35. X. Fan, W. Peng, Y. Li, X. Li, S. Wang, G. Zhang and F. Zhang, Adv. Mater., 2008, 20, 4490–4493 CrossRef CAS.
  36. V. Chandra, J. Park, Y. Chun, J. W. Lee, I. C. Hwang and K. S. Kim, ACS Nano, 2010, 4, 3979–3986 CrossRef CAS PubMed.
  37. A. C. Ferrari and D. M. Basko, Nat. Nanotechnol., 2013, 8, 235–246 CrossRef CAS PubMed.
  38. W. F. Zhao, M. Fang, F. R. Wu, H. Wu, L. W. Wang and G. H. Chen, J. Mater. Chem., 2010, 20, 5817–5819 RSC.
  39. J. I. Paredes, S. Villar-Rodil, P. Solis-Fernandez, A. Martinez-Alonso and J. M. Tascon, Langmuir, 2009, 25, 5957–5968 CrossRef CAS PubMed.
  40. J. Lu, X. L. Jiao, D. R. Chen and W. Li, J. Phys. Chem. C, 2009, 113, 4012–4017 CAS.
  41. S. Stankovich, D. A. Dikin, G. H. Dommett, K. M. Kohlhaas, E. J. Zimney, E. A. Stach, R. D. Piner, S. T. Nguyen and R. S. Ruoff, Nature, 2006, 442, 282–286 CrossRef CAS PubMed.
  42. L. M. Cui, Y. G. Wang, L. Gao, L. H. Hu, L. G. Yan, Q. Wei and B. Du, Chem. Eng. J., 2015, 281, 1–10 CrossRef CAS.
  43. L. Ai, C. Zhang and Z. Chen, J. Hazard. Mater., 2011, 192, 1515–1524 CrossRef CAS PubMed.
  44. Y. S. Ho and G. McKay, Process Biochem., 1999, 34, 451–465 CrossRef CAS.
  45. Y. S. Ho, J. Hazard. Mater., 2006, 136, 681–689 CrossRef CAS PubMed.
  46. G. X. Zhao, J. X. Li and X. K. Wang, Chem. Eng. J., 2011, 173, 185–190 CrossRef CAS.
  47. K. Ouyang, C. H. Zhu, Y. Zhao, L. C. Wang, S. Xie and Q. Wang, Appl. Surf. Sci., 2015, 355, 562–569 CrossRef CAS.
  48. A. L. Cazetta, A. C. Martins, O. Pezoti, K. C. Bedin, K. K. Beltrame, T. Asefa and V. C. Almeida, Chem. Eng. J., 2016, 300, 54–63 CrossRef CAS.
  49. S. L. Zheng, Z. M. Sun, Y. Park, G. A. Ayoko and R. L. Frost, Chem. Eng. J., 2013, 234, 416–422 CrossRef CAS.
  50. W. T. Tsai, C. W. Lai and T. Y. Su, J. Hazard. Mater., 2006, 134, 169–175 CrossRef CAS PubMed.
  51. I. Langmuir, J. Am. Chem. Soc., 1916, 38, 2221–2295 CrossRef CAS.
  52. H. Freundlich, J. Phys. Chem., 1906, 57, 1100–1107 Search PubMed.
  53. F. Cao, P. Bai, H. Li, Y. Ma, X. Deng and C. Zhao, J. Hazard. Mater., 2009, 162, 791–798 CrossRef CAS PubMed.
  54. A. Alsbaiee, B. J. Smith, L. Xiao, Y. Ling, D. E. Helbling and W. R. Dichtel, Nature, 2016, 529, 190–194 CrossRef CAS PubMed.
  55. S. Y. Zeng, S. X. Duan, R. F. Tang, L. Li, C. H. Liu and D. Z. Sun, Chem. Eng. J., 2014, 258, 218–228 CrossRef CAS.
  56. I. Bautista-Toledo, M. A. Ferro-Garcia, J. Rivera-Utrilla, C. Moreno-Castilla and F. J. Vegas Fernandez, Environ. Sci. Technol., 2005, 39, 6246–6250 CrossRef CAS PubMed.
  57. B. Pan and B. Xing, Environ. Sci. Technol., 2008, 42, 9005–9013 CrossRef CAS PubMed.

Footnote

Electronic supplementary information (ESI) available. See DOI: 10.1039/c6ra23542e

This journal is © The Royal Society of Chemistry 2016
Click here to see how this site uses Cookies. View our privacy policy here.