DOI:
10.1039/C6RA23510G
(Paper)
RSC Adv., 2016,
6, 107507-107518
Nanocomposite membranes of sulfonated poly(phthalalizinone ether ketone)–sulfonated graphite nanofibers as electrolytes for direct methanol fuel cells†
Received
21st September 2016
, Accepted 24th October 2016
First published on 26th October 2016
Abstract
Polymer nanocomposite membranes are prepared by the dispersion of sulfonated graphite nanofibers (SGNF) in the sulfonated poly(phthalazinone ether ketone) (SPPEK) matrix. GNF are first functionalized with 4-benzene sulfonic acid, and the presence of sulfonic acid groups in GNF is confirmed by FT-IR and elemental analysis. The GNF morphology after functionalization is analysed via SEM and TEM. Nanocomposite membranes are then prepared by varying the content of SGNF in SPPEK using the solvent cast technique and characterized for their physico-chemical properties in terms of mechanical, thermal and dimensional stability, water sorption, proton and electrical conductivity along with methanol permeability. Improved mechanical stability for the nanocomposite membranes is observed due to interfacial interactions and good compatibility between SGNF and SPPEK. The nanocomposite membranes exhibit improved electrochemical selectivity, which in turn enhances the overall DMFC power output. The DMFC performance of the nanocomposite membrane is higher than pristine SPPEK and is on par with the Nafion-117 membrane. The stability of the nanocomposite membranes is examined by operating membrane electrode assemblies (MEAs) in the open circuit voltage (OCV) condition for 50 h. In addition, the stability of the composite membranes is also confirmed by measuring the methanol crossover current density using linear sweep voltammetry (LSV) for MEAs comprising these membranes before and after an OCV test.
1. Introduction
Polymer electrolyte membranes (PEM) are the key component in various energy storage and conversion devices such as fuel cells, solar cells, supercapacitors and electrolyzers. There are vast research efforts to develop polymer electrolyte membranes suited to various fuel cell applications related to the transport and stationary sectors.1,2 Direct methanol fuel cells (DMFCs) are unique and advantageous when applied to portable applications due to the easily available liquid fuel. Storage and humidification issues do not exist in DMFC, unlike hydrogen based fuel cells. High proton conductivity, low methanol permeability along with virtuous mechanical and thermal stability are essential for a membrane electrolyte when applied in DMFCs.3 Nafion® is the most commonly used PEM for DMFCs due to its remarkable proton conductivity and mechanical stability.4 However certain drawbacks of Nafion®, such as high methanol permeation through its ionic clusters, hinder its viability in DMFCs.5 In this context, research efforts have been extensive to design alternative polymer electrolyte membranes (PEMs) based on polyether ketones, polyimides, polyether sulfones, and copolymers such as sulfonated poly(phthalazinone ether ketones/sulfones).6–9
Among all the alternative polymers, sulfonated poly(phthalazinone ether ketone) (SPPEK) is one of the suitable materials as a PEM due to its excellent chemical, mechanical, and thermal stabilities and its proton conductivity which is tuned by the degree of sulfonation.9–12 In addition, the nitrogen moiety present in SPPEK also helps in developing acid–base interactions, which lead to facile proton transport. However, besides these benefits, high swelling and methanol crossover in DMFCs of SPPEK at a high degree of sulfonation are the major drawbacks. Hence, literature reports suggest the use of stabilized composite membranes using inorganic materials, such as silica and zirconium phosphate, as additives in the SPPEK matrix.13,14 For instance, Y. H. Su et al. fabricated nanocomposite membranes of SPPEK by doping silica nanoparticles, and explored them as PEM in DMFCs. The composite membrane showed good mechanical properties and stability in methanol, however ionic conductivity was not increased due to the decreased density of sulfonic acid groups in the membrane, which affects selectivity. In continuation, functionalized materials were used as additives in SPPEK and membranes were fabricated with sulfonated silica by the same research group.15 The interactions between the sulfonic acid groups of the additive and host polymer matrix lead to improved proton conductivity, which was not the case when unsulfonated silica was used as the additive.
Recent literature reports suggest that functionalized carbon nanomaterials are proven additives in polymer electrolyte membranes (PEMs) due to their superior mechanical, thermal and structural properties along with their methanol impermeable characteristics in DMFCs.6,16–18 Jiang et al. reported the functionalization of GO with sodium dodecylbenzene sulfonic acid (SDBS) and its impact on sulfonated polyether ether ketone (SPEEK) as an electrolyte in DMFCs. SDBS–GO improves the mechanical strength, IEC and proton conductivity and controls the methanol permeability in SPEEK.6 Swati Gahlot et al. reported the functionalization of GO with chlorosulfonic acid and its effect as an additive in the sulfonated poly(ether sulfone) matrix, wherein an improved bound water content in the membranes was observed which enhanced proton transport.8 Swati Gahlot et al. also used electrically aligned functionalized CNTs to prepare composite membranes of SPEEK for DMFCs. Composite membranes with electrically aligned CNTs show a better performance in terms of proton conductivity and methanol permeability when compared with randomly aligned functionalized CNTs.19 Yusun Heo et al. prepared composite membranes of sulfonated poly(ether imide) with sulfonated CNTs, wherein thionyl chloride was used to sulfonate CNTs. Functionalized CNTs control methanol crossover and improve the mechanical stability, water uptake and proton conductivity of the membranes when used as an additive.20 Depending on the functionalization routes and their structure, these additives impact the properties of PEM in terms of methanol permeability, proton conductivity, and mechanical stability. Our recent studies revealed the effect of functionalized CNTs and fullerene in SPEEK, wherein CNTs and fullerene were functionalized with poly(styrene sulfonic acid) (PSSA) and 4-benzene sulfonic acid, respectively, and incorporated in the SPEEK matrix to study its effect as a composite electrolyte in DMFCs. PSSA–CNT and sulfonated fullerene in relation to SPEEK show peak power densities of 93 mW cm−2 and 103 mW cm−2, respectively.21,22
Considering the advantages of the structural features of carbon nanomaterials, in the present study, we report graphite nanofibers (GNF) functionalized with 4-benzene sulfonic acid and incorporated in SPPEK to form a nanocomposite polymer electrolyte, and its impact in DMFCs is studied. GNF have been explored earlier in the literature as a durable catalyst support for fuel cell electrodes due to their high thermal and mechanical strength, and high stability in acidic condition. In addition to this, different functionalization routes have been adopted for GNF to improve their properties in terms of catalyst support.23,24 However the advantages of GNF have not been explored as additive in the literature to form nanocomposite polymer electrolytes and hence it is worth investigating the effect of GNF on membrane electrolytes for DMFCs. The nanocomposite membranes prepared from SPPEK–SGNF show improved mechanical stability, proton conductivity and reduced methanol permeability due to the surface functional groups of GNFs, contributing towards enhanced DMFC performance.
2. Experimental
2.1 Materials
Graphite nanofibers (outer diameter of 200–500 nm and length of 10–40 μm) were obtained from Sigma Aldrich. Sulfanilic acid was obtained from Acros Organics India. Sodium nitrite, hypophosphorous acid and dimethyl acetamide (DMAc) were obtained from SRL Chemicals India. Sulfonated poly(phthalazinone ether ketone) (IEC = 1.42 meq. g−1, equivalent weight = 710 g eq.−1 and DS 52%) was obtained from FuMA-Tech GmbH, Germany.
2.2 Functionalization of GNF and preparation of nanocomposite membranes
GNF were functionalized with 4-benzene sulfonic acid according to a similar procedure as that reported for fullerene in our previous reports.22 In brief, the 4-benzene diazonium sulfonate precursor was initially formed through the diazotization of sulfanilic acid. The GNF were treated with the above prepared precursor in the presence of ethanol and hypophosphorous acid at 0–5 °C to obtain SGNF. The required amount (0.5–1 wt% in relation to SPPEK) of SGNF was dispersed in DMAc through ultra-sonication for 30 min and then added to 5 wt% of SPPEK solution, which was prepared by dissolving 1 g of SPPEK in 20 mL of DMAc. The resultant black solution was further sonicated for 1 h and stirred for 12 h, then cast on a Plexiglas plate and dried in a vacuum oven at 80 °C for 12 h. The formed membrane was peeled off from the glass plate and repeatedly washed, and then stored in water for further studies. The pristine SPPEK was prepared in a similar manner as above without the addition of GNF.
2.3 Characterization of GNF and SGNF
The presence of surface functional groups in SGNF was confirmed by Fourier transform infrared spectroscopy (FT-IR) using a Nicolet IR 860 spectrometer (Thermo Nicolet Nexus-670). Various elements in the samples were confirmed by carrying out elemental analysis (CHNS) on an Elementar Vario EL 111, Germany. The morphologies of GNF and SGNF were analyzed via high resolution scanning electron microscopy (HR-SEM) (FEI Quanta FEG 200). TEM images of GNF and SGNF were recorded on a 200 kV Tecnai-20 G2 transmission electron microscope (TEM) at a 50 nm scale to study the morphology of the samples.
2.4 Physico-chemical characterization
Mechanical properties were analyzed via a universal testing machine (UTM) (Model AGS-J, Shimadzu, Japan) with an operating head-load of 10 kN. The tensile strength of the membranes was determined considering the maximum load applied in relation to the cross-sectional area. The morphological changes for pristine SPPEK and the nanocomposite membranes of SPEEK–SGNF were analyzed via field emission scanning electron microscopy (FE-SEM) (Zeiss Ultra FE-SEM, Germany). Atomic force microscopy (AFM) analysis was done for the membranes in the tapping mode using a PicoSPM-Picoscan 2100, Molecular Imaging, USA. Thermo-gravimetric analysis (TGA) of pristine SPPEK and the SPPEK–SGNF (0.5 wt%) membranes was performed using a NETZSCH STA 449F3 TGA-DSC instrument in the temperature range of 30–1000 °C at a heating rate of 5 °C min−1 with a nitrogen flow of 60 mL min−1.
The ion exchange capacity of the membranes was determined using acid–base titration. Briefly, the membrane samples were weighed before dipping in a saturated sodium chloride solution for the complete exchange of H+ ions in the membrane with Na+ ions in the solution, and then the solution was titrated against a sodium hydroxide solution using phenolphthalein as the indicator. The IEC values were calculated using the following relation.25,26
| |
 | (1) |
Water sorption was determined as reported in our earlier reports.25 In brief, the membrane samples were dried in a vacuum oven at 60 °C for the complete removal of moisture, and then weighed. Then membrane samples were then transferred into a sorption cell containing deionized water and kept for equilibration until the sorption reached a steady state for 24 h. The weight of the equilibrated membrane samples was noted. Sorption was calculated using the following equation. Triplicate measurements were done for the reproducible values and their error limits are given in Table 2.
| |
 | (2) |
The dimensional stability of the membranes was determined by measuring the volume difference for the membranes in dry and wet conditions. In brief, the volume of the dry membrane sample was determined by considering its length, width and thickness and then the membrane sample was equilibrated in deionized water, as mentioned above, and the sorbed volume (volume in wet condition) was measured. The dimensional change was calculated using the following equation.19
| |
 | (3) |
where,
Vwet and
Vdry are the volume of the membrane sample in the wet and dry condition, respectively.
2.5 Proton and electrical conductivity
The proton conductivity of all the membranes was measured from 30 (room temperature)–80 °C using the four probe AC impedance method. The membrane sample was placed in a BekkTech conductivity cell (BT-115) comprised of four platinum probes (two voltage probes and two current probes) and the cell was kept in an environmental humidity chamber (ESPEC SH-242) and maintained at 95% RH. Impedance was measured using a single channel potentiostat (Biologic SP-150). The proton conductivity of the membranes can be calculated from the resistivity value calculated by considering the thickness and width of the membrane.| |
 | (4) |
where R is the resistance obtained from the real axis of the impedance spectra, d is the probe distance (0.425 cm) in the conductivity cell, and T, and W are the thickness and width of the membrane, respectively.| |
 | (5) |
Triplicate measurements were performed for all the membranes and the values are within the error limit of 3%.
The electrical conductivity of the membranes was measured using a four probe DC Keithley electrometer, wherein the membrane sample was kept in contact with the four probes. Electrical conductivity was calculated by considering the thickness and surface area of the membrane.19
2.6 Methanol permeability
The methanol permeability of the membranes was analysed at 30 °C and 60 °C using an in-house diffusion cell made of Teflon. The cell was placed on a magnetic stirrer prior to filling one compartment with deionized water and the other with 2 M methanol separated by the membrane to be tested for methanol permeability. Due to the concentration difference of methanol in the two compartments, methanol passes to the water compartment through the membrane and the concentration of methanol in both compartments was measured at a particular time interval (1 h) using gas chromatography (Trace GC-700, Thermo Scientific instrument) fitted with a capillary column and flame ionization detector (FID). The slope of the concentration profile (k2) (plot of concentration vs. time) was noted and the methanol permeability was calculated using the following equation.22| |
 | (6) |
where, P is the methanol permeability (cm2 s−1), V2 is the volume of the solution in the water compartment, L and A are the thickness and area of the test membrane, respectively, and C1 and C2 are the concentrations of methanol in the methanol and water compartment, respectively.
The electrochemical selectivity of different membranes is defined as the ratio of proton conductivity and methanol permeability, which is calculated from the following relation.
| |
 | (7) |
2.7 DMFC polarization studies
Pristine SPPEK and its composite based membrane electrode assemblies were fabricated. In brief, membranes were hot pressed between the anode (Pt–Ru/C, 2 mg cm−2, Alfa Aesar, Johnson Matthey) and cathode (Pt/C, 2 mg cm−2, Alfa Aesar, Johnson Matthey) by applying a pressure of 20 kg cm−2 at 80 °C for 2 min. The prepared MEAs were tested in a single cell (Fuel Cell Technology, USA) using an electronic load (Model-LCN4-25-24/LCN 50-24 from Bitrode Instruments, USA) by passing 2 M methanol (2 mL min−1) at the anode and oxygen (300 mL min−1) at the cathode and measuring the cell potential as a function of current density in the galvanostatic mode. The MEAs comprised of pristine SPPEK and SPPEK–SGNF (0.5 wt%) were subjected to stability tests and compared with Nafion®-117. The test was performed in the OCV condition at 60 °C for 50 h by recording the OCV as a function of time.
2.8 Linear sweep voltammetry studies
MEAs compromised of pristine SPPEK and SPPEK–SGNF nanocomposite membranes along with Nafion®-117 were fabricated as described above. The single cell assembly was subjected to linear sweep voltammetry (LSV) studies,27,28 wherein 2 M methanol was passed at the anode and nitrogen (200 mL min−1) at the cathode. In this mode, the anode acts as the reference while the cathode act as the working electrode, and methanol gets oxidized at the cathode by crossover from the anode to cathode. The methanol oxidation current is directly proportional to the quantity of methanol crossover from the anode to cathode. The experiments were carried out in the range of 0–0.9 V with a scan rate of 50 mV s−1 using a potentiostat (VMP3B-20, Biologic Science Instruments). The same cell was subjected to an OCV test and after OCV stability for 50 h, the cell was again tested for methanol crossover current using similar protocols to that mentioned above.
3. Results and discussion
Dispersion of pristine GNF in the SPPEK matrix is poor due to the lack of functional groups in GNF, and hence they are functionalized with 4-benzene sulfonic acid before dispersion in the SPPEK matrix. The functionalization procedure is schematically represented as a ball–stick model in Scheme 1. Fig. S1 (ESI†) shows the dispersion of GNF and SGNF in water. The dispersion of pristine GNF is poor and they settle at the bottom, whereas SGNF form a stable dispersion and even after 30 days of monitoring, no agglomeration of SGNF particles in the aqueous medium in seen due to the interactions between the functional groups of SGNF and water through hydrogen bonding. FT-IR spectra of GNF and SGNF were obtained to observe the surface functional groups on SGNF, as shown in Fig. 1. In the spectra of SGNF, the two characteristic peaks at 1090 and 1225 cm−1 are attributed to the symmetric and asymmetric vibrations of O![[double bond, length as m-dash]](https://www.rsc.org/images/entities/char_e001.gif) SO from the sulfonic acid group, respectively. In addition, SGNF show bands at 1585 and 780 cm−1, which are attributed to the CC stretching in the benzene ring and the band at 1380 cm−1 represents C–S stretching and O–H bending.29 The elemental analysis of GNF and SGNF in Table 1 shows 2.5% of sulphur and an increased hydrogen content in comparison with pristine GNF, which confirms the functionalization of GNF.
SO from the sulfonic acid group, respectively. In addition, SGNF show bands at 1585 and 780 cm−1, which are attributed to the CC stretching in the benzene ring and the band at 1380 cm−1 represents C–S stretching and O–H bending.29 The elemental analysis of GNF and SGNF in Table 1 shows 2.5% of sulphur and an increased hydrogen content in comparison with pristine GNF, which confirms the functionalization of GNF.
 |
| | Scheme 1 Schematic of the sulfonation of GNF. | |
 |
| | Fig. 1 FT-IR spectra of GNF and SGNF. | |
Table 1 Elemental analysis for GNF and sulfonated GNF
| Element (%) |
GNF |
SGNF |
| C |
98.57 |
88.24 |
| H |
0.00 |
3.49 |
| N |
0.18 |
0.06 |
| S |
0.07 |
2.55 |
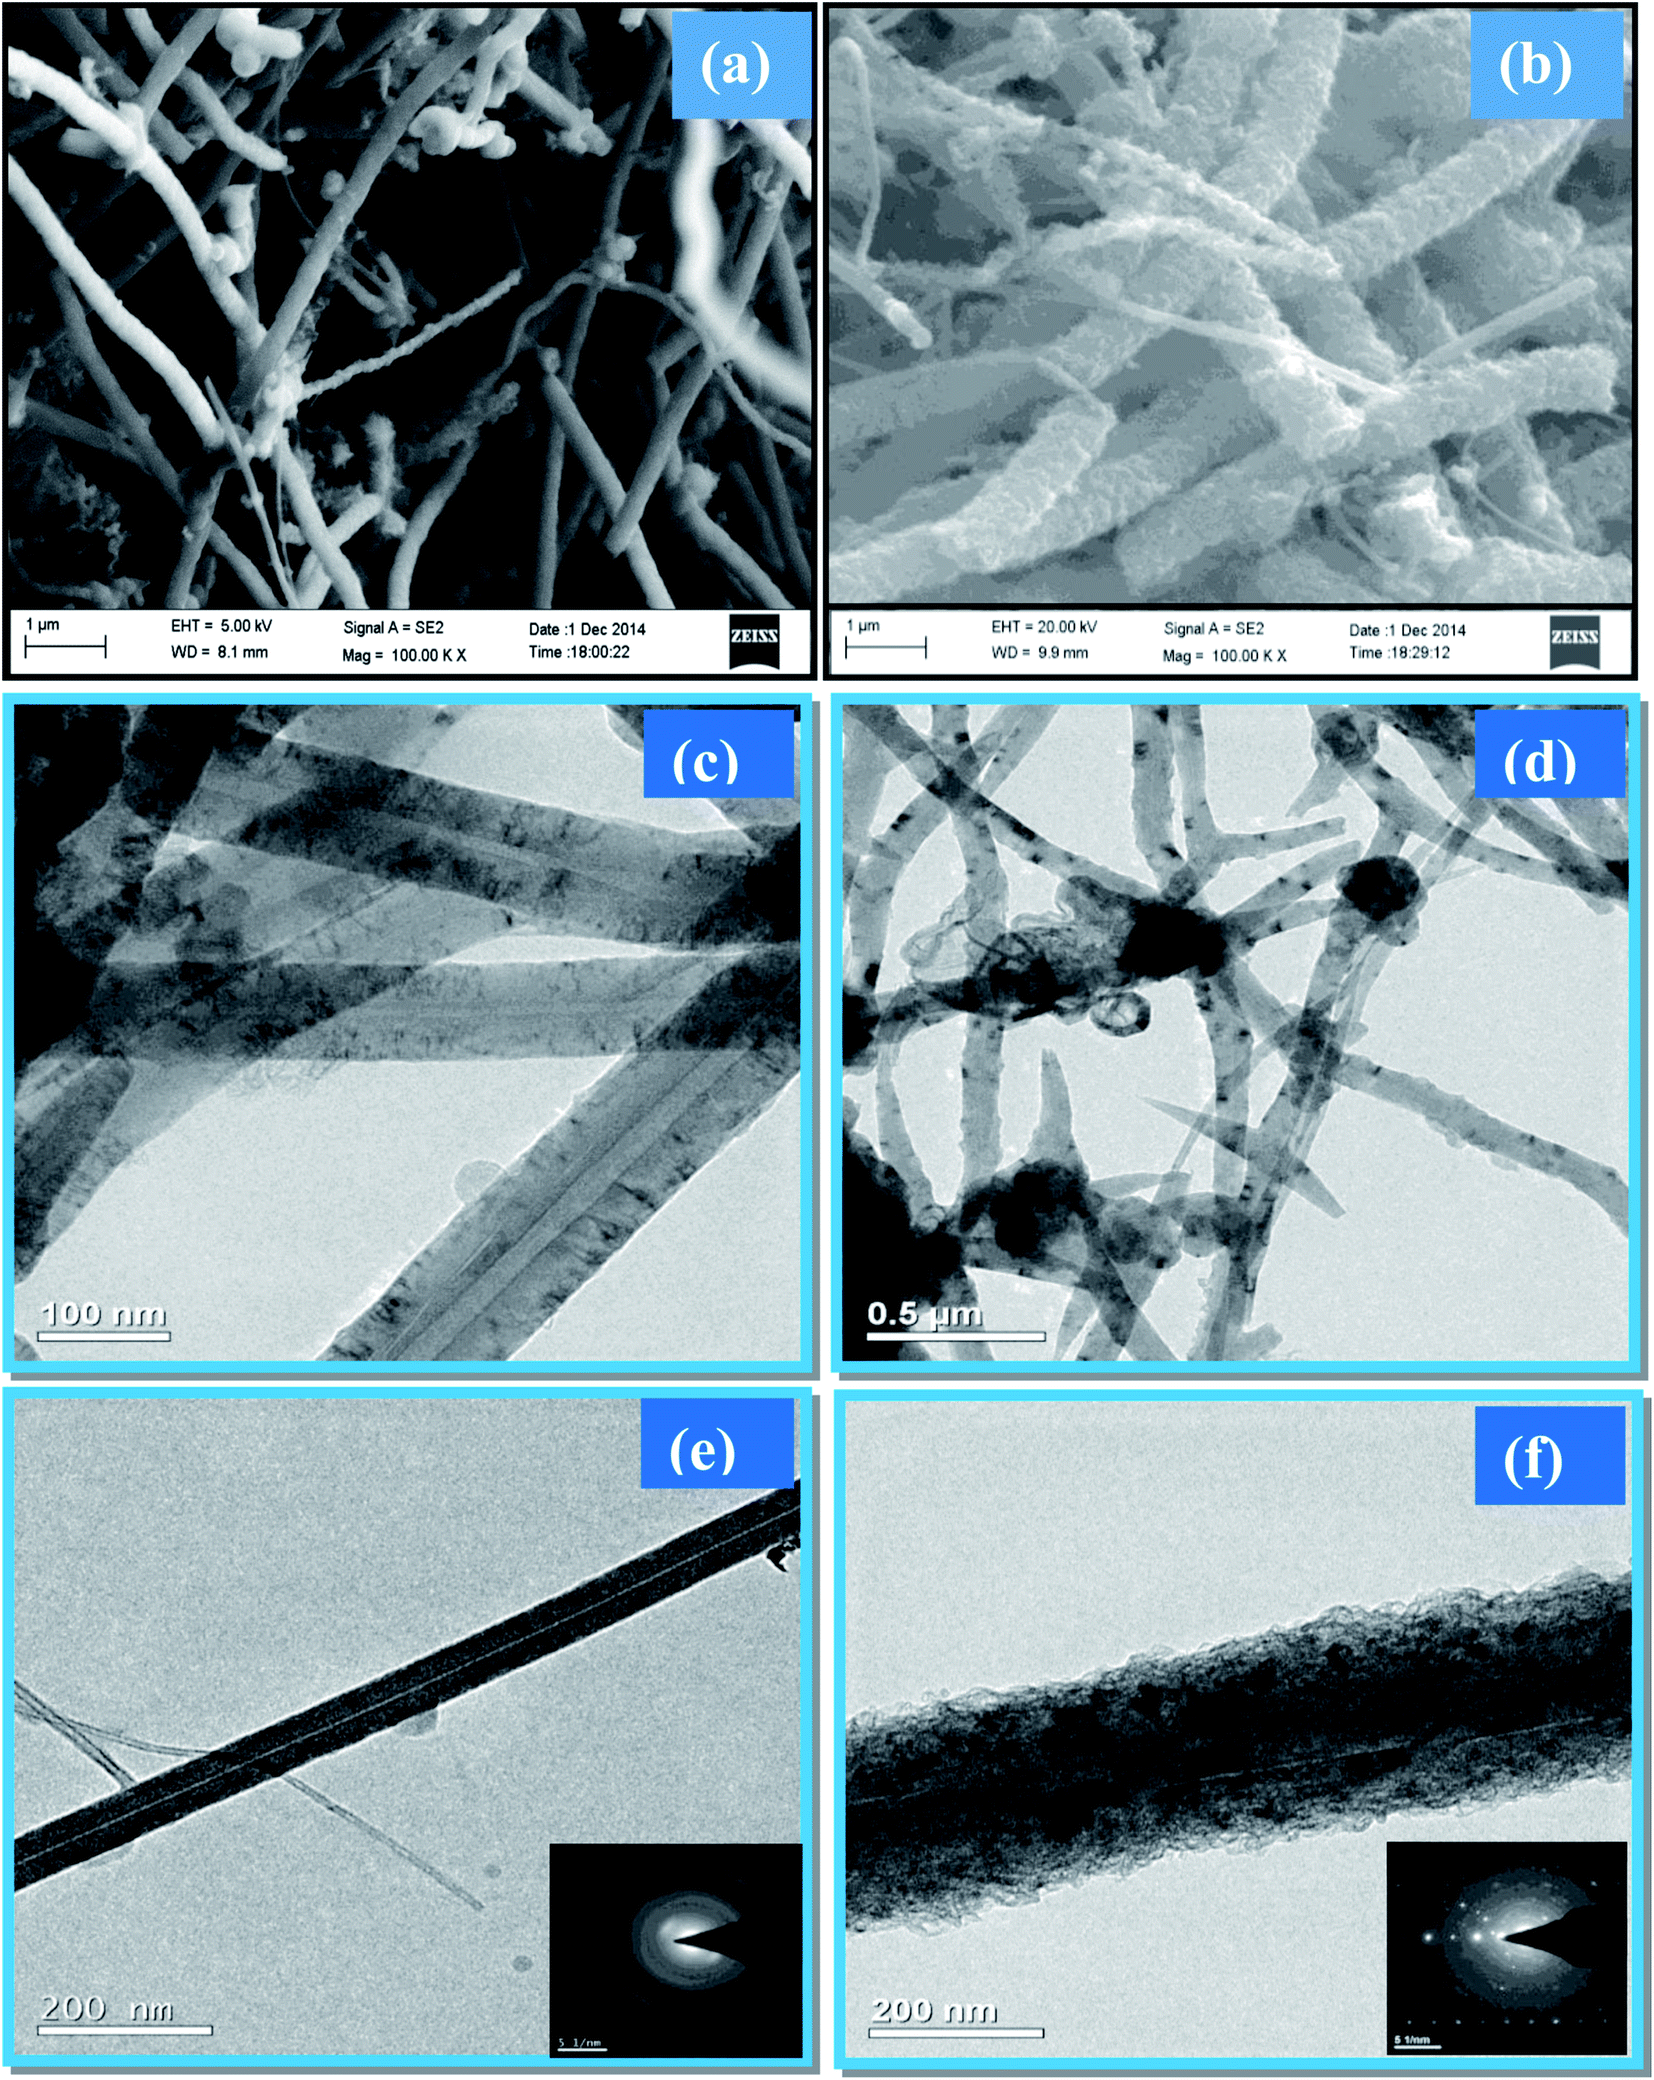
Fig. 2(a) and (b) show the HR-SEM morphology of GNF and SGNF. It is noted that the functionalized GNF (Fig. 2(b)) are partially unwrapped on the outer surface and form a layer like structure and create defects on the surface due to the electrostatic repulsions introduced by the sulfonic acid groups,30 whereas pristine GNF (Fig. 2(a)) exhibits a smooth fibrous morphology. This is further supported by the TEM analysis (Fig. 2(c)–(f)) at different magnifications, wherein completely open fibers are not observed. Instead there is partial opening of the outer layers during the sulfonation of GNF (Fig. 2(d) and (f)). This is also seen in our earlier studies, wherein GNF form wrinkled graphene sheets when functionalized with nitrogen and fluorine due to the electronegativity difference between C, N, and F.23 Further, the SAED patterns of GNF and SGNF show a ring pattern, which suggests their crystalline structure, however the bright spots seen in SGNF suggest a structural change in GNF with sulfonation.31 This partial opening of the outer layers in GNF contributes to better distribution of the additive in the polymer matrix to form a composite.
 |
| | Fig. 2 HR-SEM images showing the morphologies of (a) GNF and (b) SGNF; and TEM images showing the morphologies of (c and e) GNF and (d and f) SGNF. | |
3.1 Physico-chemical characterization of the membranes
3.1.1 Mechanical and thermal stability of the membranes. Photographs of the prepared pristine SPPEK and SPPEK–SNF composite membranes are presented in Fig. S2 (ESI†). The mechanical strength of the pristine SPPEK and SPPEK–SGNF nanocomposites are shown in Table 1. The addition of SGNF in the SPPEK matrix improves its mechanical stability due to the intrinsic mechanical strength of SGNF and the interfacial interactions between the sulfonic acid groups of SGNF and the sulfonic acid groups of SPPEK. The nitrogen moiety in SPPEK also provides adhesion between the host matrix and additive, which improves the mechanical strength of the nanocomposites.29 On the other hand, elongation of the nanocomposite membranes is reduced compared to pristine SPPEK due to the rigidity induced by SGNF.Fig. 3 shows the TG analysis for pristine SPPEK and the SPPEK–SGNF (0.5 wt%) composite membranes. From this figure, it can be seen that pristine SPPEK shows three stages of weight loss. The first stage weight loss from 30–150 °C corresponds to the loss of physically adsorbed water molecules, the second stage weight loss occurring at around 300 °C is due to the loss of sulfonic acid groups and the third stage weight loss from 460 °C is due to the degradation of the aromatic chain of the polymer.9 The composite membranes also show similar degradation profiles with the same onset degradation temperatures, which indicates that the incorporation of SGNF in SPPEK does not alter its thermal properties since the loading of SGNF is very minimal at 0.5 wt% in relation to the SPPEK polymer. In the third stage degradation, the SPPEK–SGNF composite membrane shows much higher weight loss than pristine SPPEK, which may be due to the degradation of SGNF in the SPPEK–SGNF membrane. It is noteworthy from Fig. 3, that the SGNF are thermally stable and degradation is observed after 700 °C in a nitrogen atmosphere, and similar degradation is observed in our earlier report on graphene nanoribbons (GNRs).32 The GNF degradation temperature is high in nitrogen atmosphere when compared to other oxidative environments. Degradation is much faster for fiber structures in oxidative environments, as seen in the earlier literature.33
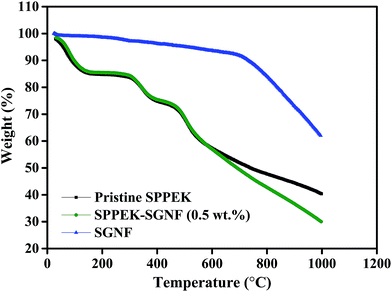 |
| | Fig. 3 TGA for SGNF, pristine SPPEK and SPPEK–SGNF (0.5 wt%). | |
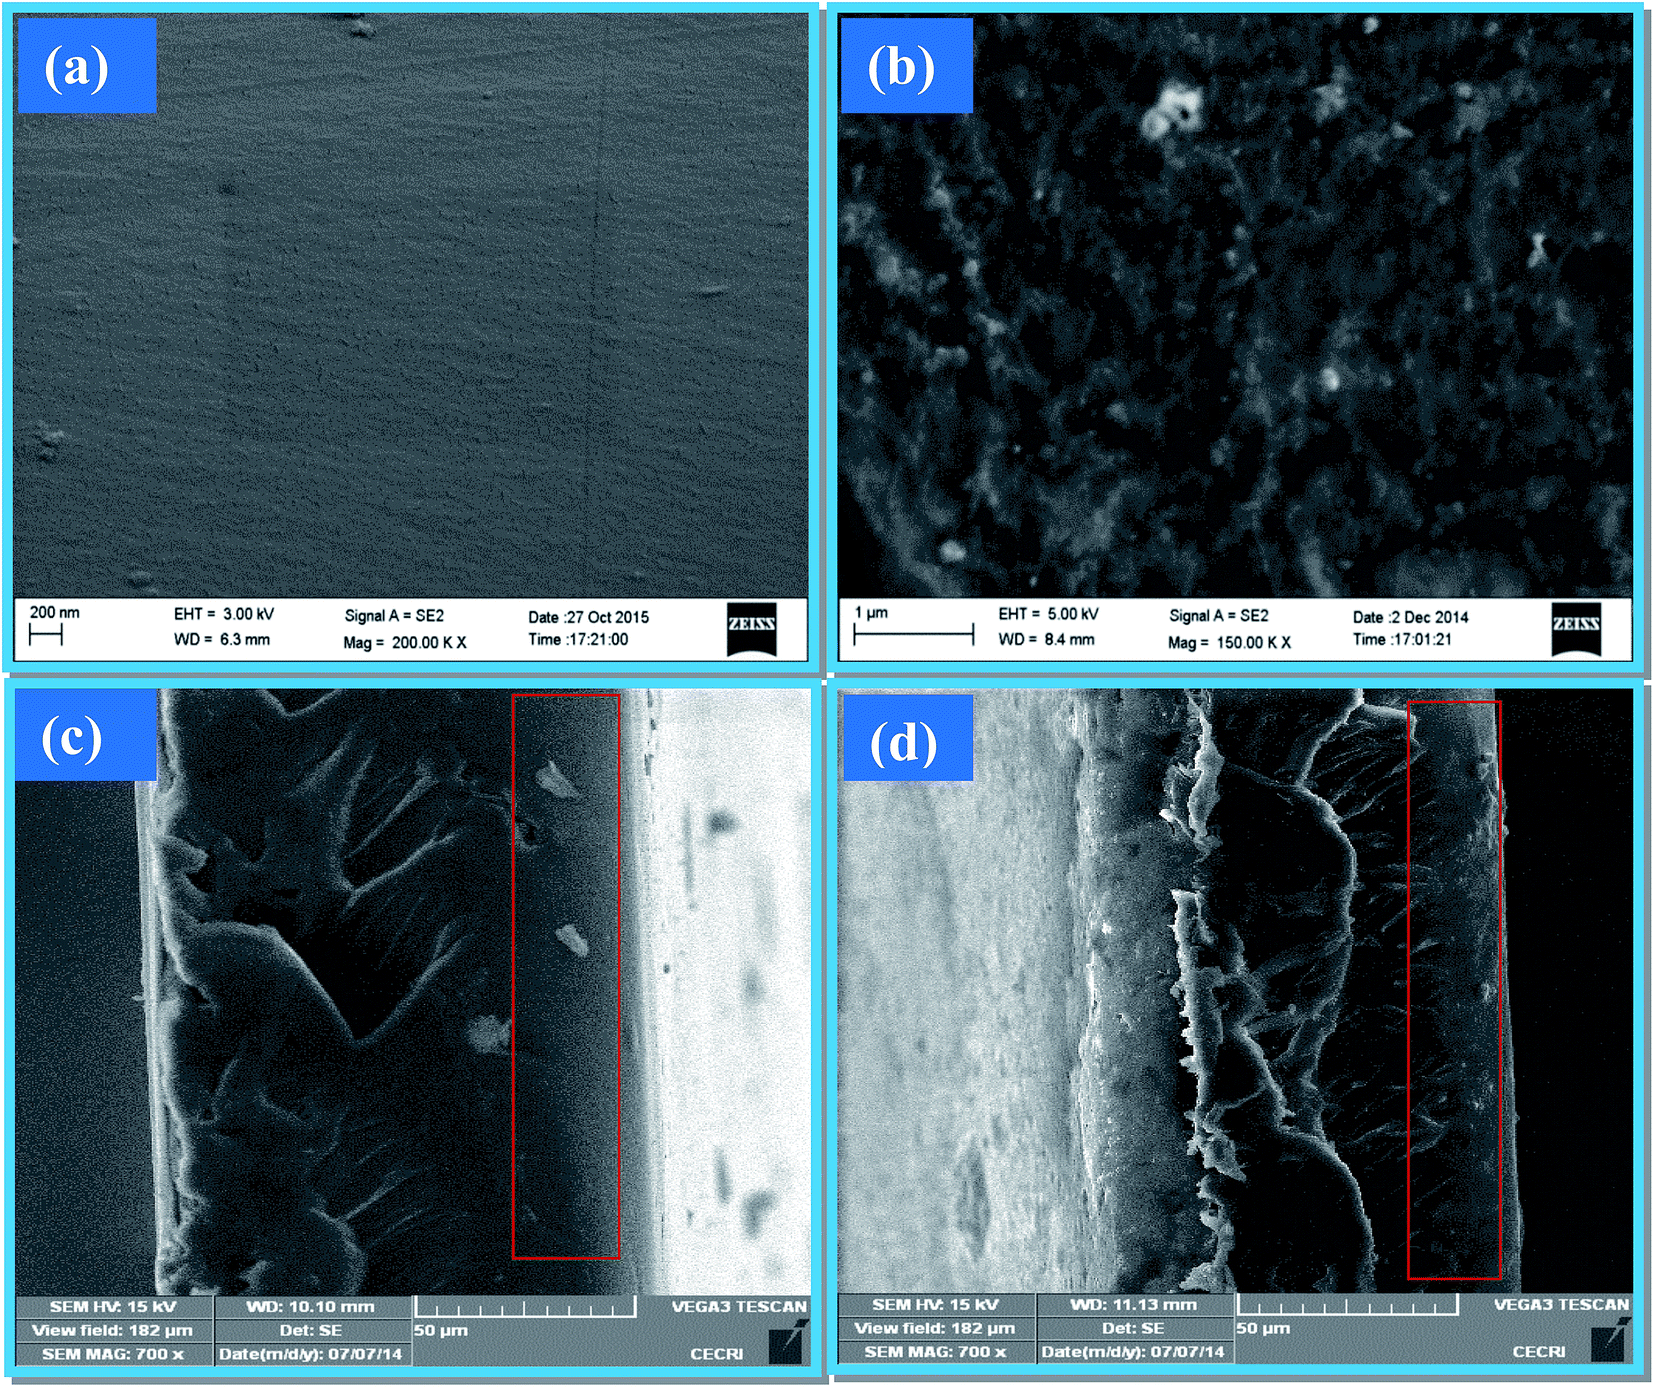
3.1.2 Morphology of the membranes. Fig. 4(a)–(d) show the surface and cross-sectional SEM morphologies for pristine SPPEK and the SPPEK–SGNF (0.5 wt%) nanocomposite membranes, wherein from the surface morphology, it is seen that the SGNF are distributed uniformly in the SPPEK matrix (Fig. 4(b)) in comparison to the smooth morphology observed for pristine SPPEK (Fig. 4(a)). From the cross-sectional morphology for SPPEK (Fig. 4(c)) and SPPEK–SGNF (Fig. 4(d)), it is inferred that the nanocomposite membrane shows a dense structure without any micropores and SGNF are embedded in the SPPEK matrix (marked region of Fig. 4(d)) due to the interfacial interactions between SGNF and SPPEK.
 |
| | Fig. 4 Surface and cross-sectional SEM images of (a and c) pristine SPPEK and (b and d) the SPPEK–SGNF (0.5 wt%) composite membrane. | |
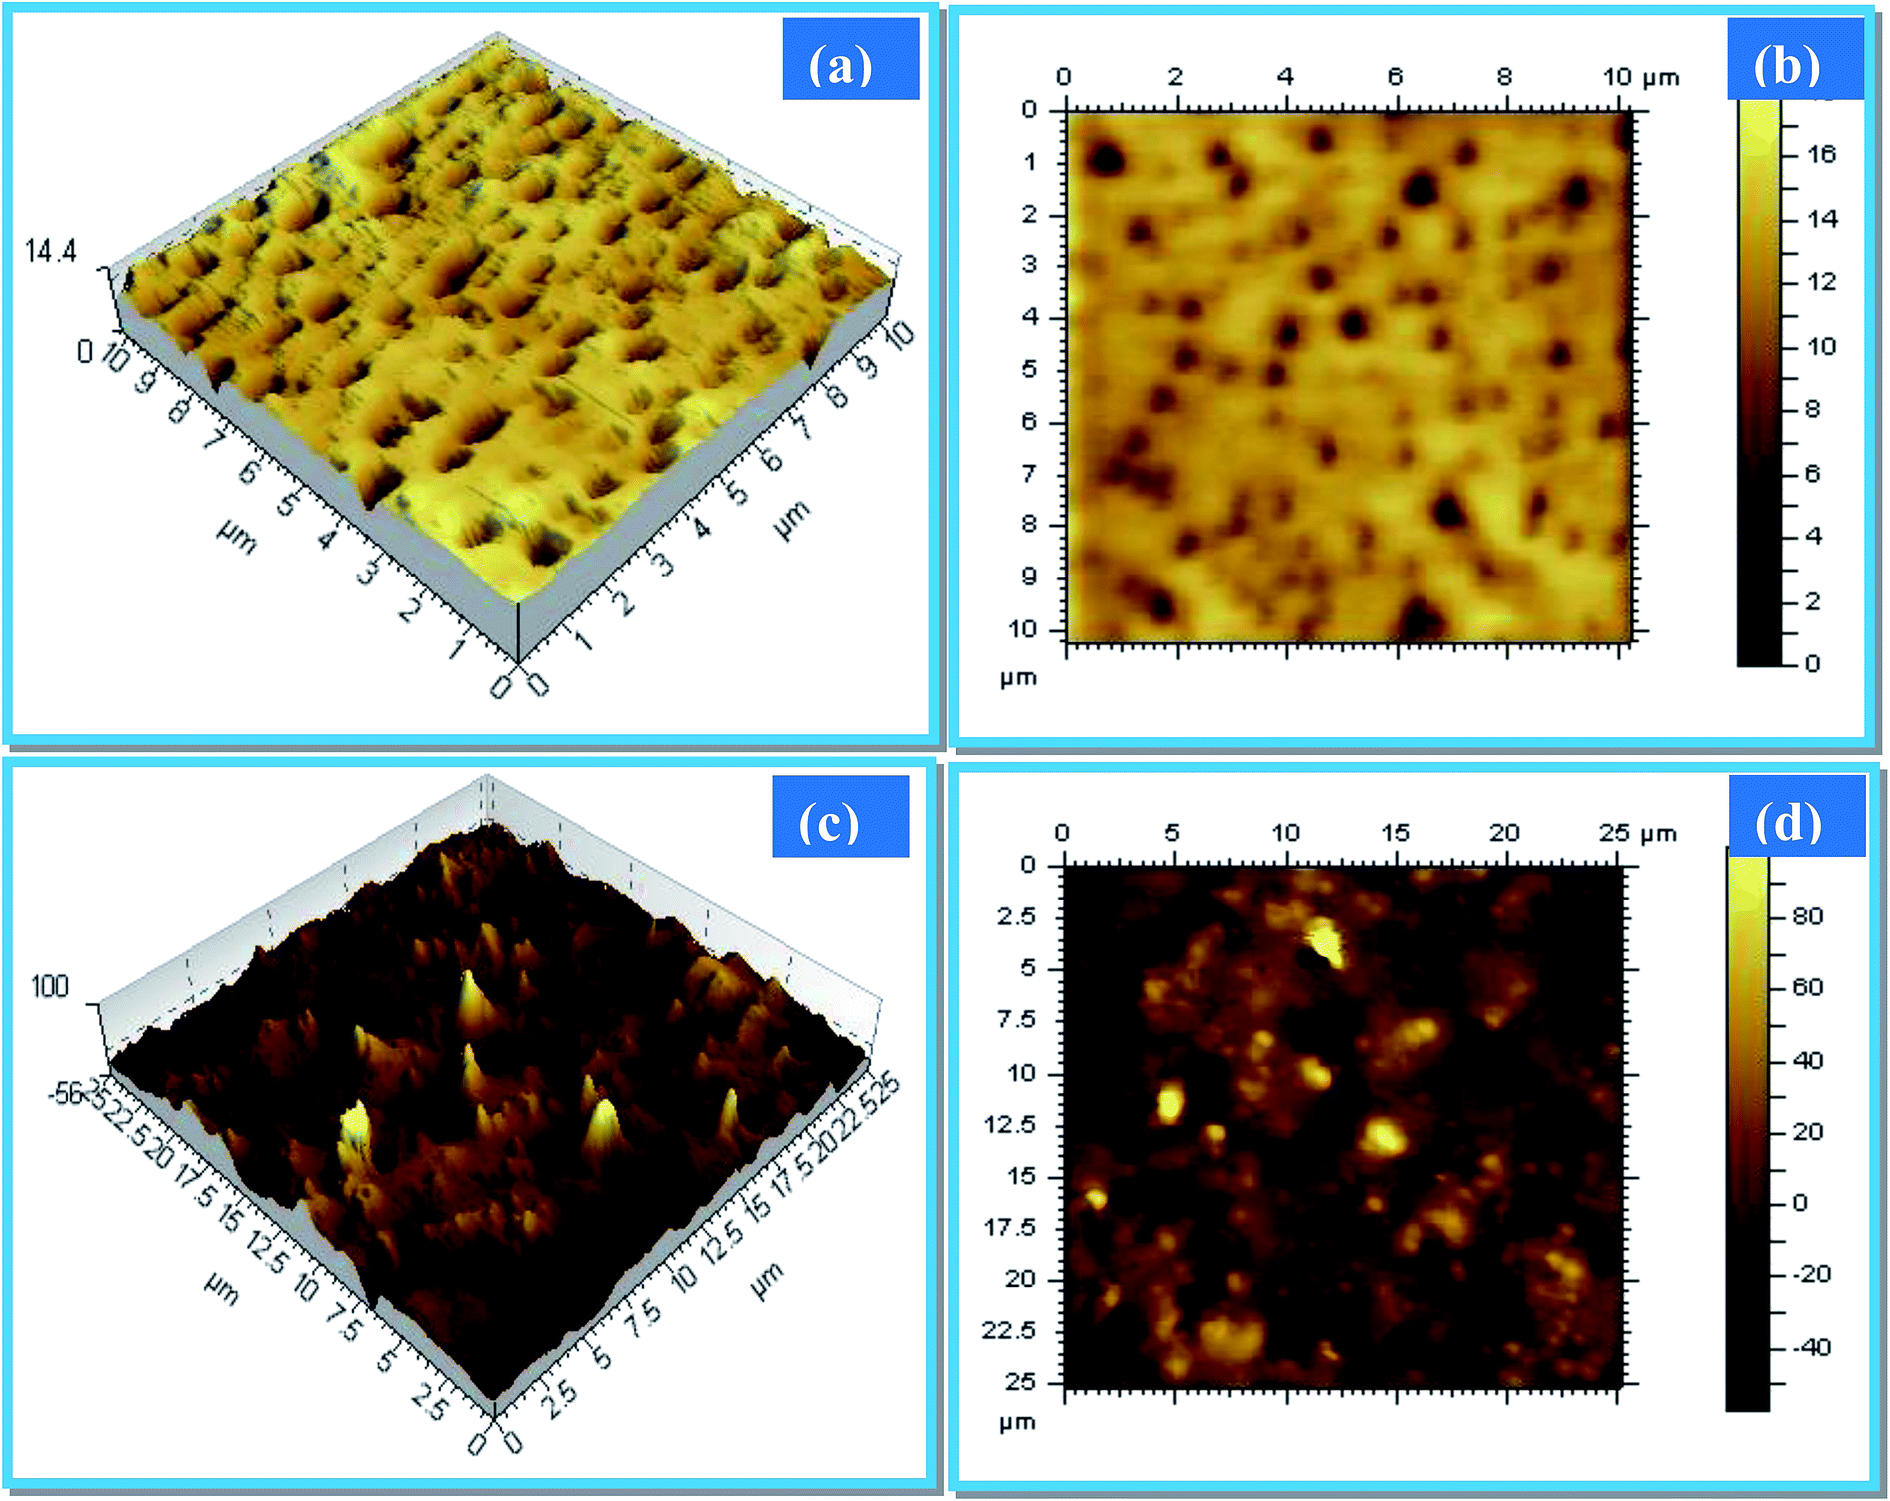
The morphology of the membranes was further investigated by AFM, as shown in Fig. 5(a)–(d). Topological images of pristine SPPEK Fig. 5(a) and (b) show a smooth morphology and SPPEK–SGNF (0.5 wt%) Fig. 5(c) and (d) shows the distributed additive, which induces surface roughness. This is also evident from the increased roughness profile for the nanocomposite compared to pristine SPPEK, as shown in Fig. S3 (ESI†), and is also in agreement with the SEM results. Further the dimensions of the hydrophilic and hydrophobic regions represented as darker and bright regions, respectively,34,35 also change by the incorporation of SGNF in the membrane matrix,36 wherein a reduction in the dimensions of the hydrophilic domains is observed for the composite which could eventually restrict methanol transport through SPPEK–SGNF in DMFCs.
 |
| | Fig. 5 AFM analysis for (a and b) pristine SPPEK and (c and d) SPPEK–SGNF (0.5 wt%). | |
3.1.3 Ion exchange capacity (IEC) sorption and dimensional stability for the membranes. The ion exchange capacity of pristine SPPEK along with its nanocomposite membranes was measured. The IEC of the SPPEK–SGNF nanocomposite membranes improved due to the surface functional groups on SGNF in addition to the sulfonic acid groups present in SPPEK, as seen in Table 2. Optimizing water uptake during sorption in terms of proton conduction in PEMs is important as it may affect the mechanical properties of the membrane. Table 2 shows the water uptake for pristine SPPEK and its nanocomposite membranes. It is observed that as the content of SGNF increased in the membrane, the water uptake increases due to the additional sulfonic acid content of SGNF in the overall membrane, wherein water molecules form intermolecular hydrogen bonding networks with the sulfonic acid groups of SPPEK and SGNF thereby enhancing the water absorption capacity of the membrane.37 However enhanced water uptake during sorption has no effect on the mechanical stability of the membrane due to the presence of highly stable SGNF which controls the degree of swelling in the membrane.
Table 2 Properties of the membranes
| Membrane type |
IEC (meq. g−1) |
Water uptake (%) |
Tensile strength (MPa) |
Elongation (%) |
Dimensional change (%) |
Electrical conductivity (×10−5 S cm−1) |
| Nafion-117 |
0.89 ± 0.05 |
19.4 ± 0.2 |
18.4 |
30.6 |
22.3 ± 0.2 |
1.9 ± 0.1 |
| SPPEK |
1.45 ± 0.05 |
23.5 ± 0.2 |
10.7 |
8.2 |
18.3 ± 0.3 |
2.6 ± 0.2 |
| SPPEK–SGNF 0.25 wt% |
1.57 ± 0.04 |
24.9 ± 0.2 |
12.3 |
6.9 |
16.5 ± 0.3 |
3.8 ± 0.1 |
| SPPEK–SGNF 0.5 wt% |
1.74 ± 0.04 |
25.1 ± 0.1 |
14.1 |
5.7 |
14.4 ± 0.2 |
5.2 ± 0.2 |
| SPPEK–SGNF 1 wt% |
1.67 ± 0.02 |
26.9 ± 0.1 |
16.8 |
5.0 |
12.5 ± 0.3 |
6.3 ± 0.3 |
| SGNF (particle) |
0.92 ± 0.03 |
— |
— |
— |
— |
— |
Dimensional stability is also one of the important parameters to be considered for PEMs for their real time application. The dimensional change was measured for the membranes to estimate the stability of the membranes. From Table 2, it is evident that the dimensional stability of the membranes increases as the content of SGNF increases in the membranes due to the interaction of SGNF with the SPPEK matrix which restricts swelling in the membrane. It is to be noted that for the optimized composite membrane (SPPEK–SGNF 0.5 wt%), the dimensional change was found to be 14.4%, which is 22% lower than that of the pristine SPPEK membrane.
3.2 Proton and electrical conductivity of the membranes
Fig. 6 shows the temperature effect on proton conductivity for pristine SPPEK and its composite, together with Nafion®-117. The incorporation of SGNF improves the interlink between the proton conducting channels by forming hydrogen bonding networks with the sulfonic acid groups and nitrogen moiety of SPPEK, thereby improving ionic transport.29 Hence, higher proton conductivity is observed for the SPPEK–SGNF nanocomposites in comparison with pristine SPPEK. However at a higher additive content, even with better mechanical properties, proton conductivity decreases due to the aggregation of SGNF in the polymer matrix which blocks proton transport.38 Hence in the present study, the additive content was restricted to 0.5 wt% of SGNF in relation to SPPEK. The proton conductivity of all the membranes increases as function of temperature due to the higher mobility of protons at high temperature, wherein the vehicular mechanism is dominant over GrÖtthuss mechanism.39
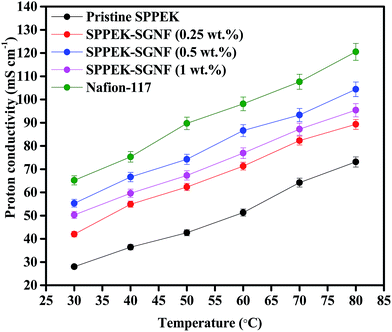 |
| | Fig. 6 Proton conductivity of the membranes as a function of temperature. | |
Since GNFs are electrically conducting in nature, quantification of the electrical conductivity for membranes is critical. The electrical conductivity of all the membranes was measured and represented in Table 2. Although the electrical conductivity of the composite membranes improved slightly, they still have the same order of magnitude with pristine SPPEK. The incorporation of SGNF in SPPEK does not show any significant effect on electrical conductivity. This may be due to the fact that the SGNF content in the membrane is minimal and the dispersed SGNFs are oriented randomly and hence cannot create continuous paths for electron conduction. Similar observations are also reported by Swati et al., wherein randomly oriented CNTs in the SPEEK membrane does not affect its electrical conductivity, whereas electrically aligned CNTs in SPEEK show a significant effect on electrical conductivity due to the formation of continuous paths for electron conduction.19
3.3 Methanol permeability and electrochemical selectivity of the membranes
Methanol permeability is one factor which significantly affects the selectivity of the membrane in DMFCs. Hence, it is important to mitigate the methanol permeability to achieve high selectivity. The methanol permeability of SPPEK and its nanocomposites along with Nafion®-117 is shown in Table 3 and the corresponding concentration profiles are shown in Fig. 7(a) and (b). It is inferred that the methanol permeability of the SPPEK nanocomposite membranes decreases with an increase in SGNF content, wherein SGNF act as a physical barrier for methanol transport by forming interfacial interactions with the SPPEK matrix.40 The methanol permeability of the optimized SPPEK–SGNF (0.5 wt%) composite membrane is lowered by 52% in comparison with pristine SPPEK at 30 °C. It is noteworthy that the methanol permeability of all the membranes is higher at 60 °C compared to 30 °C and this may be due to the higher energy of the methanol molecules for transport at elevated temperature.41 Fig. 7(c) shows the electrochemical selectivity of the membranes. It is inferred that among all the membranes, the SPPEK–SGNF (0.5 wt%) membrane shows the highest electrochemical selectivity due to its improved proton conductivity and restricted methanol permeability, and as a result a high DMFC power output is expected, which is discussed in the following section. It is important to note that even though the methanol permeability of SPPEK–SGNF (1 wt%) is better, its proton conductivity decreases due the aggregation of the additive, which affects its overall electrochemical selectivity.
Table 3 Methanol permeability of the membranes
| Membrane |
Methanol permeability (10−7 cm2 s−1) |
| 30 °C |
60 °C |
| Nafion-117 |
7.74 |
18.56 |
| Pristine SPPEK |
5.86 |
7.02 |
| SPPEK–SGNF (0.25 wt%) |
3.24 |
5.95 |
| SPPEK–SGNF (0.5 wt%) |
2.79 |
4.5 |
| SPPEK–SGNF (1 wt%) |
2.23 |
3.98 |
 |
| | Fig. 7 Concentration profiles of the membranes (a) at 30 °C and (b) at 60 °C depicting the methanol cross-over and (c) electrochemical selectivity of the membranes. | |
3.4 DMFC polarization studies and stability of the membranes
Fig. 8(a) shows the DMFC polarization curves for pristine SPPEK and its composites along with Nafion®-117. It is inferred that the composite membranes show a higher peak power density in comparison with pristine SPPEK and this improved power density is attributed to higher electrochemical selectivity, which is the cumulative effect of proton conductivity and methanol permeability. It is important to note that the optimized nanocomposite membrane, i.e. SPPEK–SGNF (0.5 wt%), shows a higher peak power density than that of pristine SPPEK and is on par with the peak power density of Nafion®-117. It is noteworthy that the peak power density slightly decreases when the loading of SGNF reaches 1 wt% in the membrane, and these results are consistent with the proton conductivity values. The present composite membranes are compared with a few important literature reports on sulfonated aromatic polymer–carbon nanostructure based composite membranes in Table 4, wherein the present composite membranes show on par DMFC performances compared to the reported composite systems.6–8,19,21
 |
| | Fig. 8 (a) DMFC power output for pristine SPPEK and its composites along with Nafion-117 and (b) change in open circuit voltage (OCV) as a function of time to determine the stability of the membranes. | |
Table 4 Comparison of the results of the present study with recent aromatic polymer–carbon nano material based composite membranes reported in literature
| Membrane |
Proton conductivity (mS cm−1) |
Methanol permeability (×10−7 cm2 s−1) |
DMFC performance (mW cm−2) |
Reference |
| SPEEK–SDBS–GO |
162 |
2.7 |
96 |
6 |
| SPI/SPSGO-8 |
96 |
14.6 |
75 |
7 |
| SPES–SGO |
58 |
1.5 |
— |
8 |
| SPEEK–sCNT |
43.1 |
1.7 |
— |
19 |
| SPEEK–PSSA–CNT |
101 |
2.2 |
93 |
21 |
| SPPEK–SGNF |
104 |
4.5 |
115 |
Present study |
Durability is one of the critical factors for PEMs in DMFCs for their viability in commercial applications. The optimized nanocomposite membrane of SPPEK–SGNF along with pristine SPPEK was subjected to an OCV test for 50 h, as shown in Fig. 8(b). In the OCV condition, methanol crossover is higher than the system with load current and hence the crossover effect on durability can be analyzed precisely. It should be noted that the nanocomposite membrane shows a higher OCV than pristine SPPEK and at the end of 50 h, and the drop in OCV is only 10–15%, which suggests the effective reduction in methanol crossover and improvement in the stability of the membranes. On the other hand, Nafion®-117 shows a lower OCV than the composite membrane due to its high methanol crossover. Nafion®-117 shows a slight decrement in OCV in the initial stage and attains a steady state level until 50 h due to its high stability and conductivity.
The stability of the membranes was also analysed by methanol crossover experiments using the LSV technique for pristine SPPEK, SPPEK–SGNF (0.5 wt%) and Nafion®-117 based MEAs before and after they were subjected to durability studies. Initially, pristine SPPEK and its nanocomposite showed a 60 and 43 mA cm−2 crossover current density, respectively, in comparison with 85 mA cm−2 for Nafion®-117, as shown in Fig. 9(a). However, after 50 h of OCV operation (Fig. 9(b)), pristine SPPEK showed a two fold increase in crossover current density due to its high methanol permeability, wherein the physical properties of the membrane change due to the attack of peroxide radicals during the operation, whereas the SPPEK–SGNF nanocomposite membrane showed only a marginal increment in crossover current density, which is attributed to its better stability and methanol barrier properties. It is to be noted that Nafion®-117 showed a crossover current density of only 10 mA cm−2 higher than the initial crossover current density due to its high chemical and mechanical stability.
 |
| | Fig. 9 Methanol crossover current density of the membranes using LSV: (a) initial and (b) after 50 h OCV test. | |
4. Conclusion
SPPEK–SGNF nanocomposite membranes are realized as suitable membrane electrolytes in DMFCs, wherein proton conductivity and methanol permeability is balanced for improved electrochemical selectivity. The surface functional groups present in GNF are responsible for the improved proton conductivity. Methanol permeability is reduced for the nanocomposite compared to pristine SPPEK, with improved dimensional stability due to the interfacial interactions of SGNF with SPPEK. The nanocomposite membranes show higher peak power densities than the pristine SPPEK membrane in DMFCs. The alternative composite membranes in the present study are significant in terms of restricting methanol crossover significantly compared to Nafion®-117. However, the mechanical stability of Nafion®-117 is superior when compared to these membranes. This must be addressed and further studies toward this direction are under progress.
Acknowledgements
Authors thank CSC-0122 HYDEN project under 12th Five Year Plan Programme for the financial support. Authors also thank Scientist-In-Charge, CECRI Madras Unit and Director, CSIR-CECRI for the support.
References
- K. A. Mauritz and R. B. Moore, Chem. Rev., 2004, 104, 4535–4586 CrossRef CAS PubMed.
- M. Armand, F. Endres, D. R. MacFarlane, H. Ohno and B. Scrosati, Nat. Mater., 2009, 8, 621–629 CrossRef CAS PubMed.
- D. Xu, G. Zhang, N. Zhang, H. Li, Y. Zhang, K. Shao, M. Han, C. M. Lew and H. Na, J. Mater. Chem., 2010, 20, 9239–9245 RSC.
- Y. Paik, S. S. Kim and O. H. Han, Angew. Chem., Int. Ed., 2008, 47, 94–96 CrossRef CAS PubMed.
- H. Park, Y. Kim, W. H. Hong, Y. S. Choi and H. K. Lee, Macromolecules, 2005, 38, 2289–2295 CrossRef CAS.
- Z. Jiang, X. Zhao, Y. Fu and A. Manthiram, J. Mater. Chem., 2012, 22, 24862–24869 RSC.
- R. P. Pandey, A. K. Thakur and V. K. Shah, ACS Appl. Mater. Interfaces, 2014, 6, 16993–17002 CAS.
- S. Gahlot, P. P. Sharma, V. Kulshrestha and P. K. Jha, ACS Appl. Mater. Interfaces, 2014, 6, 5595–5601 CAS.
- Y. Gao, G. P. Robertson, M. D. Guiver, X. Jian, S. D. Mikhailenko, K. Wang and S. Kaliaguine, J. Membr. Sci., 2003, 227, 39–50 CrossRef CAS.
- Y. Gao, G. P. Robertson, M. D. Guiver, X. Jian, S. D. Mikhailenko, K. Wang and S. Kaliaguine, J. Polym. Sci., Part A: Polym. Chem., 2003, 41, 2731–2742 CrossRef CAS.
- Y. Gao, G. P. Robertson, M. D. Guiver, X. Jian, S. D. Mikhailenko and S. Kaliaguine, Solid State Ionics, 2005, 176, 409–415 CrossRef CAS.
- Y. L. Chen, Y. Z. Meng and A. S. Hay, Macromolecules, 2005, 38, 3564–3566 CrossRef CAS.
- Y. H. Su, Y. L. Liu, Y. M. Sun, J. Y. Lai, M. D. Guiver and Y. Gao, J. Power Sources, 2006, 155, 111–117 CrossRef CAS.
- Z. Hongwei, Z. Baoku and X. Youyi, J. Appl. Polym. Sci., 2006, 102, 3972–3977 CrossRef.
- Y. H. Su, Y. L. Liu, Y. M. Sun, J. Y. Lai, D. M. Wang, Y. Gao, B. Liu and M. D. Guiver, J. Membr. Sci., 2007, 296, 21–28 CrossRef CAS.
- B. G. Choi, J. Hong, Y. C. Park, D. H. Jung, W. H. Hong, P. T. Hammond and H. Park, ACS Nano, 2011, 5, 5167–5174 CrossRef CAS PubMed.
- L. Cui, Q. Geng, C. Gong, H. Liu, G. Zheng, G. Wang, Q. Liu and S. Wen, Polym. Adv. Technol., 2015, 26, 457–464 CrossRef CAS.
- M. S. Asgari, M. Nikazar, P. Molla-abbasi and M. M. Hasani-Sadrabadi, Int. J. Hydrogen Energy, 2013, 38, 5894–5902 CrossRef CAS.
- S. Gahlot and V. Kulshrestha, ACS Appl. Mater. Interfaces, 2015, 7, 264–272 CAS.
- Y. Heo, S. Yun, H. Im and J. Kim, J. Appl. Polym. Sci., 2012, 126, E467–E477 CrossRef CAS.
- G. Rambabu and S. D. Bhat, Chem. Eng. J., 2014, 243, 517–525 CrossRef CAS.
- G. Rambabu and S. D. Bhat, Electrochim. Acta, 2015, 176, 657–669 CrossRef CAS.
- S. G. Peera, A. K. Sahu, A. Arunchander, S. D. Bhat, J. Karthikeyan and P. Murugan, Carbon, 2015, 93, 130–142 CrossRef CAS.
- S. G. Peera, A. K. Sahu, A. Arunchander, K. Nath and S. D. Bhat, J. Power Sources, 2015, 297, 379–387 CrossRef CAS.
- S. Meenakshi, S. D. Bhat, A. K. Sahu, P. Sridhar and S. Pitchumani, Fuel Cells, 2013, 13, 851–861 CAS.
- S. Meenakshi, A. K. Sahu, S. D. Bhat, P. Sridhar, S. Pitchumani and A. K. Shukla, Electrochim. Acta, 2013, 89, 35–44 CrossRef CAS.
- G. Rambabu, N. Nagaraju and S. D. Bhat, Chem. Eng. J., 2016, 306, 43–52 CrossRef CAS.
- Y. Zhu, S. Zieren and A. Manthiram, Chem. Commun., 2011, 47, 7410–7412 RSC.
- W. Zhou, J. Xiao, Y. Chen, R. Zeng, S. Xiao, H. Nie, F. Li and C. Song, Polym. Adv. Technol., 2011, 22, 1747–1752 CrossRef CAS.
- X. H. Zhang, Q. Q. Tang, D. Yang, W. M. Hu, Y. H. Yue, B. D. Wang, X. H. Zhang and J. H. Hu, Mater. Chem. Phys., 2011, 126, 310–313 CrossRef CAS.
- L. T. Qu, Y. Liu, J. B. Baek and L. M. Dai, ACS Nano, 2010, 4, 1321–1326 CrossRef CAS PubMed.
- A. Shukla, S. D. Bhat and V. K. Pillai, J. Membr. Sci., 2016, 520, 657–670 CrossRef CAS.
- J. Prakash, R. Venugopalan, B. Paul, J. Bahadur, S. K. Ghosh and D. Sathiyamoorthy, Corros. Sci., 2013, 67, 142–151 CrossRef CAS.
- P. J. James, T. J. McMaster, J. M. Newton and M. J. Miles, Polymer, 2000, 41, 4223–4231 CrossRef CAS.
- P. J. James, J. A. Elliott and T. J. Mcmaster, J. Mater. Sci., 2000, 35, 5111–5119 CrossRef CAS.
- X. Liu, S. He, G. Song, H. Jia, Z. Shi, S. Liu, L. Zhang, J. Lin and S. Nazarenko, J. Membr. Sci., 2016, 504, 206–219 CrossRef CAS.
- Y. Heo, H. Im and J. Kim, J. Membr. Sci., 2013, 425–426, 11–22 CrossRef CAS.
- H. C. Chien, L. D. Tsai, C. P. Huang, C. Kang, J. N. Lin and F. C. Chang, Int. J. Hydrogen Energy, 2013, 38, 13792–13801 CrossRef CAS.
- K. D. Kreuer, J. Membr. Sci., 2001, 185, 29–39 CrossRef CAS.
- C. Y. Tseng, Y. S. Ye, M. Y. Cheng, K. Y. Kao, W. C. Shen, J. Rick, J. C. Chen and B. J. Hwang, Adv. Energy Mater., 2011, 1, 1220–1224 CrossRef CAS.
- J. Auimviriyavat, S. Changkhamchom and A. Sirivat, Ind. Eng. Chem. Res., 2011, 50, 12527–12533 CrossRef CAS.
Footnote |
| † Electronic supplementary information (ESI) available. See DOI: 10.1039/c6ra23510g |
|
| This journal is © The Royal Society of Chemistry 2016 |
Click here to see how this site uses Cookies. View our privacy policy here.