Designing Ga(III)-containing hydroxyapatite with antibacterial activity

Mario Kurtjak*ab, Marija Vukomanovića, Andraž Krajncbc, Lovro Kramerbd, Boris Turkd and Danilo Suvorova
aAdvanced Materials Department, Jožef Stefan Institute, Jamova 39, 1000 Ljubljana, Slovenia. E-mail: mario.kurtjak@ijs.si; Tel: +386 1 477 3991
bJozef Stefan International Postgraduate School, Jamova 39, 1000 Ljubljana, Slovenia
cNational Institute of Chemistry, Hajdrihova 19, 1001 Ljubljana, Slovenia
dBiochemistry and Molecular Biology Department, Jožef Stefan Institute, Jamova 39, 1000 Ljubljana, Slovenia

Received 20th September 2016 , Accepted 16th November 2016

First published on 23rd November 2016


Abstract

Modified hydroxyapatite with antibacterial properties and high biocompatibility with mammalian cells is very desirable in many biomedical applications. Here we study the incorporation of Ga3+ ions into hydroxyapatite to achieve such an effective biological response. Antibacterial action against P. aeruginosa and cytocompatibility with L929 mouse fibroblasts was examined in vitro for different hydroxyapatites with incorporated Ga3+ ions (HAp(Ga)). Different Ga(III) contents and HAp(Ga) morphologies were obtained by adding Ga3+ ions at different stages of the hydroxyapatite synthesis and varying the Ga3+ concentration. Ga3+ ions were incorporated into the hydroxyapatite precursor phases at the early stages of the hydroxyapatite synthesis and into the amorphous surface layer of the apatite crystals at the late stages or after the synthesis, which yielded a mixed Ca/Ga amorphous phosphate surface layer. Their incorporation into the precursor nuclei before crystal formation and growth reduced the size of the final HAp(Ga) to small apatite nanocrystals with a large fraction of the mixed Ca/Ga amorphous phosphate surface layer. The release of Ga3+ ions from the HAp(Ga) depended on the overall amount of Ga in the material, while the biological response was mediated by the composition of the amorphous surface layer. The mainly Ca-phosphate amorphous surface layer resulted in a low antibacterial efficiency, while the mainly Ga-phosphate amorphous surface layer resulted in a high antibacterial efficiency, but also cytotoxicity. Ga(III)-containing hydroxyapatite can be designed for an effective biological response by varying the HAp(Ga) size and the overall Ga content to achieve the desired composition of the amorphous surface layer. The optimum HAp(Ga) in this study contained 4 wt% of Ga(III) and was obtained by adding Ga3+ ions during transformation of the precursor octacalcium phosphate/hydroxyapatite crystals to the final hydroxyapatite crystals. It provides excellent control over the release of the Ga3+ ions, and joins together the high efficacy of the antimicrobial action and non-toxicity over a wide concentration range (from 0.3 g L−1 to at least 1 g L−1).

Introduction

Gallium ions (Ga3+) are very attractive for tissue engineering because of their role in bone-tumour imaging, hypercalcaemia treatments, the inhibition of bone resorption, the promotion of bone growth, and as anticancer and antimicrobial agents.1–4 Their antibacterial action comes mainly from the substitution of Fe3+ ions, due to the similarity of Ga3+ and Fe3+ ions.2,3,5–7 For this reason, the largest effects were observed in strongly iron-dependent bacteria, like Pseudomonas aeruginosa, which is the most frequent Gram-negative pathogen in implant-associated infections.8 The consequences of the Ga(III)–Fe(III) substitution are blocking of the important redox processes inside the bacterial cell due to the inability of Ga3+ ions to be involved in one-electron reduction,9 the prevention of the synthesis of DNA due to the inhibition of ribonucleotide reductase and the blocking of the synthesis of siderophores by gene repression.5 These ions can prevent biofilm formation and destroy the already-built biofilms, affecting the bacteria in the inner part of the biofilm even more due to the lack of Fe in this part.5 They have been applied as antimicrobials in many forms: as gallium nitrate,5,10 maltolate,11 citrate,12 chloride,13 complexated gallium ions,12 gallium ions inside phosphate glass,14 in carboxymethyl cellulose,15 etc.7,16 A few gallium compounds are already in clinical use (e.g., for scanning inflammatory sites, the treatment of hypercalcaemia and Paget's disease), and citrate-buffered gallium nitrate for intravenous injection (Ganite™) has been approved by the FDA.3,5,7

Bone/teeth implantations, bone-fracture repairs and tissue engineering frequently use hydroxyapatite,17–19 as its high chemical and structural similarity with the biological calcified tissues make it very biocompatible and bioactive.20 Recently, this material has been also investigated for drug delivery.21,22 Due to the ability of Ga3+ ions to provide different possibilities for diagnostics and the medication of bone tissue, joining them with hydroxyapatite is expected to provide significant benefits in the treatment of health problems that concern bone tissue. Combining ionic Ga and hydroxyapatite shows great promise as it could enable the local delivery of Ga3+ ions23 and consequent antibacterial protection during the regeneration of bone.

Literature data show a very interesting influence of Ga3+ ions on the properties of hydroxyapatite and bone mineral. The in vivo and in vitro growth of bone mineral under physiological conditions in the presence of 0.01–1 mM Ga3+ ions resulted in larger and/or more perfect hydroxyapatite crystals with increased Ca and P contents, a lower CO3/PO4 ratio and lower solubility as a consequence of the decreased rate of formation that was related to the Ga concentration.24–26 Two events were found to occur: (a) the adsorption of Ga3+ ions onto hydroxyapatite crystals, which inhibited their further growth, and (b) the incorporation of Ga3+ ions into a non-crystalline HPO42−-rich calcium phosphate precursor phase of hydroxyapatite, which prevented its conversion into the hydroxyapatite.38 This substitution of Ca2+ ions with Ga3+ ions resulted in a distorted brushite configuration with the local environment around Ga being similar to GaPO4·2H2O.27 So far, the doping of the hydroxyapatite lattice with gallium ions has not been observed and it is believed to be impossible. However, nanocrystalline hydroxyapatite has a unique structure with a disordered surface layer28 that can accept gallium ions. A detailed NMR study of such Ga incorporation into the nanocrystalline calcium-deficient apatite revealed that gallium ions were only incorporated into the disordered surface layer consisting of HPO42− and PO43− non-apatitic environments and structural water molecules, while the ordered apatitic crystalline core remained unchanged.29 The calcination of a gallium-containing Ca-deficient nano-hydroxyapatite above 800 °C results in its conversion to a gallium-doped TCP with a fully controllable amount of gallium (formula Ca10.5−1.5xGax(PO4)7 with 0 < x < 1).30,31 Gallium-doped β-TCP can also be created by direct solid-state synthesis.30,31 Recently, an injectable Ga-doped apatitic cement (with a bioactive amount of up to 0.3 wt% of Ga) has been developed and its in vivo injection into rabbit femurs resulted in successful bone healing without any side effects.29

Despite several studies on Ga-doped calcium phosphates, there is a list of questions that remain unexplained:

(a) The antibacterial properties of such materials have not been explored yet and it is not known what content of Ga(III) within calcium-phosphate is required to provide sufficient antimicrobial protection;

(b) All studies have focused only on the bioactive properties of gallium ions on the bone mineral. However, the bioactive concentrations of Ga3+ ions are very low and the question is whether they are high enough to provide antimicrobial protection. The latter goes together with the fact that all the gallium-doped materials in previous in vivo investigations were pre-sterilized and input aseptically inside the organism.

(c) Another question is related to the toxicity. Previous studies of silver- and copper-containing materials32–35 often revealed that the materials with efficient antibacterial activity were toxic for human cells, while the antibacterial action of the biocompatible compositions/concentrations was not strong enough. Therefore, the question is what will happen to the toxicity of the Ga(III)-containing hydroxyapatites that will provide antimicrobial action.

(d) Gallium doping is limited by the precipitation of amorphous gallium phosphate29 and it would be interesting to know if this extra phase could also add to the antibacterial protection, without adding to the toxicity.

(e) It is not known how to design a Ga(III)-containing hydroxyapatite for an effective biological response, i.e., to prevent bacterial growth and enable normal tissue growth (good survivability of mammalian cells) on and around the material. Is it influenced only by the released Ga3+ ions or also by the interactions between the cells and the material? How do morphology and composition of the HAp(Ga) material affect its performance and how can they be changed to achieve the desired properties?

These gaps in the available knowledge regarding the Ga(III)-containing hydroxyapatite are the main subject of this work. The aim of this study was (a) to prepare and characterize different HAp(Ga) materials by introducing Ga3+ ions to the hydroxyapatite crystals at different stages of their growth: (i) during precipitation and crystal formation, (ii) during transformation of octacalcium phosphate (OCP) crystals to HAp crystals and (iii) after the synthesis by ion exchange of the as-prepared crystals; (b) to investigate the in vitro release of the incorporated Ga3+ ions; (c) to explore their antimicrobial activity against P. aeruginosa; and (d) to examine their in vitro cytotoxicity against mouse fibroblasts L929.

Experimental

Chemicals, media and cells

Specifications of the reagents used for the syntheses: deionized water (by reverse osmosis and ion exchange), 99.98% (metals basis) Ca(NO3)2·4H2O (Alfa Aesar), 99.99% (metals basis) NH4H2PO4 (Sigma Aldrich), 99.3+% solid crystalline urea (Alfa Aesar), 99.9% Ga(NO3)3·xH2O (Sigma-Aldrich). The amount of water in the Ga(NO3)3·xH2O was determined by TGA analysis36 to be x = 5.5. Reagents used for the analyses: 99.99% gallium (Acros Organics), rhodamine B (Alfa Aesar), 37% HCl (for analysis, Carlo Erba reagents), spectrophotometric grade (99.5+%) benzene (Alfa Aesar), microbiologically tested Miller Luria–Bertani broth (Sigma-Aldrich), Mueller–Hinton broth for microbiology (Sigma-Aldrich), agar for microbiology (Sigma-Aldrich). Bacterial strain P. aeruginosa MW1 was a gift from Dr Matej Butala from the Biotechnical Faculty of the University of Ljubljana. For further details on this strain the reader may refer to ref. 37. Mouse fibroblasts L929 (NCTC) were purchased from the European Collection of Authenticated Cell Cultures (ECACC no. 85103115).

Synthetic procedures

Hydroxyapatite. Hydroxyapatite was synthesized by ultrasound-assisted homogenous precipitation using the thermal degradation and hydrolysis of urea.38–41 The process contains two stages: precipitation and transformation. During the precipitation stage, Ca(NO3)2·4H2O was mixed with NH4H2PO4 and heated to 80 °C. Then, a 12 wt% solution of urea was added to achieve a Ca[thin space (1/6-em)]:[thin space (1/6-em)]P[thin space (1/6-em)]:[thin space (1/6-em)]urea molar ratio of 2[thin space (1/6-em)]:[thin space (1/6-em)]1[thin space (1/6-em)]:[thin space (1/6-em)]20 and a 9 mM concentration of NH4H2PO4 before sonication. This mixture was irradiated by ultrasound pulses of 2 s with 1 s breaks and 80% amplitude for 3 hours of pulses, while the temperature was maintained at 80–90 °C. A 750 W sonochemical apparatus (Sonics & Materials) with a replaceable 13 mm tip was used as the ultrasound source. Then the transformation stage followed, during which the precipitate was aged in the precursor solution for 15 hours. After this, the precipitate was centrifuged, washed with water and dried at room temperature.
HAp(Ga) by co-precipitation. HAp(Ga) by co-precipitation (subsequently denoted HAp(Ga)CP) was created in the same way as HAp, but all the stages of the synthesis were done in the presence of Ga3+ ions. Ga3+ ions were introduced into the starting reaction mixture to a 1.2 mM concentration, so that the Ga/Ca molar ratio was 0.0666, while the amounts of the other reactants stayed the same. Then the synthesis continued in the same way as the synthesis of hydroxyapatite, so that after 3 hours of sonication at 80–90 °C the precipitated HAp(Ga)CP was also aged in the presence of Ga3+ ions.
HAp(Ga) by transformation. HAp(Ga) by transformation (subsequently denoted HAp(Ga)TR) was created in the same way as HAp, but the transformation stage of the synthesis was done in the presence of Ga3+ ions. After the sonochemical synthesis of HAp, an aqueous solution of Ga(NO3)3 was added to the reaction suspension to achieve a 1.0 mM Ga concentration and a Ga/Ca molar ratio of 0.0666. In this way the precipitated HAp (still containing some OCP and ACP) was aged in the presence of Ga3+ for 15 h to form HAp(Ga)TR.
HAp(Ga) by ion-exchange. HAp(Ga) by ion-exchange (subsequently denoted HAp(Ga)IE) was created by mixing an aqueous suspension of HAp (which was washed but not dried after the synthesis and re-suspended in water) with an aqueous solution of Ga(NO3)3 for 24 hours. Two different concentrations of Ga3+ were used: 1.4 mM and 2.8 mM, while the Ga/Ca ratios calculated for the initial Ca molar mass used in the synthesis of HAp yielded 0.139 and 0.277, respectively. The 1.4 mM Ga3+ concentration resulted in a HAp(Ga)IE with 8–9 wt% of Ga, while the 2.8 mM concentration resulted in a HAp(Ga)IE with 13–17 wt% of Ga.

The pH at different stages of the syntheses was measured by a Eutech PC700 pH-meter.

Methods for characterization of materials

High-temperature XRD. In order to determine the thermal stability and phase composition after heating, the samples were heated up to 1200 °C inside an Empyrean X-ray diffractometer. A temperature program was set up so that an XRD measurement was made at room temperature, after which the sample was heated to 600 °C, held at this temperature for 30 minutes and measured. After the XRD measurement, the sample was further heated and measured in the same way after 30 minutes of calcination at 800 °C, 1000 °C, 1100 °C and 1200 °C. XRD patterns were measured from 10 to 90° with 100 s steps of 0.013°.
TG/DSC analysis. Thermogravimetric analyses were performed on a Jupiter 449 simultaneous thermal analysis (STA) instrument coupled with a 403C Aëoloss mass spectrometer (MS) (Netzsch, Selb, Germany). The measurements were performed with a heating rate of 10 °C min−1 in an Ar atmosphere using a TG/DSC sample holder.
Spectroscopic investigations. FTIR analyses were performed on a Perkin Elmer Spectrum 400 MIR spectrophotometer with the DRIFT technique for 5 mg of sample diluted with 70 mg of KBr. Solid-state magic angle spinning (MAS) NMR experiments were performed using a 3.2 mm Varian HX MAS probe on a narrow-bore 600 MHz (14.1 T) Varian NMR system, operating at a 1H Larmor frequency of 599.54 MHz and a 31P Larmor frequency of 242.69 MHz. The 1H and 31P chemical shifts were reported relative to the signals of tetramethylsilane and H3PO4, respectively. A sample spinning frequency of 20 kHz was used for all the experiments. The 31P MAS spectra were recorded with a 90° excitation pulse of 1.8 μs and a single scan. A two-dimensional 1H–31P CP-HETCOR spectrum was obtained by first exciting the protons with a 90° pulse having a duration of 2.3 μs and letting the proton magnetization evolve in the absence of homo- and heteronuclear decoupling, after which the magnetization was transferred to the phosphorous nuclei with a 500 μs cross-polarization (CP) contact time. The number of increments along the indirectly detected dimension was 200, with each increment being measured with 128 scans and a repetition delay of 5 s.
BET analyses. The specific surface area was measured with the Brunauer–Emmett–Teller (BET) method using the Micromeritics Gemini II 2370 nitrogen-adsorption apparatus (Norcross, GA).
Electron microscopy analyses. Transmission electron microscopy was performed on a JEM2100 microscope with a LaB6 electron source and Cu TEM grids with lacey carbon. Simulated electron diffraction patterns were calculated by the EMS software using parameters of the hexagonal P6/m hydroxyapatite (PDF number 01-089-6438) crystal structure. Scanning electron microscopy was performed on a FEG SEM 7600F. The samples were dried on an Au-sputtered 100 nm filter membrane, stuck on the carbon tape and coated with 5 nm of carbon before the analysis.
Complexometric quantitative analysis of Ga. The amount of Ga in the samples was determined by a spectrophotometric method based on the absorbance of the GaCl4–rhodamine B complex.42 The complex was formed in 4 mL of NaCl-saturated sample solution with 0.1 wt% of rhodamine B and extracted to 4 mL of benzene. The standards for a calibration curve from 0.1 to 2 mg L−1 Ga concentrations were obtained by dissolving a measured mass of Ga in aqua regia, evaporating to dryness and dissolving the obtained white powder in 6 M HCl. To determine the amount of Ga in the dried samples, 6 mg of the powder were dissolved in 6 mL of 6 M HCl and diluted 100–200 times with 6 M HCl. For the determination of the Ga concentration in the solutions from the ion-release study, 200 μL of solution were mixed with NaCl and 200 μL of 37% HCl and diluted to 4 mL with 6 M HCl and the rhodamine B solution.

In vitro release of Ga3+ ions

The investigation of the release of Ga3+ ions from the HAp(Ga) was performed at pH 7.4 using a Miller Luria–Bertani (LB) medium. A total of 10 mg of each sample (HAp(Ga)CP, HAp(Ga)TR or HAp(Ga)IE) were dispersed in 10 mL of LB medium. The dynamic conditions (60 rpm) and constant temperature (37 °C) were ensured by the use of a shaking water bath (Memmert, WNB7-45, Germany). The total release of the Ga3+ ions was monitored during a period of 10 days. A 1 mL aliquot of the liquid containing the released Ga3+ ions was taken out every two days and replaced with 1 mL of fresh LB medium. The aliquot was then centrifuged at 15[thin space (1/6-em)]348 × g for 15 min and the supernatant was analysed for the concentration of Ga3+ ions. The concentration of the released Ga3+ ions was measured using complexometric quantitative analyses. The investigations were performed in three parallel measurements. Since a portion of the medium was substituted by fresh medium every 2 days, the concentrations were recalculated to account for the dilution using the following equation:
image file: c6ra23424k-t1.tif

Thus, if the Ga release stopped we would have a constant line instead of a descending line. Since the three materials contained different amounts of Ga, the amount of released Ga was also converted into the fraction of contained Ga using the following equation:

image file: c6ra23424k-t2.tif
where Va = 1 mL, V = 10 mL and c are the measured concentrations.

Antibacterial tests

Disc diffusion antibiogram. An overnight culture of P. aeruginosa MW1 was grown in the LB medium at 37 °C and 237 rpm orbital shaking until the end of the logarithmic phase (OD600 ≈ 1 or approx. 109 cfu mL−1). Then it was diluted 100× with 0.9% NaCl and 50 μL of the diluted culture were spread onto a Mueller–Hinton (MH) agar plate with a Drigalski spatula. Then a disc with 6 mm diameter of the dried material sample (20 mg), which was made by pressing the material powder at 5 kN, was put onto the MH agar plate with bacteria. The plate with the inoculum and the material disc was incubated for 24 h at 37 °C. Phase-contrast images were recorded on a Nikon Eclipse Ti-U inverted microscope.
Microdilution antibiogram. An overnight culture of P. aeruginosa MW1 was diluted 1000× with MH broth to obtain a concentration between 2 × 10⁵ and 106 cfu mL−1 of the bacterial culture. The dried material was suspended in MH broth and different dilutions were made in this medium. A total of 100 μL of the suspension were mixed with 100 μL of bacterial culture in a microtiter well and the 96-well plate was incubated with 237 rpm orbital shaking for 1 day in a multiplate reader while monitoring the absorbance (optical density) at 600 nm (OD600). Thus, the growth curves for all samples were obtained and compared for the determination of the minimal inhibitory concentration (MIC). The starting values of OD600 were subtracted from all the measurements. An arithmetic average and standard deviation were calculated from 4 parallel samples for each OD600 value. The microdilution antibiogram experiments were carried out in the H1 Hybrid Multi-mode Microplate Reader (Synergy) by putting the samples into flat-bottom Brand 96-well plates.

In vitro cytocompatibility test

Cytotoxicity of the materials was tested on mouse fibroblasts L929 (ECACC no. 85103115), which were grown in MEM (Gibco) supplemented with 10% fetal bovine serum (Sigma), 2 mM L-glutamine (Invitrogen), 100 units of penicillin and 100 μg mL−1 streptomycin (Invitrogen) at 37 °C in a humidified 5% CO2 atmosphere. Ten thousand cells per well were seeded on a 96-well plate and grown overnight, then the growth medium was replaced with fresh medium containing dispersed particles and incubated for 24 h. To determine the remaining cell viability, growth medium was replaced with fresh medium containing 0.5 mg mL−1 3-(4,5-dimethylthiazol-2-yl)-2,5-diphenyltetrazolium bromide (MTT) for two hours. The formed formazan crystals were solubilized in DMSO and transferred to a new transparent 96-well plate, where the absorbance at 570 nm was measured. Cell viability (%) was determined as the absorbance ratio between cells grown in presence and absence of the materials. The average values and standard deviations were calculated from 6 parallel samples.

Results

Physicochemical properties of HAp(Ga)

In the first segment of our research, HAp(Ga) materials obtained during the co-precipitation (HAp(Ga)CP), transformation (HAp(Ga)TR) and ion exchange (HAp(Ga)IE) of apatite with Ga3+ ions were investigated in detail for the general physicochemical characteristics, including the chemical and phase composition, thermal stability, surface characteristics as well as the morphological and structural properties. Pure hydroxyapatite without any Ga3+ ions (HAp) was used as a reference.

The XRD analysis (Fig. 1) showed that all three investigated Ga(III)-containing apatites contained only one crystalline phase that was identified as hexagonal hydroxyapatite (reference PDF number 01-089-6438). In comparison with HAp, HAp(Ga)TR and HAp(Ga)IE, the diffraction maxima of the HAp(Ga)CP are much broader. This can either be an indication of a reduced crystallite size due to the influence of the Ga3+ ions on the growth of apatite crystals or a consequence of a change in the apatite structure by the incorporation of Ga3+ ions. Crystallinity was roughly the same for HAp, HAp(Ga)TR and HAp(Ga)IE, while the background increased in this order, notably in case of HAp(Ga)IE (ESI Table S1). This implies that the crystallinity of the hydroxyapatite did not change after doping with Ga3+ and that HAp(Ga)IE might contain an extra amorphous phase. As indicated in Table 1, the chemical analysis confirmed the presence of Ga in all three apatites processed in the presence of Ga3+ ions. The largest amount of Ga(III) was present in the HAp(Ga)IE sample; a four times lower concentration of Ga was determined in the HAp(Ga)TR sample; and the lowest, five times lower, concentration of Ga was present in the HAp(Ga)CP sample. HAp(Ga)IE materials with different Ga(III) contents (6, 8 and 16 wt%) were prepared and analysed. Most of the results presented further in this article are from the HAp(Ga)IE with 16 wt% of Ga, while the results from the other HAp(Ga)IE materials, when given, are always additionally marked with their Ga content to avoid any confusion. The influence of the Ga component on the structure of the apatites was analysed indirectly by an investigation of the materials' thermal stability and the changes in their surface properties.


image file: c6ra23424k-f1.tif
Fig. 1 X-ray diffractograms of (a) HAp and HAp(Ga) obtained by (b) co-precipitation (c) transformation and (d) ion exchange (16 wt% Ga) at 30 °C, 600 °C, 800 °C, 1000 °C, 1100 °C and 1200 °C. Asterisks (*) indicate peaks from HAp, empty circles (○) peaks from β-TCP, black diamonds (♦) peaks from α-TCP, black circles (●) peaks from Ga(III)-doped β-TCP, white triangles (△) peaks from Ga2O3 and black triangles (▼) peaks from GaPO4.
Table 1 Composition, surface and thermal characteristics of HAp and HAp(Ga) obtained by co-precipitation, transformation and ion exchangea
Sample Ga content [wt%] Specific surface area (BET) [m2 g−1] Phase transitions (TGA)
HAp → β-TCP HAp(Ga) → β-TCP(Ga) TCP β → α TCP α → α′ β-TCP(Ga) transf.
a The standard deviations were calculated from three batches (repeated syntheses) of each sample. HAp stands for hydroxyapatite, TCP for tricalcium phosphate, HAp(Ga) for Ga(III)-containing HAp, CP for co-precipitation, TR for transformation and IE for ion exchange.
HAp 0 24 ± 3 800 °C 1130 °C 1455 °C
HAp(Ga)CP 3.0 ± 0.1 160 ± 15 600 °C 1460 °C
HAp(Ga)TR 4.0 ± 0.1 54 ± 6 800 °C 1465 °C
HAp(Ga)IE 15 ± 2 45 ± 5 800 °C
8.0 ± 0.5 42 ± 5


DSC and HT XRD analyses were used to monitor the decomposition and phase transformation of the Ga(III)-containing and pure apatites (Fig. 1 and 2). The pure HAp went through the typical transformations of hydroxyapatite: loss of adsorbed water at 200 °C, loss of structural water at 600 °C, transformation of HAp into β-TCP at 800 °C, transformation of β-TCP to α-TCP at 1100 °C and conversion of α-TCP to α′-TCP at 1400 °C (Fig. 2a and Table 1).43–46 The high-temperature (HT) XRD analysis of the pure hydroxyapatite confirmed its transformation to β-TCP above 800 °C and the further transformation of β-TCP to α-TCP above 1100 °C, so that at 1200 °C both HAp and α-TCP were present (Fig. 1a). On the other hand, in the case of the Ga(III)-containing apatites the transformation went from apatite to Ga(III)-doped β-TCP (β-TCP(Ga)). The HAp(Ga)CP exhibited the lowest thermal stability and it started transforming into β-TCP(Ga) already at 600 °C. The XRD maxima of the formed β-TCP(Ga) phase remained low and broad, even at higher temperatures (Fig. 1b). According to the literature,47,48 the absence of any exothermic peaks in the DSC of HAp(Ga)CP is evidence of nanocrystallinity, rather than low crystallinity in this sample.


image file: c6ra23424k-f2.tif
Fig. 2 Thermal characteristics (TGA and DSC curves) of (a) HAp and HAp(Ga) obtained by (b) co-precipitation, (c) transformation and (d) ion exchange (16 wt% Ga).

While the conversion of HAp(Ga)CP and HAp(Ga)TR with 3–4 wt% of Ga into β-TCP(Ga) was almost quantitative, with a very small amount of Ga2O3 appearing above 1000 °C, HAp(Ga)IE with 16 wt% of Ga yielded one more phase at 800 °C, i.e., GaPO4, which degraded into Ga2O3 above 1100 °C (Fig. 1c and d). We also observed that Ga-doped β-TCP, which is apparently more thermally stable than the non-doped β-TCP, does not convert to α-TCP and remained stable at 1200 °C. Above this temperature, in the systems with a smaller content of Ga3+ (HAp(Ga)CP and HAp(Ga)TR), the β-TCP(Ga) phase transforms into another phase (a sharp maximum at 1400 °C, Fig. 2b and c). This event was not observed for the system with the highest content of Ga3+ (HAp(Ga)IE16, Fig. 2d). It seems that the high content of Ga3+ ions kept the thermal stability of the β-TCP(Ga) phase in the HAp(Ga)IE system and prevented its transformation into another phase, even at 1400 °C.

Morphologically, the systems obtained by the co-precipitation, transformation and ion exchange of apatite with Ga3+ ions show different characteristics (Fig. 3). As expected, after the ion exchange of apatite with Ga3+ ions, its morphology of sub-micrometre-sized laths that join into plate-like structures, which is characteristic for sonochemically obtained apatite,41 remained unchanged (Fig. 3e and f). However, when apatite was co-precipitated with Ga3+ ions, the morphology of the obtained particles was changed into nanolaths with 30 nm lengths and 10 nm widths (Fig. 3a and b). The morphology of the HAp(Ga)TR was between these two cases and mainly contained sub-micrometre plate-like structures (Fig. 3c and d). The results confirm the contribution of the Ga3+ ions to both stages that are significant for the synthesis of apatite crystals – the stage that includes the formation of the crystals and the next stage associated with the crystal growth and phase (OCP–HAp) transformation. EDS analyses confirmed the presence of gallium and its uniform distribution throughout all three samples. The SAED analysis confirmed that the obtained Ga(III)-containing apatite laths are locally crystalline structures similar to the pure HAp reference (presented in the ESI Fig. S1) and did not reveal any distortion that could be assigned to the incorporation of the Ga3+ ions into the structure of the apatite. Similarly, well-ordered unit cells were observed under TEM at high magnifications for the systems obtained by transformation and ion exchange. These analyses revealed well-ordered, defect-free structures for the Ga(III)-containing lath/plate-like particles with preferential growth along the 001 crystallographic direction. We also observed that these crystalline structures of Ga(III)-containing apatite were coated with a few-nm-thick amorphous layer, which could be the location of the Ga3+ ions within the HAp(Ga) materials.


image file: c6ra23424k-f3.tif
Fig. 3 Morphological characteristics of HAp(Ga) materials obtained by co-precipitation (a and b), transformation (c and d) and ion exchange (e and f). Inset graphs in the left-hand (SEM) images are the SEM EDS analyses of the corresponding materials. Insets in the right-hand images are (b) ring electron-diffraction pattern with simulated hydroxyapatite pattern (white background) in the top-right quarter for the HAp(Ga)CP; (d and f) high-magnification TEM images and spot electron-diffraction patterns for the HAp(Ga)TR and HAp(Ga)IE materials.

For a better insight into the incorporation of Ga(III) inside apatite and its influence on the structure of HAp, FTIR (Fig. 4) and NMR (Fig. 5 and 6) analyses were applied. In comparison with the pure HAp reference, the FTIR spectra of the HAp(Ga) samples exhibit a decreased fine structure of the bands corresponding to the vibrations of the PO43− ions (960–1100 cm−1 and 560–630 cm−1), a lowered band of the OH vibrations (at 3573 cm−1) and a shift of the O–H vibrations (the broad band extending from 3700 to 2500 cm−1) to larger wavenumbers. The most pronounced effect was observed for the HAp(Ga)CP and the HAp(Ga)IE. This implies that the addition of Ga3+ might have disordered the structure of the hydroxyapatite. However, when we calculated the splitting factors for the P–O asymmetric vibrations49 for these four systems, we obtained similar (even slightly higher) values for the HAp(Ga) samples and the HAp reference. These results can be explained by the adsorption of Ga3+ onto the surface of the apatite structure that inhibits the surface OH vibrations and the disorder of the outer part of the apatite crystals due to the incorporation of Ga3+ ions that lowers and broadens the OH band as part of the OH ions change from isolated ordered to disordered, while the crystallinity of the internal part without Ga3+ ions is well retained. Additionally, a lower C/P ratio (calculated from the heights of the CO32− band at 1422 cm−1 and the PO43− band at 1035 cm−1) was observed for the HAp(Ga)CP in comparison with our HAp reference, which is in agreement with previous observations for the effect of Ga3+ ions on the in vivo and in vitro growth of bone mineral.24–26 Since the HAp(Ga)CP sample consisted of much smaller particles than our pure HAp reference, the decreased OH band and fine structure of the P–O bands in its spectrum could also be assigned to the nanometre size.50 Therefore, it was additionally compared to the IR spectrum of the nanocrystalline HAp from the literature47 and it was similar to the spectrum of the pure nano-apatite, but still had a slightly lower OH band and a slightly decreased fine structure of the P–O bands in comparison with the pure nano-HAp reference.


image file: c6ra23424k-f4.tif
Fig. 4 FTIR spectra of HAp (a) and HAp(Ga) obtained by co-precipitation (b), transformation (c) and ion exchange (16 wt% Ga, d). The calculated splitting factors for the asymmetric P–O vibrations (SF) and C/P ratios are written on the graphs.

image file: c6ra23424k-f5.tif
Fig. 5 31P MAS NMR spectra of (a) HAp and HAp(Ga): (b) co-precipitation, (c) transformation, (d) ion exchange. The peaks are indicated with the arrows and explained.

image file: c6ra23424k-f6.tif
Fig. 6 1H–31P CP-HETCOR NMR spectrum of HAp(Ga)IE with 16 wt% of Ga.

The NMR analysis provided even more precise data regarding the structure of the HAp and the incorporation of Ga3+ ions (Fig. 5 and 6). The 1H and 31P NMR spectra of four Ga(III)-containing HAp materials (HAp(Ga)CP, HAp(Ga)TR, HAp(Ga)IE with 8 wt% of Ga and HAp(Ga)IE with 16 wt% of Ga) were compared to the pure HAp reference. The 31P NMR spectra of the HAp and all four Ga(III)-containing apatites contain a narrow peak at 3 ppm, which comes from the apatitic phosphate ions, and a broad peak underneath with roughly the same centre (slightly upfield) arising from the PO43− and HPO42− groups in the disordered surface layer of hydroxyapatite.28,51,52 As the HAp(Ga)CP sample is nanocrystalline with very small particles that are nano-dimensional in all three dimensions (larger surface-to-volume ratio), the surface layer's broad signal is much larger. Incorporation of Ga3+ ions into the disordered surface layer results in a chemical shift of the broad signal,29 so that all HAp(Ga) samples contain an additional broad peak. This peak is centered at 0.7 ppm for the HAp(Ga)CP29 and it is shifting upfield with increasing Ga content (−0.04 ppm for HAp(Ga)TR with 4 wt%, −4.4 ppm for HAp(Ga)IE with 8 wt% and −6.9 ppm for HAp(Ga)IE with 16 wt% of Ga). This peak is attributed to a mixed Ca/Ga phosphate surface disordered layer. In a previous study of Ga3+ incorporation into calcium-deficient hydroxyapatite during precipitation, a peak at −6 ppm was attributed to an amorphous gallium phosphate.29 Hence, we concluded that the mixed Ca/Ga-phosphate amorphous surface layer consists mainly of amorphous GaPO4 in the case of the HAp(Ga)IE. The apatitic phosphate signal (the narrow peak) decreased for the Ga(III)-containing materials in comparison with the pure HAp reference, while the additional broad signal increased (see also ESI Fig. S3 and Table S2). This is evidence of the assumed consumption of a part of the crystalline core for the formation of the amorphous Ga(III)-containing layer in the case of the HAp(Ga)TR and HAp(Ga)IE. This is also evident from the 1H NMR spectra (ESI Fig. S2), which contain a peak at 0 ppm assigned to the apatitic OH ions, a broad peak between 5 and 6 ppm belonging to the protons in the adsorbed and interstitial water, and a weak broad peak with a maximum at around 8 ppm that corresponds to HPO42− groups in the disordered surface layer.28 The nanocrystalline HAp(Ga)CP exhibits a strong water signal and a less-intensive OH signal. The 1H NMR spectra of the HAp(Ga)TR and HAp(Ga)IE are very similar to the spectrum of the pure HAp, but with decreased OH peaks, which is in agreement with the explanation of the OH band decrease in the IR spectra and that the addition of Ga3+ also converted part of the crystalline core to the Ca/Ga amorphous phosphate surface layer. The 1H–31P CP-HETCOR NMR spectrum of HAp(Ga)IE containing 16 wt% of Ga shows a correlation of the narrow PO43− phosphorous peak with the OH peak in the 1H spectrum, while the broad peaks of the amorphous calcium and gallium phosphate are correlated with the broad 1H peaks of water and HPO42− ions in the non-apatitic disordered surface layer (Fig. 6). This proves that Ga3+ ions are located in the disordered surface layer rather than in the apatitic crystalline core.

In vitro release of Ga3+ ions from the HAp(Ga)

The three Ga(III)-containing materials were aged in simulated physiological conditions by constant shaking at 60 rpm in a Luria–Bretani growth medium (pH = 7.4) at 37 °C for a period of 10 days. The release of Ga3+ ions was examined every 2 days (Fig. 7). The amount of released Ga3+ correlates with the total Ga content in the material and it increases from HAp(Ga)CP, over HAp(Ga)TR to HAp(Ga)IE. A large amount of Ga HAp(Ga)IE (with 16 wt% of Ga) was released already in the first 2 days, in contrast to the other two Ga-containing materials, which released about 7 times less Ga3+ ions in the same time period (Fig. 7a). After an initial burst release, the release of Ga3+ from the HAp(Ga)IE slowed down. However, it was still faster than from the HAp(Ga)CP and HAp(Ga)TR. Since the three samples contained different amounts of Ga, the kinetics of Ga release is better observed by comparing the fraction of the contained Ga(III) that is released (Fig. 7b). We can see that after the whole 10 day period 15–25% of the contained Ga is released from all three materials. This occurs faster for the HAp(Ga)IE. It is interesting that HAp(Ga)CP releases more Ga than HAp(Ga)TR in the first 2 days, but then its release slows down, while for the HAp(Ga)TR it proceeds at the same rate for 6 days before slowing down, so that it reaches the same fraction as the HAp(Ga)CP in 4 days and surpasses it afterwards. In the last 4 days, the rate of Ga release is very similar for all three materials. The HAp(Ga)TR exhibits the best release kinetics without any initial burst release. It releases about 5% of the initially contained Ga every two days until the sixth day and then about 5% of the contained Ga during the next 4 days.
image file: c6ra23424k-f7.tif
Fig. 7 Release of Ga3+ ions from HAp(Ga) obtained by co-precipitation, transformation and ion exchange (16 wt% Ga) under simulated physiological conditions: (a) concentration of Ga3+ released during aging of the 1 mg mL−1 suspensions of the three materials; (b) fraction of the contained Ga that was released into the LB growth medium.

Antibacterial and cytotoxic properties of HAp(Ga)

The antibacterial activity of the gallium-doped hydroxyapatites was evaluated against the P. aeruginosa MW1 strain. All three materials created clean inhibition zones in the disc diffusion test (Fig. 8) with the zone diameter increasing in the order HAp(Ga)CP < HAp(Ga)IE ≤ HAp(Ga)TR, while the non-doped hydroxyapatite created no inhibition zone. The influence of the doped materials on the planktonic bacterial growth was quantified by a microdilution antibiogram assay. Whereas the non-doped hydroxyapatite enabled normal bacterial growth, exhibiting a typical growth curve, the doped materials slowed down the bacterial growth (Fig. 9). The minimal inhibitory concentration (MIC) was 0.9 g L−1 for HAp(Ga)CP, 0.3 g L−1 for HAp(Ga)TR, 0.1 g L−1 for HAp(Ga)IE (8 wt% Ga) and 0.075 g L−1 for HAp(Ga)IE (16 wt% Ga).
image file: c6ra23424k-f8.tif
Fig. 8 Disc diffusion antibacterial test against P. aeruginosa of (a) hydroxyapatite and the HAp(Ga) obtained by (b) co-precipitation, (c) transformation and (d) ion exchange, with zoomed zones of inhibition (on the right) as observed under a phase-contrast microscope.

image file: c6ra23424k-f9.tif
Fig. 9 Microdilution antibacterial test against P. aeruginosa for the HAp(Ga) obtained by (a) co-precipitation, (b) transformation and (c and d) ion exchange containing (c) 8 wt% of Ga, (d) 16 wt% of Ga. Concentrations of the materials in the MH medium are given in the legends on the graphs. 0.1 g L−1 HAp was the negative control.

Since the HAp(Ga)TR and HAp(Ga)IE materials were the most efficient in terms of antibacterial action, they were further investigated for toxicity against mammalian cells. The cytotoxicity of HAp(Ga)TR and HAp(Ga)IE (8 wt% Ga) in comparison with the non-doped HAp was examined against the mouse fibroblast cell line (L929) in the concentration range 0–1 g L−1. Both HAp(Ga) materials enabled good cell survivability at MIC (Fig. 10a). For HAp(Ga)TR the concentration of the material that stopped bacterial growth resulted in more than 80% of surviving fibroblast cells, while for the HAp(Ga)IE (8 wt% Ga) it was above 70%. However, HAp(Ga)IE exhibited rapidly increasing toxicity above MIC leading to a less than 50% survival at concentrations of about four times MIC, while HAp(Ga)TR enabled a survivability comparable to HAp across the whole studied concentration range. Moreover, HAp(Ga)IE material with larger Ga content (16 wt%) was toxic already below MIC (less than 40% survivability at 0.05 g L−1 concentration, Fig. 10b). Nevertheless, a study of the influence of the Ga content in the HAp(Ga)IE material on its cytotoxicity (Fig. 10b) shows that by tuning the Ga3+ concentration optimal properties could also be achieved for the HAp(Ga)IE.


image file: c6ra23424k-f10.tif
Fig. 10 Cytotoxicity with respect to L929 mouse fibroblasts: (a) HAp(Ga)TR (MIC = 0.3 g L−1) in comparison with HAp(Ga)IE that contained 8 wt% Ga (MIC = 0.1 g L−1); (b) comparison of three HAp(Ga)IE with different Ga contents. MIC for the HAp(Ga)IE containing 6 wt% of Ga was 0.2 g L−1 (see ESI experimental details and Fig. S4). HAp was the negative control.

In order to explore the source of increased toxicity in the HAp(Ga)IE system, additional investigation of the contribution of the higher concentration of Ga3+ ions as well as the contribution of an additional surface amorphous GaPO4 phase present in the HAp(Ga)IE was performed. For that purpose, microdilution antibiograms and cytotoxicity tests were conducted on the Ga(NO3)3·xH2O and amorphous GaPO4, which was prepared by the precipitation of Ga(NO3)3 with a phosphate buffer (see ESI Experimental details, Fig. S5 and S6). The molar concentrations were calculated by assuming Ga(NO3)3·5.5H2O for gallium nitrate and GaPO4·2H2O for the amorphous phosphate. Gallium nitrate had a MIC at 0.075 g L−1 (211 μM) and gallium phosphate at 0.05 g L−1 (250 μM). On the other hand, the amorphous gallium phosphate was more toxic than the gallium nitrate, so that at a 500 μM concentration only about 40% of the cells were alive in the presence of gallium phosphate in comparison with about 70% of live cells in the presence of gallium nitrate. These results led us to the conclusion that the rapidly increasing toxicity of the HAp(Ga)IE system with increasing Ga content is driven by the presence of the surface amorphous GaPO4 phase.

Discussion

Our investigation of the incorporation of Ga3+ ions into hydroxyapatite during different stages of the material's synthesis led us to interesting correlations between the structure of the material and its physicochemical properties that significantly influence its interactions with bacterial and mammalian cells. Ga3+ ions have a strong effect on the growth of the apatite phase that results in important changes in the structural characteristics. Investigations led us to the mechanism for apatite formation, as illustrated in Fig. 11.
image file: c6ra23424k-f11.tif
Fig. 11 (a) Illustration of the structure of HAp(Ga) obtained by co-precipitation, transformation and ion exchange with Ga3+ ions and (b) the mechanism of formation of HAp(Ga)CP nanocrystals (b).

HAp(Ga) by co-precipitation

When Ga3+ ions had been added before the precipitation began so that the apatite was co-precipitated with them, they inhibited the growth of the HAp laths, which resulted in very small nanocrystals of HAp(Ga) with a large surface area that could adsorb a lot of water. This material is very similar to the recently reported Ga(III)-containing HAp, which was also obtained by co-precipitation, but via a different synthesis method, and as a part of a calcium phosphate cement enabled successful bone healing after being pre-sterilized and aseptically injected into the mouse bone.29 The initial addition of the Ga(NO3)3 into the mixture of apatite precursors results in a drop of the pH to 2.9 and the subsequent decomposition of urea increases this value to 6.1. In this weakly acidic environment, the precipitation of ACP is inhibited and the OCP phase, with stability in the pH range from 5.5 to 7.0,53 is formed. Due to the ability of Ga(III) to control the growth of the Ca-phosphate phase,25,26 these ions will bind to and incorporate into the initially formed OCP nuclei, which will limit their further growth (Fig. 11b). With a further increase in the pH obtained by the degradation of urea, the concentration of the formed OCP nuclei will increase and a part of the nuclei will be free of adsorbed Ga3+ ions. These Ga(III)-free OCP nuclei aggregate and grow into a crystalline octacalcium phosphate phase, which is a typical step for the growth mechanism of hydroxyapatite.54 However, Ga-containing OCP nuclei are not completely eliminated from the growth of the so-formed OCP crystals. Once they are formed from the Ga-free OCP nuclei, Ostwald ripening, which forces the ingrowth of smaller particles into the larger ones, will provide the attachment of Ga-containing OCP nuclei onto their surface. This is the critical step that will stop the further growth of the pre-formed OCP nanocrystals. During the transformation step the pH is increased to 7.1, which is in the pH stability range of the Ca-deficient HAp (pH = 6.5–9.5).53 The so-formed OCP nanocrystals are transformed into hydroxyapatite structure while the surface Ga-OCP layer participates in the formation of the disordered surface layer that contains Ga3+ ions. The obtained material has some properties that are very interesting for biomedical applications owing to the nanoscale size, the high surface area and the capability to adsorb a large quantity of water. It also provides a high degree of control over the release of Ga3+ ions. From this point of view, it can be efficiently applied as a bioactive agent that releases low concentrations of Ga3+ ions, which are capable of stimulating the differentiation and growth of mammalian cells. However, with a very high MIC of 0.9 g L−1, the HAp(Ga)CP material does not possess good self-protection against P. aeruginosa, so it is not an efficient antimicrobial agent.

HAp(Ga) by transformation

When Ga3+ ions were added to the mother liquid during the transformation step, they did not have such noticeable effect on the size of the HAp plate-like particles, which were similar to the pure HAp but with a more visible amorphous layer on the surface. Perhaps this layer increased the specific surface area of the HAp(Ga)TR laths to a two-times higher value with respect to the pure HAp reference. Due to the absence of the Ga3+ ions, the pH of the initial precursor mixture was 4.5. After the initiation of the gradual decomposition of urea, the pH slowly increases and precipitation of the apatite phase follows the usual growth mechanism by OCP nucleation and ingrowth into the OCP particles,55 which are not influenced by the Ga3+ ions. Because of the absence of the limitation influence of the Ga3+ ions, these particles grow into sub-micrometre-sized crystals. At the end of the precipitation step the pH of the mother liquid is 6.3, which is within the stability range of OCP.53 At this point the Ga3+ ions were added to the mother liquid. Their addition resulted in a decrease of the pH to 5.2, which is slightly below the stability range of OCP. We assume that this step resulted in the dissolution/transformation of the surface layer of the OCP crystals that induced the formation of the amorphous layer. Gallium ions can also substitute the Ca2+ ions in the OCP and precipitate with HPO42− and Ca2+ ions together, thus forming a mixed Ca/Ga amorphous phosphate (see ESI Fig. S7). These changes led to the increase of the pH in the mother liquid to 6.5, which is within the stability range of OCP and HAp. However, under these conditions HAp is more stable than OCP53 and the transformation step resulted in the solid-state transformation of the OCP to the Ca-deficient apatite structure coated by an amorphous Ca/Ga-phosphate layer. The so-formed material has very interesting properties regarding the interactions with bacterial and mammalian cells. It has the ability to controllably release Ga3+ ions within the bioactive range under simulated physiological conditions in a similar way to the previously discussed HAp(Ga)CP. However, since the surface amorphous layer represents a smaller part of the material in comparison with the nanocrystalline HAp(Ga)CP sample, a similar overall Ga content (3 vs. 4 wt%) means a larger amount of Ga(III) in the surface disordered layer in the case of the HAp(Ga)TR (Fig. 11a and ESI Table S2). This improved the antibacterial efficiency of the HAp(Ga)TR (three times lower MIC) against P. aeruginosa in comparison with the HAp(Ga)CP. At the same time the material did not express cytotoxic interactions with fibroblast cells for the wide concentration range, starting from the concentration that inhibits bacterial growth and up to the end of the studied concentration range (from 0.3 mg mL−1 (MIC) to 1 mg mL−1). From this point of view, the addition of Ga3+ ions during the transformation stage provided material with physicochemical properties that join together efficient antimicrobial activity and a high level of non-toxicity.

HAp(Ga) by ion exchange

In the third case the Ga3+ ions are introduced into the pre-formed apatite crystals and they do not have any influence, neither on the precipitation nor on the transformation of the apatite structures. In this case the apatite crystals are formed by the same synthesis as the pure HAp reference, which results in well-crystallized, sub-micrometre-sized plate-like particles,41 and Ga3+ ions are introduced by an ion-exchange procedure. The incorporation of Ga3+ ions into the hydroxyapatite during its synthesis is limited by their precipitation with PO43− and OH ions. Hence, the only way to incorporate larger amounts of Ga3+ ions is the ion exchange. However, this incorporation is limited by the low pH of the Ga(NO3)3 solution used as a medium for the exchange of the ions and may induce complete dissolution of hydroxyapatite. The addition of an aqueous solution of Ga(NO3)3 to HAp in the studied concentration range resulted in a reduced pH that triggered the dissolution of the HAp plate-like particles. The pH during the synthesis of the HAp(Ga)IE with 8 wt% of Ga raised from 4.75 to 5, while for the HAp(Ga)IE with 16 wt% it was raised from 2.96 to 3.23. At this pH, HAp is not the only thermodynamically stable Ca-phosphate phase and it can co-exist with another, CaHPO4·2H2O (DCPD) phase (with stability at a pH between 2 and 6).53 Mellier et al. have demonstrated that the mixing of DCPA with an aqueous solution of Ga(NO3)3 in this concentration range and Ga/Ca molar ratios higher than 0.075 results in the formation of amorphous GaPO4 with some Ca2+ ions inside the distorted brushite structure, which gives a peak at −6 ppm in the 31P NMR spectrum.29,31 It seems that the same phase can be obtained by mixing our Ca-deficient HAp with Ga(NO3)3. The presence of the additional amorphous GaPO4 phase at the surface of the HAp(Ga)IE significantly affected its properties under simulated physiological conditions and consequently influenced the interactions with bacterial and mammalian cells. The material was not able to provide the controlled release of Ga3+ ions and even showed a high initial burst release. Furthermore, in proportion to the larger content of incorporated Ga(III), the material's MIC was significantly reduced in comparison with the MIC of HAp(Ga)TR to a three times lower value against P. aeruginosa. However, it also increased the cytotoxicity. Although the percentage of the surviving cells was high at MIC, their rate dropped rapidly at higher concentrations. Nevertheless, since the HAp(Ga)IE and HAp(Ga)TR were morphologically similar, we believe that optimum biological response for HAp(Ga)IE could be achieved at a similar Ga(III) content (around 4 wt%) as for the HAp(Ga)TR. Further investigations will be needed to confirm this.

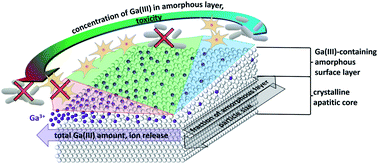
HAp(Ga) by co-precipitation and transformation had a similar overall Ga content but a different morphology. Co-precipitation led to very small HAp(Ga) nanocrystals with a large fraction of the amorphous surface layer that contained a low amount of Ga(III). The addition of Ga3+ ions during transformation did not affect the size of the HAp crystals and resulted in sub-micrometre-sized HAp(Ga) laths with a similar overall Ga content, but a smaller fraction of the amorphous surface layer, which therefore contained a larger amount of Ga(III). HAp(Ga) by ion exchange had a morphology similar to HAp(Ga) by transformation but higher overall Ga content and hence an even larger amount of Ga(III) incorporated within the amorphous surface layer, The HAp(Ga) materials obtained by co-precipitation or transformation were capable of the controlled release of Ga3+ ions in the bioactive concentration range, whereas HAp(Ga) obtained by the ion exchange could not control the Ga3+ release, which contributed to an increase of both the antimicrobial and the cytotoxic effects. However, the HAp(Ga) by transformation exhibited a much better antibacterial action than the HAp(Ga) by co-precipitation, which indicates that the ion release is not the main property that determines the HAp(Ga) toxicity, but rather the composition of the amorphous surface layer.

How could the chemical composition of the surface layer influence the antibacterial action and toxicity? A sound explanation of the “contact-based” mechanism of doped hydroxyapatite materials has recently been provided for the silver-doped hydroxyapatite using the electric double layer model.56 Upon contact with the material, cell membrane/wall is exposed to Ag+ ions in the Stern layer, where their concentration is much higher than the average concentration of released Ag+ ions in the medium.56 In their calculations, the authors assumed that the Ag+ ions were the only positively charged species that shielded the negative charge of the material and supported this assumption by the larger solubility of Ag salts than Ca salts.56 Similar concept could be applied also to the HAp(Ga) materials, but due to ACP-like or distorted brushite-like structure of the amorphous surface layer, which is more soluble than hydroxyapatite,18 and low solubility of Ga salts2 the Stern layer would be populated with Ga3+ as well as Ca2+ ions. Thus, the Ga3+ concentration in the Stern layer, to which cell membrane would be exposed in contact with the HAp(Ga), would reflect the chemical composition of the amorphous surface layer, i.e., the fraction of Ga(III) in this layer. In fact, not only free (hydrated) cations could exist in the electric double layer, but also other positively as well as negatively charged and neutral Ga(III) moieties, such as complexated/chelated ions or GaPO4 molecules. The method used here for determining the released Ga3+ ions cannot distinguish among these various Ga(III) solutes. Hence, we should not exclude the possibility that the different HAp(Ga) materials release different Ga(III) species, among which some are more toxic than others. It is known that some forms of Ga(III) are stronger antimicrobials than others and some forms are more cytotoxic than others.12,57 In this view, the nature of the surface disordered Ca/Ga phosphate layer governs the nature of the released Ga(III), which is concentrated in the electric double layer, and consequently the antibacterial and biocompatible properties.

Conclusions

We investigated in detail the incorporation of Ga3+ ions into hydroxyapatite and its influence on the in vitro antibacterial properties against P. aeruginosa and cytotoxicity for mouse L929 fibroblasts. Ga3+ ions are incorporated within the amorphous surface layer of the apatite leaving the inner apatitic crystal non-doped and unchanged. However, their incorporation converts part of the crystalline core to the amorphous Ca/Ga phosphate and thus increases the amorphous surface layer, especially at higher Ga(III) concentrations.

Biointerface of the Ga(III)-containing hydroxyapatite is determined by the composition of the amorphous surface layer. This composition can be changed by varying the added amount of Ga(III) or by varying the size of the HAp(Ga) particles, which can also be controlled by adding Ga3+ ions at different stages during the synthesis of the hydroxyapatite. By tuning the composition of the amorphous Ca/Ga phosphate surface layer and the overall Ga content of the HAp(Ga), it is possible to achieve the release of Ga3+ ions in the bioactive range, low toxicity and efficient antibacterial protection at the same time, which is the ideal biological response to the Ga(III)-containing hydroxyapatite.

Acknowledgements

We appreciate the financial support of the Slovenian Research Agency (financing of young researchers) and the SCOPES (Scientific co-operation between Eastern Europe and Switzerland) project no. IZ73Z0 152327.

References

  1. E. Frangipani, C. Bonchi, F. Minandri, F. Imperi and P. Visca, Antimicrob. Agents Chemother., 2014, 58, 5572–5575 CrossRef PubMed.
  2. L. R. Bernstein, Pharmacol. Rev., 1998, 50, 665–682 CAS.
  3. C. R. Chitambar, Int. J. Environ. Res. Public Health, 2010, 7, 2337–2361 CrossRef CAS PubMed.
  4. P. Collery, B. Keppler, C. Madoulet and B. Desoize, Crit. Rev. Oncol. Hematol., 2002, 42, 283–296 CrossRef PubMed.
  5. Y. Kaneko, M. Thoendel, O. Olakanmi, B. E. Britigan and P. K. Singh, J. Clin. Invest., 2007, 117, 877–888 CrossRef CAS PubMed.
  6. A. Ross-Gillespie, M. Weigert, S. P. Brown and R. Kümmerli, Evol. Med. Public Health, 2014, 2014, 18–29 CrossRef PubMed.
  7. C. Bonchi, F. Imperi, F. Minandri, P. Visca and E. Frangipani, BioFactors, 2014, 40, 303–312 CrossRef CAS PubMed.
  8. D. Campoccia, L. Montanaro and C. R. Arciola, Biomaterials, 2006, 27, 2331–2339 CrossRef CAS PubMed.
  9. D. Chenier, R. Beriault, R. Mailloux, M. Baquie, G. Abramia, J. Lemire and V. Appanna, Appl. Environ. Microbiol., 2008, 74, 3977–3984 CrossRef CAS PubMed.
  10. O. Olakanmi, B. E. Britigan and L. S. Schlesinger, Infect. Immun., 2000, 68, 5619–5627 CrossRef CAS PubMed.
  11. K. DeLeon, F. Balldin, C. Watters, A. Hamood, J. Griswold, S. Sreedharan and K. P. Rumbaugh, Antimicrob. Agents Chemother., 2009, 53, 1331–1337 CrossRef CAS PubMed.
  12. O. Rzhepishevska, B. Ekstrand-Hammarström, M. Popp, E. Björn, A. Bucht, A. Sjöstedt, H. Antti and M. Ramstedt, Antimicrob. Agents Chemother., 2011, 55, 5568–5580 CrossRef CAS PubMed.
  13. E. Banin, A. Lozinski, K. M. Brady, E. Berenshtein, P. W. Butterfield, M. Moshe, M. Chevion, E. P. Greenberg and E. Banin, Proc. Natl. Acad. Sci. U. S. A., 2008, 105, 16761–16766 CrossRef CAS PubMed.
  14. S. P. Valappil, D. Ready, E. A. Abou Neel, D. M. Pickup, L. A. O'Dell, W. Chrzanowski, J. Pratten, R. J. Newport, M. E. Smith, M. Wilson and J. C. Knowles, Acta Biomater., 2009, 5, 1198–1210 CrossRef CAS PubMed.
  15. S. P. Valappil, H. H. P. Yiu, L. Bouffier, C. K. Hope, G. Evans, J. B. Claridge, S. M. Higham and M. J. Rosseinsky, Dalton Trans., 2013, 42, 1778–1786 RSC.
  16. A. B. Kelson, M. Carnevali and V. Truong-Le, Curr. Opin. Pharmacol., 2013, 13, 707–716 CrossRef CAS PubMed.
  17. F. Barrère, C. A. van Blitterswijk and K. de Groot, Int. J. Nanomed., 2006, 1, 317–332 Search PubMed.
  18. S. V. Dorozhkin, J. Mater. Sci., 2007, 42, 1061–1095 CrossRef CAS.
  19. P. Wang, L. Zhao, J. Liu, M. D. Weir, X. Zhou and H. H. K. Xu, Bone Res., 2014, 2, 14017 CrossRef CAS PubMed.
  20. S. V. Dorozhkin, Materials, 2009, 2, 399–498 CrossRef CAS.
  21. M. Epple, K. Ganesan, R. Heumann, J. Klesing, A. Kovtun, S. Neumann and V. Sokolova, J. Mater. Chem., 2010, 20, 18–23 RSC.
  22. M. P. Ginebra, C. Canal, M. Espanol, D. Pastorino and E. B. Montufar, Adv. Drug Delivery Rev., 2012, 64, 1090–1110 CrossRef CAS PubMed.
  23. P. Melnikov, A. R. Teixeira, A. Malzac and M. B. Coelho, Mater. Chem. Phys., 2009, 117, 86–90 CrossRef CAS.
  24. R. S. Bockman, A. L. Boskey, N. C. Blumenthal, N. W. Alcock and R. P. Warrell, Calcif. Tissue Int., 1986, 39, 376–381 CrossRef CAS PubMed.
  25. R. Donnelly and A. Boskey, Calcif. Tissue Int., 1989, 44, 138–142 CrossRef CAS PubMed.
  26. N. C. Blumenthal, V. Cosma and S. Levine, Calcif. Tissue Int., 1989, 45, 81–87 CrossRef CAS PubMed.
  27. M. Korbas, E. Rokita, W. Meyer-Klaucke and J. Ryczek, J. Biol. Inorg. Chem., 2004, 9, 67–76 CrossRef CAS PubMed.
  28. C. Jäger, T. Welzel, W. Meyer-Zaika and M. Epple, Magn. Reson. Chem., 2006, 44, 573–580 CrossRef PubMed.
  29. C. Mellier, F. Fayon, F. Boukhechba, E. Verron, M. LeFerrec, G. Montavon, J. Lesoeur, V. Schnitzler, D. Massiot, P. Janvier, O. Gauthier, J. M. Bouler and B. Bujoli, Acta Biomater., 2015, 24, 322–332 CrossRef CAS PubMed.
  30. B. Bujoli, J. M. Bouler, P. Janvier, I. Khairoun and V. Schnitzler, WO/2010/100209, 2010.
  31. C. Mellier, F. Fayon, V. Schnitzler, P. Deniard, M. Allix, S. Quillard, D. Massiot, J. M. Bouler, B. Bujoli and P. Janvier, Inorg. Chem., 2011, 50, 8252–8260 CrossRef CAS PubMed.
  32. M. Vukomanović, U. Repnik, T. Zavašnik-Bergant, R. Kostanjšek, S. D. Škapin and D. Suvorov, ACS Biomater. Sci. Eng., 2015, 1, 935–946 CrossRef.
  33. A. Ewald, D. Hösel, S. Patel, L. M. Grover, J. E. Barralet and U. Gbureck, Acta Biomater., 2011, 7, 4064–4070 CrossRef CAS PubMed.
  34. A. Peetsch, C. Greulich, D. Braun, C. Stroetges, H. Rehage, B. Siebers, M. Köller and M. Epple, Colloids Surf., B, 2013, 102, 724–729 CrossRef CAS PubMed.
  35. Y. Li, J. Ho and C. P. Ooi, Mater. Sci. Eng., C, 2010, 30, 1137–1144 CrossRef CAS.
  36. P. Melnikov, V. A. Nascimento and L. Z. Z. Consolo, J. Therm. Anal. Calorim., 2012, 107, 1117–1121 CrossRef CAS.
  37. Š. Miklavič, P. Kogovšek, V. Hodnik, J. Korošec, A. Kladnik, G. Anderluh, I. Gutierrez-Aguirre, P. Maček and M. Butala, FEMS Microbiol. Lett., 2015, 362, fnv069 CrossRef PubMed.
  38. L. Cao, Z. Chuan-bo and H. Jian-feng, Mater. Lett., 2005, 59, 1902–1906 CrossRef CAS.
  39. L. Cao, C. Zhang and J. Huang, Ceram. Int., 2005, 31, 1041–1044 CrossRef CAS.
  40. M. Jevtić and D. Uskoković, Mater. Sci. Forum, 2007, 555, 285–290 CrossRef.
  41. M. Jevtić, M. Mitrić, S. Škapin, B. Jančar, N. Ignjatović and D. Uskoković, Cryst. Growth Des., 2008, 8, 2217–2222 Search PubMed.
  42. Z. Marczenko and M. Balcerzak, in Separation, Preconcentration and Spectrophotometry in Inorganic Analysis, Elsevier, 1st edn, 2000, vol. 10, ch. 21, pp. 198–203 Search PubMed.
  43. I. R. Gibson, I. Rehman, S. M. Best and W. Bonfield, J. Mater. Sci.: Mater. Med., 2000, 12, 799–804 CrossRef.
  44. A. Destainville, E. Champion, D. Bernache-Assollant and E. Laborde, Mater. Chem. Phys., 2003, 80, 269–277 CrossRef CAS.
  45. C. J. Liao, F. H. Lin, K. S. Chen and J. S. Sun, Biomaterials, 1999, 20, 1807–1813 CrossRef CAS PubMed.
  46. S. C. Liou and S. Y. Chen, Biomaterials, 2002, 23, 4541–4547 CrossRef CAS PubMed.
  47. G. Celotti, A. Tampieri, S. Sprio, E. Landi, L. Bertinetti, G. Martra and C. Ducati, J. Mater. Sci.: Mater. Med., 2006, 17, 1079–1087 CrossRef CAS PubMed.
  48. S. Somrani, C. Rey and M. Jemal, J. Mater. Chem., 2003, 13, 888–892 RSC.
  49. M. M. Beasley, E. J. Bartelink, L. Taylor and R. M. Miller, J. Archaeol. Sci., 2014, 46, 16–22 CrossRef CAS.
  50. J. D. Pasteris, B. Wopenka, J. J. Freeman, K. Rogers, E. Valsami-Jones, J. A. M. Van Der Houwen and M. J. Silva, Biomaterials, 2004, 25, 229–238 CrossRef CAS PubMed.
  51. E. E. Wilson, A. Awonusi, M. D. Morris, D. H. Kohn, M. M. J. Tecklenburg and L. W. Beck, Biophys. J., 2006, 90, 3722–3731 CrossRef CAS PubMed.
  52. Y. Wang, S. Von Euw, F. M. Fernandes, S. Cassaignon, M. Selmane, G. Laurent, G. Pehau-Arnaudet, C. Coelho, L. Bonhomme-Coury, M.-M. Giraud-Guille, F. Babonneau, T. Azaïs and N. Nassif, Nat. Mater., 2013, 12, 1144–1153 CrossRef CAS PubMed.
  53. S. V. Dorozhkin and M. Epple, Angew. Chem., Int. Ed. Engl., 2002, 41, 3130–3146 CrossRef CAS.
  54. S. V. Dorozhkin, Biomatter, 2011, 1, 121–164 CrossRef PubMed.
  55. M. S. Johnsson and G. H. Nancollas, Crit. Rev. Oral Biol. Med., 1992, 3, 61–82 CAS.
  56. C. Shi, J. Gao, M. Wang, Y. Shao, L. Wang, D. Wang and Y. Zhu, Biomater. Sci., 2016, 4, 699–710 RSC.
  57. F. Minandri, C. Bonchi, E. Frangipani, F. Imperi and P. Visca, Future Microbiol., 2014, 9, 379–397 CrossRef CAS PubMed.

Footnote

Electronic supplementary information (ESI) available: TEM analysis of the pure HAp reference; crystallinity determination from the XRD; 1H MAS NMR spectra, fitting of the 31P MAS NMR spectra and calculation of the fraction of the amorphous surface layer, its Ga(III) content and composition from the fits; microdilution antibiogram for the HAp(Ga)IE sample with 6 wt% of Ga; details about the antibacterial activity and cytotoxicity comparison of gallium nitrate and amorphous gallium phosphate; XRD analysis that shows disappearance of the OCP phase and increase of the amorphous background after mixing with Ga(NO3)3. See DOI: 10.1039/c6ra23424k

This journal is © The Royal Society of Chemistry 2016