Decoration of GO with Fe spinel-Naf/DMAP: an electrochemical probe for sensing H2O2 reduction

Manorama Singh*a, Smita R. Bhardiyaa, Hemant Kashyapa, Fooleswar Vermaa, Vijai K. Raia and I. Tiwarib
aDepartment of Chemistry, School of Physical Sciences, Guru Ghasidas Vishwavidyalaya, Bilaspur-495009, India. E-mail: manoramabhu@gmail.com; Tel: +91-7587401982
bDepartment of Chemistry, Faculty of Science, Banaras Hindu University, Varanasi-221005, India

Received 20th September 2016 , Accepted 22nd October 2016

First published on 24th October 2016


Abstract

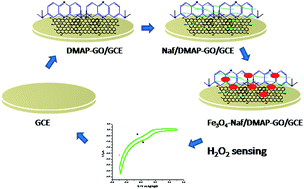
We herein report the preparation of graphene oxide decorated with Fe spinel (Fe3O4)-Naf/DMAP for an unprecedented and highly selective non-enzymatic electrochemical sensing of hydrogen peroxide reduction. The linking of 3,7-bis (dimethylamino)-phenothiazin-5-ium chloride (DMAP) to the graphene oxide occurred via electrostatic interactions of the cationic organic compound with negatively charged oxygen-containing groups (–COO and –O) available on the edges of the graphene oxide. Fe3O4 (Fe2+, Fe3+) nanoparticles were adhered further on SO3 moieties of the Nafion coated over the DMAP-GO/GCE through electrostatic interactions. This green approach was used to prepare a derived graphene oxide hybrid nano-material. This material was characterized using scanning electron microscopy (SEM), transmission electron microscopy (TEM), Fourier transform infrared spectroscopy (FTIR), UV-visible spectroscopy, X-ray diffraction (XRD), and cyclic voltammetry (CV). The prepared material was utilized to detect H2O2 subjected to electrocatalytic reduction and to determine its concentration in the linear range of 5.5 μM to 2.4 mM. Nafion was employed as a dispersion medium, and an anchor for Fe3O4 to make the composite and to prevent interfering effects of other metabolites. The detection limit of this highly selective and highly reproducible film was estimated to be 0.6 μM with a sensitivity of 32.0 μA mM−1 cm−2.


Introduction

Hydrogen peroxide (H2O2) plays a key role in the human immune system. The concentration of hydrogen peroxide has been found to be increased at damaged tissues, and this increase provides a signal for white blood corpuscles to congregate on that site and to initiate the healing process. Due to this process, asthmatic patients have higher levels of hydrogen peroxide in their lungs than do healthy people, and these higher levels indicate the presence of inappropriate levels of white blood corpuscles in their lungs. Hydroxy and superoxide radical by-products of the cellular metabolism of hydrogen peroxide have also been shown to be linked to aging and cancer.1–3 Several methods are available for detecting hydrogen peroxide, and the use of electrochemical sensors is among the easiest and most sensitive of these methods. To date, several enzymatic electrochemical sensors of hydrogen peroxide have been reported,4,5 but the most common concerns are their high cost, limited lifetime, poor reproducibility and low selectivity. Therefore, nowadays, the development of non-enzymatic H2O2 electrochemical sensors has been garnering attention, in particular for reducing the over-potential and providing improved selectivity towards the reduction of H2O2. The general hope regarding non-enzymatic sensors is to fabricate a material with some unique compatible properties instead of with an enzyme to improve the performance of the sensor.6,7 But most reported sensors have shown some problems with regards to detection potential, limit of detection and selectivity. Therefore, it remains essential to develop a way to fabricate a highly selective and reliable electrochemical sensor of H2O2 with a wide linear range and improved electrocatalytic activity.

Graphene consists of an essentially two-dimensional (2-D), mono-atomic layer of carbon materials, and acts as a “magic sheet”. It has garnered global attention due to its excellent electron transport rate, high surface area to volume ratio, high electrical conductivity, good biocompatibility, and exceptional thermal stability. Due these properties, graphene has become an extensively utilized electrode material for several electrochemical applications.8 Graphene oxide is a type of graphene derivative, and includes several oxygen-containing functional moieties, specifically hydroxyl (–OH) and carboxylic (–COOH) groups on the edges of the sheet and epoxide groups (–O–) on its surface, and is synthesized via chemical exfoliation of pristine graphene. Due to its many available oxygen-containing moieties, graphene oxide has a strongly hydrophilic nature.9 However, its low electrical conductivity, due to the presence of sp3 hybridized carbons, is a considerable challenge. Therefore, a major focus of advance materials research nowadays is on doped or functionalized graphene oxide. Functionalization of graphene derivatives with electron-rich aromatic organic compounds, metal nanoparticles, metal oxide nanoparticles, conducting polymers,10 etc. is of particular interest.

Functionalization may be accomplished by using covalent and non-covalent methods.11 Non-covalent methods are “green methods” involving the formation of pi–pi interactions, electrostatic interactions, hydrophobic interactions, H-bonds, etc. that do not disturb the original graphene oxide skeleton.

The compound 3,7-bis (dimethylamino)-phenothiazin-5-ium chloride (DMAP) is a typical heterocyclic conjugate azo dye, has been well established as an electroactive molecule, and has been used for the reduction of hydrogen peroxide. Electrostatic non-covalent interactions of low molecular weight form of DMAP with GO prevent the leaching of DMAP molecules from the electrode.12 ‘Spinels’ constitute one of the most interesting sensor material candidates.13,14 Iron oxide nanoparticles (Fe3O4, iron spinel) constitute the most useful metal oxide dopant due to their low cost, potential non-toxicity, high electronic conductivity, easy degradability and bio-compatible nature.15,16 Fe3O4 has an inverse spinel structure with oxygen, forming a face-centred cubic crystal system. Here, all tetrahedral sites are occupied by Fe3+, and octahedral sites are occupied by both Fe2+ and Fe3+ several methods17,18 are available for the synthesis of Fe spinel. But the most popular method is co-precipitation, which allows for a cost-effective synthesis of Fe3O4 in an aqueous medium. High temperatures and long reaction times process of other methods can partly or completely reduce GO.19 Co-precipitation is an economical and green method, and achieves high selectivity and atom economy.20,21 Nafion (Naf, a fluoropolymer–copolymer based on sulfonated tetrafluoroethylene) has been utilized as an anionic membrane to anchor Fe3O4, and forms a dispersion medium to stabilize the composite film and to reduce the effects of several interfering compounds.

Prompted by the above issues and our interest to develop novel chemical processes, especially green protocols,22 we herein report a simple and efficient route to fabricate a stable iron-spinel-decorated Naf/DMAP-linked graphene oxide (Fe3O4-Naf/DMAP-GO) nanocomposite film highly selective for the nonenzymatic electrochemical sensing of hydrogen peroxide (Fig. 1).


image file: c6ra23409g-f1.tif
Fig. 1 Schematic representation of modification of GC with an Fe3O4-decorated Naf/DMAP-linked GO film.

Results and discussion

Generally, the hydrogen peroxide becomes reduced at −0.55 V vs. Ag/AgCl on unmodified GC electrode. Various metabolites viz., ascorbic acid and dopamine interfere with the reduction of hydrogen peroxide at this quite negative potential. At the outset, our strategy involved the design and preparation of materials that not only enabled H2O2 to be the target of a non-enzymatic sensing probe but also acted as a highly selective and efficient alternative to reduce the over-potential. For this purpose, we exploited the synergistic effect of GO and Fe3O4 in Nafion films by fabricating a variety of novel and efficient materials. After some exhaustive preliminary experiments, we prepared the Fe3O4-decorated Naf/DMAP-linked graphene oxide (Fe3O4-Naf/DMAP-GO) nanohybrid film, by using a green and novel protocol from the literature. Furthermore, hydrogen peroxide on a glassy carbon electrode with the Fe3O4-decorated Naf/DMAP linked graphene oxide nanohybrid film was tested for electrochemical sensing experiments, and the prepared peroxide sensing probe successfully shifted the reduction potential towards the positive direction up to the limit required for avoiding interference by other metabolites. The reduction of H2O2 was triggered at 0.009 V at scan rate 5 mV s−1 (vs. Ag/AgCl), which showed a high positive potential for the sensing of 0.08 mM (curve b) and 0.19 mM H2O2 (curve c) (Fig. 2). Thus, to the best of our knowledge, the magnitude of our shift of the reduction potential in the positive direction was greater than any such value reported in the literature so far.23–31 The anodic peak current was found to decrease dramatically while the cathodic peak current started increasing, and the reduction peak attained a maximum at −0.08 V vs. Ag/AgCl. The presence of Fe3O4 nanoparticles with Naf/DMAP-linked GO facilitated electron transfer and reduced the over-potential for the electrocatalytic sensing of H2O2. The synergistic effect of the different components in the hybrid material electrocatalysed the reduction of H2O2 as well as improving the performance of the film.
image file: c6ra23409g-f2.tif
Fig. 2 Electrocatalytic reduction of (a) without H2O2 (b) 0.08 mM and (c) 0.19 mM H2O2 by a Fe3O4-Naf/DMAP-GO-modified GCE in the presence of in 0.1 M PBS, pH 6.0 (inset: calibration curve).

We also investigated the extent to which some electroactive organic molecules such as ascorbic acid, dopamine etc. interfere (Fig. 3). Herein, Nafion acted as a protective film, preventing interference by these other metabolites. At a very high positive potential, other metabolites such as glucose, L-lactase, and oxalic acid could also not cause a poor selectivity of the film. The current in the figure showed that none of these metabolites caused noticeable changes in the current, which clearly indicated their negligible effect on their response to H2O2. The electrochemistry of the Fe3O4-Naf/DMAP-G-modified GC electrode was affected by the pH of the phosphate-buffered saline working solution. The changes in the cathodic current on Fe3O4-Naf/DMAP-GO-modified GC electrode were optimized in the pH range of 4.5 to 9.0 with 0.1 M phosphate-buffered saline. The cathodic peak current increased as the pH was increased from 4.0 to 6.0 and subsequently started decreasing as the pH was further increased up to value of 9. In other words, the maximum cathodic peak current was observed at pH 6.0. Therefore, a pH of 6.0 with 0.1 M PBS was found to be a suitable supporting electrolyte for further studies. The calibration curve (inset to Fig. 2) was plotted as current vs. concentration of H2O2 by successive addition of different concentrations of H2O2. It showed a linear relationship in the range from 5.5 μM to 2.4 mM. The linear regression equation was found to be (μA) = 32.0[H2O2] + 0.207, with R2 = 0.996. The limit of detection was estimated by using the equation32 LOD = 3SB/S, where SB is the standard deviation of the blank, and S is the slope of the calibration curve.


image file: c6ra23409g-f3.tif
Fig. 3 Cyclic voltammogram of Fe3O4-Naf/DMAP-GO modified GCE in presence of various interfering compounds in 0.1 M PBS, pH 6.0.

The sensitivity of the electrode was observed to be 32.0 μA mM−1 cm−2, which was much better than previously reported values of 1.4 mA μM−1 cm−2,33 14.5 μA mM−1 cm−2,34 0.7367 μA mM−1 cm−2,35 and 0.7459 μA mM−1 cm−2.36 The estimated limit of detection was 0.6 μM with an S/N = 3; this limit of detection was lower than those of the previously reported investigations,23–31,37–44 as shown in Table 1. The reproducibility of the detection of 0.19 mM H2O2 was investigated with five successive measurements and the determined relative standard deviation (RSD) of the cathodic peak current was calculated to be 4.8%. This electrode can be stored in a refrigerator for 30 days at 4 °C when not in use. The stability of the modified electrode was investigated after 30 days of storage and the current responses decreased by less than 9% of its original response detected for the same H2O2 sample. This result indicated the good reproducibility and stability of the proposed hybrid film. In order to determine the practicality of the present sensor, a 0.01% commercial antiseptic solution was analysed. The recovery of this solution was determined to be 0.0029 ± 0.007 M for n = 3 with an RSD value 8.4%.

Table 1 Comparison of different electrodes for hydrogen peroxidea
Electrodes Linear range Detection limit (μM) Detection potential (V) vs. Ag/AgCl Ref.
a Abbreviations: rGO: reduced graphene oxide, AgNP: silver nanoparticles, GCE: glassy carbon electrode, Naf: Nafion, AzI: azure I, AuNP: gold nanoparticles, AuNRs: gold nanorods, PDDA: poly(diallyldimethylammonium) chloride, G: graphene, MWCNT: multiwalled carbon nanotube, Memb: membrane, GR: graphene, AgNCs: silver nanocrystals, CS: chitosan, GNPs: gold nanoparticles, PtNPs: platinum nanoparticles, NPG: nanoporous gold.
AgNP/rGO/GCE 100 μM to 100 mM 31.3 μM −0.30 23
AgNP/rGO/GCE 50 μM to 5 mM 10.0 μM −0.43 24
GR/Naf/AzI/AuNPs/GCE 30 μM to 5 mM 10.0 μM −0.20 25
GR-AuNRs/GCE 30 μM to 5 mM 10.0 μM −0.55 26
PDDA-G/GCE 0.02–1.8 mM 8.0 μM −0.36 27
GR-MWCNT/GCE 20 μM to 2.1 mM 9.4 μM −0.40 28
NPG/PtNPs microelectrode 0.3 nM −0.20 29
Cu2O/Naf/GCE 1–22 μM 0.039 μM −0.2 30
3DGN/PtNP 0.38–13.46 μM 0.27 μM 31
Ag-nanofibrous memb/GCE 10 μM to 16.5 mM 4.0 μM 37
Graphene–AgNCs 20 μM to 10 mM 3.0 μM −0.50 38
GNPs/GN-CS/GCE 5 μM to 35 mM 1.6 μM −0.19 39
α-Fe2O3/rGO 5 μM to 4.495 mM 1.0 μM −0.22 40
Poly-melamine/PtNPs/GCE 5–1650 μM 0.65 μM 41
Fe3O4–Fe2O3/film 0.2 mM −0.3 42
Fe3O4 film 1.0 μM −0.4 43
Fe3O4 0.2 mM −1.0 44
Fe3O4-Naf/DMAP-GO modified GCE 5.5 μM to 2.4 mM 0.6 μM −0.08 Present work


An electrochemistry investigation was performed using Naf/GO/Fe3O4, Naf/DMAP-GO, Fe3O4-Naf/DMAP and Fe3O4-Naf/DMAP-GO-modified GC electrodes in 0.1 M, pH 6.0 phosphate buffer saline (PBS). No redox peak was observed with the Naf/GO-modified GCE (not shown). The heights of the cathodic and anodic peak currents (curve b) for the Fe3O4-Naf/DMAP-GO-modified GC electrode (Fig. 4) were much better than those of the peak currents of Naf/DMAP-GO-modified GC (curve a) in the range of −0.50 V to 0.30 V. An oxidation wave was observed at 0.023 V and the reduction wave was at −0.111 V, at a scan rate 50 mV s−1 (vs. Ag/AgCl). The peak separation (ΔE) was calculated to be 0.134 V at 5 mV s−1 (vs. Ag/AgCl), indicating its quasireversible behavior. The observed current ratio was 0.9 (Ipa/Ipc = 1.09/1.20) and half wave potential (E1/2) calculated for the GCE modified with the hybrid material film was −0.044 V (vs. Ag/AgCl), indicative of the improved electrochemistry of the nanohybrid. The electrostatic adsorption of positively charged DMAP on graphene oxide was achieved due to the availability of many oxygen-containing groups; i.e., carboxylic (COO–) and hydroxyls (O–)45 were available at the edges of the GO. Furthermore, Fe3O4 consisting of Fe2+ and Fe3+ again electrostatically interacted with the sulphonic groups available on Nafion and formed an Fe3O4-Naf/DMAP-GO electroactive film (Scheme 1).


image file: c6ra23409g-f4.tif
Fig. 4 Cyclic voltammogram of (a) the Naf/DMAP-GO-modified GCE, and (b) the Fe3O4-Naf/DMAP-GO-modified GC electrode at 50 mV s−1 in 0.1 M PBS, pH 6.0; inset: Randell Sevik plot.

image file: c6ra23409g-s1.tif
Scheme 1 Schematic presentation of the fabricated film.

This protective Nafion film was employed to stabilize the interactions as well as to prevent the influence of interfering compounds. The synergistic effect of the decorated Fe3O4 nanoparticles over the Nafion-dispersed DMAP-linked GO uniformly helped in amplifying the cathodic and anodic peak currents. The surface coverage area for the modified electrode was calculated using the equation Γaq = Q/nFA,46 where Q is the charge obtained by integrating the cathodic peak at a low voltage scan rate (5 mV s−1), n is the number of electrons involved per DMAP molecule (n = 2) and A (cm2) is the area of the electrode area. The surface coverage area was calculated to be 6.81 × 10⁻⁸ mol cm−2. The plot of current vs. scan rate was a straight line, indicating that a surface-controlled process was involved in the electrochemistry (inset to Fig. 4). The regression equations for the cathodic peak current (Ipc) and anodic peak current (Ipa) were determined to be Ipc (μA) = 15.46x + 0.347, with an R2 of 0.996, and Ipa (μA) = −18.98x − 0.195, with an R2 of 0.997, respectively. The effect of variable scan rates on the peak currents was investigated on the GC electrode modified with the Fe3O4-Naf/DMAP-GO hybrid film in the range of 5–400 mV s−1 (vs. Ag/AgCl) (Fig. 5A). The separation of the peak currents also increased as the scan rates were increased, which also supported its quasireversible nature. The electron transfer coefficient (α) and heterogeneous electron transfer rate constant (ks) [Fig. 5B] have been calculated using the Lavron equation47 log[thin space (1/6-em)]ks = α[thin space (1/6-em)]log(1 − α) + α(1 − α)log[thin space (1/6-em)]α − log(RT/nFν) − α(1 − α)nFΔEp/2.3RT (where, T = 298 K, ν = scan rate, ΔEp = peak separation, R = 8.314 J mol−1 K−1). The calculated α and ks were 0.7 and 2.6 s−1, respectively, which were higher than other reported work.48 These results demonstrated the efficient electron transfer and improved electrochemistry of the proposed modified GC electrode.


image file: c6ra23409g-f5.tif
Fig. 5 (A) Cyclic voltammograms of Fe3O4-Naf/DMAP-GO-modified GCE at 5, 10, 20, 50, 100, 200, 300, and 400 mV s−1 in 0.1 M PBS, pH 6.0. (B) Plot of peak potential (Ep) vs. logarithm of scan rate (log[thin space (1/6-em)]ν).

Synthesis and characterization

General

Graphite (100 μm particle size; purity 99.5%) and Nafion (5% v/v) were purchased from Aldrich (USA), and DMAP from Merck, India. Ferrous ammonium sulphate (FAS), FeCl3 and NaOH were purchased from S D Fine-Chem Ltd. Aqueous solutions were prepared using deionized water. All other chemicals employed were of analytical grade. The electrochemical measurements were performed with a CHI610E series (CH Instruments, USA) electrochemical workstation. Electrochemical studies were performed with a three-electrode system comprising the nanohybrid film modified glassy carbon (GC) electrode (active surface area: 2 mm2) as a working electrode, an Ag/AgCl reference electrode and a platinum (Pt) wire as the counter electrode. All electrochemical measurements were carried out in 4 mL of 0.1 M phosphate-buffered saline (PBS), pH 6.0. The whole assembly was de-aerated by purging it with nitrogen gas for 15 minutes before the experiments. All of the electrochemical experiments were performed at room temperature (∼25 °C). Morphological studies were done by carrying out scanning electron microscopy (using a Vega 3 TESCAN) and transmission electron microscopy (using Tecnai G2) experiments. UV-visible spectroscopic studies were performed with a Shimadzu UV-visible spectrophotometer. Fourier transform infra red (FTIR) spectroscopic characterizations were done in KBr pallets (Varian 3100). X-ray diffraction (XRD) patterns were obtained using a PANalytical 3 KW X'pert powder X-ray diffractometer operated at 40 kV and 30 mA with Cu-Kα radiation (λ = 0.1540598 nm) from 5–90°.

Preparation of the GC electrode modified with an Fe3O4-Naf/DMAP-GO nanohybrid film

Graphene oxide was prepared from purified graphite using the well-known modified Hummers' method.49 A mass of 0.5 g of graphite was slowly added into a stirred 15 mL conc. H2SO4 solution and further stirred for 5 min. A mass of 2.5 g KMnO4 was added very slowly to the suspension with continuous stirring for 1 h at 35 °C. Then a volume of 46 mL of DI water was added and stirred for 4 h at 98 °C. The suspension became pasty and grey. A volume of 60 mL of water was then slowly added into the mixture, which was then treated with 3 mL of 30% H2O2 to reduce the residual permanganate and MnO2. The suspension was centrifuged, filtered and washed with 1 M HCl. After that, suspension was then washed with 30 mL of warm de-ionized water and dried at 50 °C in a vacuum oven. A mass of 100 mg of prepared GO was dispersed in 150 mL of de-ionized water, and left to stand for 1 h at room temperature. This suspension was then stirred with 300 mg of DMAP for four hours. The prepared DMAP-GO was filtered, washed with water, and dried in a vacuum oven at 50 °C. Fe3O4 nanoparticles were prepared by applying the co-precipitation method.50 Ferrous ammonium sulphate (FAS) and ferric chloride (FeCl3) were co-precipitated in alkaline medium at 80 °C. A mixture of FAS and FeCl3 (with an Fe2+/Fe3+ ratio of 1[thin space (1/6-em)]:[thin space (1/6-em)]2) was added to a boiling NaOH solution with constant stirring. Fe3O4 was synthesized immediately from the conversion of metal salts into hydroxides and eventually transformed into Fe3O4. A GC electrode was cleaned by polishing it with an alumina slurry. A mass of 0.2 mg of prepared material (DMAP-GO) was dispersed in 200 μL deionized water. A volume of 10 μL of this solution was dropped over the GC electrode and dried. Then, a volume of 10 μL of 1% Nafion solution was coated over DMAP-GO-modified GC electrode and dried. The prepared electrode was dipped into the Fe3O4 solution (1 mg mL−1) for four hours, washed with deionized water to remove unbound Fe3O4, and dried. For comparison, Naf/GO- and Naf/DMAP-GO-modified GCEs were also prepared.

TEM and SEM

Fig. 6 shows electron microscopy images of the Fe3O4-Naf/DMAP-GO nanohybrid. The TEM image of the prepared hybrid nanomaterials showed the distribution of iron oxide nanoparticles on the surface of Naf/DMAP-linked graphene oxide as black spots (Fig. 6A). Generally, graphene oxide appeared as a flake-like structure, while deposition of Fe3O4 yielded a prepared hybrid nanomaterial material with a dense and porous morphology and resulted in a larger active surface area (Fig. 6B).
image file: c6ra23409g-f6.tif
Fig. 6 (A) Transmission electron micrograph and (B) scanning electron micrograph of the Fe3O4-Naf/DMAP-GO hybrid nanomaterial.

UV-visible spectra and FTIR

To investigate the formation of the nanohybrid, UV-visible spectroscopy studies were carried out. Graphene oxide absorbed light in the UV range (100–190 nm) (curve a), and Fe3O4 nanoparticles dispersed in aqueous solution (curve b) exhibited no noticeable absorbance in the wavelength range 200 nm to 700 nm. DMAP exhibited the characteristic absorbance at 625 nm (curve c) in aqueous solution and a ‘hump’ appeared at 280 nm. For the Naf/DMAP-GO composite, the absorbance intensity was decreased and the hump at 280 nm disappeared (curve d); these results may have been due to absorbance of DMAP molecules on the surface of the graphene oxide through electrostatic interactions (Scheme 1). A blue shift occurred from 625 nm to 618 nm with the addition of Fe3O4 nanoparticles to Naf/DMAP-GO (curve e). This blue shift was due to the formation of a hybrid nanomaterial in which the Fe3O4 nanoparticles were dispersed on the Naf/DMAP-linked GO. The interactions were also studied by acquiring FTIR spectra. The GO (curve a) showed multiple peaks in the range of 900 to 4000 cm−1, which were assigned to various functional groups, including the hydroxyl group (for the peak at 3350 cm−1) and the epoxy group (for that at 1230 cm−1). The carbonyl group (C[double bond, length as m-dash]O) was also found, according to the peak at 1725 cm−1. Aromatic (C[double bond, length as m-dash]C) stretching vibrations were observed at 1645 cm−1. These results confirmed the presence of different types of oxygen-containing moieties on the surface of the GO. Regarding the spectrum of the Fe3O4-Naf/DMAP-GO nanocomposite (curve b), it did not show the characteristic absorption peak of C[double bond, length as m-dash]O at 1725 cm−1. In addition, in this spectrum, the absorbance peaks for the OH and epoxy groups (–O–) were observed to be shifted towards lower wavelengths, which indicated the formation of a new hybrid nanomaterial. The characteristic DMAP aromatic ring peak at 1600 cm−1 shifted to 1545 cm−1 and the peak at 1398 cm−1 (for C–N stretching) shifted to 1324 cm−1.51 In the TEM image, Fe3O4 (Fe2+ and Fe3+) nanoparticles appeared as black spots, indicating that these nanoparticles may have been electrostatically interacting with negatively charged sulphonic (SO3) groups of Nafion. The characteristic stretching vibration peak for the Fe–O bond was shifted to 585 cm−1 for the Fe–O bond from 570 cm−1 as reported.52

XRD

The obtained XRD patterns provided information on the synthesis of graphene oxide and the Fe3O4-Naf/DMAP-GO nanohybrid. The peak intensity at 2θ = 10.1° corresponded to the (002) reflection of the complete oxidation product of graphite to GO. For the iron oxide nanoparticles, the peaks were indexed to the (111), (220), (311), (400), (422), (511), (440), (620) and (622) planes of unit cell of Fe3O4, which together corresponded to the magnetite structure (JCPDS card no. 79-0417). The average size of the iron oxide nanoparticles was determined to be ∼10.4 nm. The peak at 9.8° corresponded to the enhancement of the layers' gap is 0.98 nm for DMAP-linked GO. The diffraction pattern of the Fe3O4-Naf/DMAP-GO nanohybrid showed a reflection at 9.9°, indicative of the presence of graphene oxide, and different lattice planes of Fe3O4 present in Naf/DMAP-GO, which confirmed the distribution of Fe3O4 on Naf/DMAP-GO and formation of the nanohybrid.

Conclusions

In this work, a proposed hybrid nanomaterial was prepared using an environmentally friendly method involving the formation of non-covalent interactions without disturbing the original skeleton of the GO. The proposed material makes use of the advantages of DMAP, GO, and Fe3O4 simultaneously. Synergistic effects of different components in the nanohybrid helped to electrocatalyse the reduction of H2O2 at a much lower potential and with minimum interference from other metabolites. The reported nanomaterial provides a new type of electrochemical platform for sensing hydrogen peroxide.

Acknowledgements

We sincerely acknowledge the UGC, New Delhi [No. F. 42-299/2013 (SR)] for financial assistance. The authors are very thankful to the Department of Chemistry, BHU, Varanasi for the FTIR characterizations, Gandigram Rural Institute, Tamilnadu for SEM and the Department of Physics, BHU for TEM characterizations and NIT Raipur for XRD.

Notes and references

  1. P. Niethammer, G. Clemensr, L. A. Thomas, J. M. Timothy, T. A. Look and J. T. Mitchison, Nature, 2009, 459, 996–999 CrossRef CAS PubMed.
  2. R. Weindruch, Sci. Am., 1996, 49–52 Search PubMed.
  3. M. López-Lázaro, Cancer Lett., 2007, 252, 1–8 CrossRef PubMed.
  4. X. Qina, W. Lua, Y. Luoa, G. Asiri, M. A. Chang, A. O. Al-Youbi and X. Suna, Electrochim. Acta, 2012, 74, 275 CrossRef.
  5. B. Habibi and M. Jahanbakhshi, Sens. Actuators, B, 2014, 203, 919 CrossRef CAS.
  6. X. Li, Y. Liu, L. Zheng, M. Dong, Z. Xue, X. Lu and X. Liu, Electrochim. Acta, 2013, 113, 170 CrossRef CAS.
  7. L. Jia, J. Liu and H. Wang, Electrochim. Acta, 2013, 111, 411 CrossRef CAS.
  8. M. Liu, L. Wang, J. Deng, Q. Chen, Y. Li, Y. Zhang, H. Li and S. Yao, Analyst, 2012, 135, 4577 RSC.
  9. J. Guo, R. Wang, W. W. Tjiu, J. Pan and J. Liu, J. Hazard. Mater., 2012, 225–226, 63 CrossRef CAS PubMed.
  10. (a) M. Lin, H. Han, D. Pan, H. Zhang and Z. Su, Microchim. Acta, 2015, 182, 805 CrossRef CAS; (b) C. X. Xu, K. J. Huang, Y. Fan, Z. W. Wu and J. Li, J. Mol. Liq., 2012, 165, 32 CrossRef CAS; (c) S. Bai and X. Shen, RSC Adv., 2012, 2, 64 RSC; (d) S. Chen, R. Yuan, Y. Chai and F. Hu, Microchim. Acta, 2013, 180 Search PubMed.
  11. Y. Fang and E. Wang, Chem. Commun., 2013, 49, 9526 RSC.
  12. D. Wang, Y. Li, P. Hasin and Y. Wu, Nano Res., 2011, 4, 124 CrossRef CAS.
  13. K. K. Naik, S. Kumar and C. S. Rout, RSC Adv., 2015, 5, 74585 RSC.
  14. K. K. Naik and C. S. Rout, RSC Adv., 2015, 5, 79397 RSC.
  15. S. Laurent, D. Forge, M. Port, A. Roch, C. Robie, L. V. Eist and R. N. Muller, Chem. Rev., 2008, 108, 2064 CrossRef CAS PubMed.
  16. R. P. Liang, X. N. Wang, C. M. Liu, X. Y. Meng and J. D. Qiu, J. Chromatogr. A, 2015, 1315, 28 CrossRef PubMed.
  17. W. Wei, S. Yang, H. Zhou, I. Lieberwith, X. Feng and K. Mallen, Adv. Mater., 2013, 25, 2909 CrossRef CAS PubMed.
  18. S. Bhuvaneswari, P. M. Prateeksha, S. Anandan, D. Rangappa, R. Gopalan and T. N. Rao, Phys. Chem. Chem. Phys., 2014, 16, 5284 RSC.
  19. P. T. Yin, S. Shah, M. Chhowalla and K. B. Lee, Chem. Rev., 2015, 115, 2483 CrossRef CAS PubMed.
  20. T. Fried, G. Shamer and G. Markovich, Adv. Mater., 2001, 13, 1158 CrossRef CAS.
  21. M. L. Khalil, Arabian J. Chem., 2015, 8, 279 CrossRef CAS.
  22. (a) V. K. Rai, P. K. Rai, S. Bajaj and A. Kumar, Green Chem., 2011, 13, 1217 RSC; (b) L. D. S. Yadav, S. Singh and V. K. Rai, Green Chem., 2009, 11, 878 RSC; (c) L. D. S. Yadav, S. Yadav and V. K. Rai, Green Chem., 2006, 8, 455 RSC.
  23. S. Liu, J. Q. Tian, L. Wang and X. P. Sun, Carbon, 2011, 49, 3158 CrossRef CAS.
  24. M. Y. Wang, T. Shen, M. Wang and D. G. J. Chen, Mater. Lett., 2013, 107, 311 CrossRef CAS.
  25. Y. L. Zhang, Y. P. Liu, J. M. He, P. F. Pang, Y. T. Gao and Q. F. Hu, Electrochim. Acta, 2013, 90, 550 CrossRef CAS.
  26. A. P. Pang, Z. Yang, S. Xiao, J. Xie, Y. Zhang and Y. Gao, J. Electroanal. Chem., 2014, 727, 27 CrossRef.
  27. S. Woo, Y. R. Kim, T. D. Chung, Y. Piao and H. Kim, Electrochim. Acta, 2012, 59, 509 CrossRef CAS.
  28. S. Liu, L. Wang, J. Q. Tian, Y. L. Luo, X. X. Zhang and X. P. Sun, J. Colloid Interface Sci., 2011, 363, 615 CrossRef CAS PubMed.
  29. C. Xiao, Y. L. Liu, J. Q. Xu, S. W. Lv, S. Guo and W. H. Huang, Analyst, 2015, 140, 3753 RSC.
  30. S. Li, Y. Zheng, G. W. Qin, Y. Ren, W. Pei and L. Zuo, Talanta, 2011, 85, 1260 CrossRef CAS PubMed.
  31. X. Cao, Z. Zeng, W. Shi, P. Yep, Q. Yan and H. Zhang, Small, 2013, 9, 1703 CrossRef CAS PubMed.
  32. I. Tiwari and M. Singh, Microchim. Acta, 2011, 174, 223 CrossRef CAS.
  33. L. J. Kong, Z. Y. Ren, N. N. Zheng, S. C. Du, J. Wu, J. L. Tang and H. G. Fu, Nano Res., 2015, 8, 469 CrossRef CAS.
  34. S. Hosu, Q. Wang, A. Vasilescu, S. F. Peteu, V. Raditoui, S. Railian, V. Zaitsev, K. Turcheniuk, Q. Wang, M. Li, R. Boukherroub and S. Szunertis, RSC Adv., 2015, 5, 1474 RSC.
  35. P. M. Nia, F. Lorestani, W. P. Meng and Y. Aliasdepartment, Appl. Surf. Sci., 2015, 332, 648 CrossRef.
  36. Y. Q. Yang, H. L. Xie, J. Tang, S. Tang, J. Yi and H. L. Zhang, RSC Adv., 2015, 5, 63662 RSC.
  37. D. Li, L. Luo, Z. Pang, X. Chen, Y. Cai and Q. Wei, RSC Adv., 2014, 4, 3857 RSC.
  38. L. Zhong, S. Gan, X. Fu, F. Li, D. Han, L. Guo and L. Niu, Electrochim. Acta, 2013, 89, 222 CrossRef CAS.
  39. N. Jia, B. Huang, L. Chen, L. Tan and S. Yao, Sens. Actuators, B, 2014, 195, 165 CrossRef CAS.
  40. M. Y. Wang, T. Shen, M. Wang, D. E. Zhang, J. Tong and J. Chen, Sens. Actuators, B, 2013, 190, 645 CrossRef.
  41. S. He, Z. Chen, Y. Yu and L. Shi, RSC Adv., 2014, 4, 45185 RSC.
  42. G. S. Cao, P. Wang, X. Li, Y. Wang, G. Wang and J. Li, Bull. Mater. Sci., 2015, 38, 163 CrossRef CAS.
  43. Y. Yang, H. Xiang, L. Shuai and S. Gunasekaran, Anal. Chim. Acta, 2011, 708, 44 CrossRef PubMed.
  44. G. S. Cao, R. Wang, P. Wang, X. Li, Y. Yang, G. Wang and J. Li, Nano, 2014, 9, 1450047 CrossRef.
  45. S. T. Yang, S. Chen, Y. Chang, A. Cao, Y. Lin and H. Wang, Colloid Interface Sci., 2011, 359, 24 CrossRef CAS PubMed.
  46. I. Tiwari, K. P. Singh, M. Singh and C. E. Banks, Anal. Methods, 2012, 4, 118 RSC.
  47. L. Wang, W. Qi, R. Su and Z. He, J. Solid State Electrochem., 2013, 17, 2595 CrossRef CAS.
  48. J. Xu, C. Liu and Z. Wu, Microchim. Acta, 2011, 172, 425 CrossRef CAS.
  49. W. S. Hummers and R. E. Offeman, J. Am. Chem. Soc., 1958, 80, 1339 CrossRef CAS.
  50. H. E. Ghandoor, H. M. Zidan, M. M. H. Khalil and M. I. M. Ismail, Int. J. Electrochem. Sci., 2012, 7, 5734 Search PubMed.
  51. Y. Yan, M. Zhang, K. Gong, L. Su, Z. Gou and L. Mao, Chem. Mater., 2005, 17, 3457 CrossRef CAS.
  52. R. P. Liang, X. N. Wang, C. M. Liu, X. Y. Meng and J. D. Qiu, J. Chromatogr. A, 2013, 28, 1315 Search PubMed.

Footnote

Electronic supplementary information (ESI) available: XRD, UV-visible, FTIR and valuable informations are given. See DOI: 10.1039/c6ra23409g

This journal is © The Royal Society of Chemistry 2016
Click here to see how this site uses Cookies. View our privacy policy here.