Nitrogen doped graphene supported α-MnO2 nanorods for efficient ORR in a microbial fuel cell
Rajeev K. Gautama,
Himaghna Bhattacharjeea,
S. Venkata Mohanb and
Anil Verma*a
aSustainable Environergy Research Lab (SERL), Department of Chemical Engineering, Indian Institute of Technology Delhi, Hauz-Khas, New Delhi 110016, India. E-mail: anilverma@iitd.ac.in
bBioengineering and Environmental Sciences (BEES), CSIR-Indian Institute of Chemical Technology (CSIR-IICT), Hyderabad 500 007, India
First published on 14th November 2016
Abstract
Oxygen reduction reaction (ORR) is one of the rate-limiting processes in MFCs. The development of highly active, cost-effective, scalable, and durable catalysts for ORR in MFCs is a challenging task. In this work, we have developed α-MnO2 nanorods (MN), α-MnO2 nanorods supported on reduced graphene oxide (MN/rGO), and α-MnO2 nanorods supported on nitrogen doped reduced graphene oxide (MN/NrGO) through a facile one-step hydrothermal method. The as-prepared electrocatalysts are characterized for morphological and structural evaluation along with electrochemical characterizations. The electrochemical properties of as-prepared catalysts have been investigated through rotating disc electrode (RDE) studies, which confirm that both MN/NrGO and MN/rGO exhibit higher current density, more positive onset potential, and a higher number of electron transfers as compared to both pure rGO and MN individually. The experiments are conducted in a novel MFC having a modular air cathode. Electrochemical performance studies show that the MFCs having a cathode coated with MN/NrGO and MN/rGO electrocatalysts, at a very low loading of 0.5 mg cm−2, produce maximum power densities of 135.27 mW m−2 and 85.45 mW m−2, respectively, which is significantly higher as compared to pure rGO (57.63 mW m−2) and MN (45.56 mW m−2) electrocatalysts. These results illustrate that MN/NrGO electrocatalysts are potentially efficient and cost effective cathode catalysts for their practical application in MFCs.
1. Introduction
A microbial fuel cell (MFC) is an electrochemical device that utilizes microorganisms as bio-catalysts to oxidize organic matter, thereby generating clean and sustainable electrical energy and wastewater, simultaneously.1,2 The anode compartment of a MFC is fully occupied by wastewater (containing organic matter). It generates both electrons and protons by oxidizing the organic substance of wastewater in the presence of anaerobic electrogenic microorganisms.3,4 Electrons produced at the anode side are transferred though an external circuit towards the cathode. The electron acceptor accepts these electrons along with the protons, which migrate through the electrolyte from the anode to the cathode and get reduced in the presence of the cathode catalyst.5 MFC technology has received a huge attention due to its ability to simultaneously treat wastewater and generate electricity. However, its high cost of components and relatively low power output as compared to conventional fuel cells, are major hurdles in the way of its commercialization.6 In several investigations, it has been found that the reduction kinetics at cathode side heavily affected the power output in MFC.7 Hence, power generation in MFCs is largely dependent on the electron acceptors at the cathode.8 Therefore, in order to maximize the power density in MFCs, many electron acceptors of high redox potential such as ferricyanide9 and permanganate10 have been used. However, these electron acceptors are neither sustainable in a natural environment nor cost effective.11 In comparison to other electron acceptors, oxygen, has a high positive redox potential12 and inexhaustible availability. Thus it can be the most suitable, sustainable, and cost effective candidate as an electron acceptor for MFCs, which will be deployed in natural settings for long periods of time. On the flip side, the poor kinetics of oxygen reduction reaction (ORR) in near neutral mediums results in a high reduction overpotential, which in-turn seriously limits the performance of MFC.13,14 Noble metals including platinum (Pt), gold (Au), palladium (Pd), and their alloys have been tried for ORR improvement.15–17 Amongst these, Pt-based materials are the most commonly used cathode catalyst for ORR; however, platinum's high cost and its sensitivity to poisoning limit its use for large scale, commercial MFC applications. Therefore, it is essential to develop efficient and cost effective non-platinum cathode catalysts for ORR enhancement in MFCs. Earlier studies have demonstrated that several low cost non-platinum catalysts such as transition metal, metal oxide, macrocycles and phthalocyanines, lead oxide, carbon supported nanostructures, manganese dioxide and so on, have been tried to enhance ORR kinetics.18–21 Among these materials, manganese dioxide (MnO2) has received attention as a cathode catalyst for ORR in MFCs due to several factors including its abundance, low cost, environment benignity, lower toxicity, high surface area, high chemical stability, and considerable catalytic activity towards ORR.22 MnO2 has the ability to form different kinds of polymorphic structure such as α-, β-, γ-, λ- and δ-MnO2. Earlier studies show that the catalytic performance of MnO2 follows the sequence of β- < λ- < γ- < α- ≈ δ-MnO2.23,24 It has been suggested that the electrochemical performance of MnO2 nanostructures towards ORR is largely dependent on its crystalline phases; however, its active phases reported in earlier studies are still in conflict.25 In addition to crystallographic nature, the ORR activity of MnO2 nanostructures is also affected by their morphological structure.26So far, MnO2 with various morphologies like nanoparticles,7,22,27,28 nanoflower,29 nanoneedles,30 nanowires,31 nanotubes,32,33 and nanorods34 have been utilized as an electrocatalyst towards ORR activity. Despite several advantages, the main weakness of MnO2, which directly affects its electrochemical performance, is its poor electrical conductivity.35 Therefore, several types of carbon including Vulcan XC-72, Monarch carbon black 1000, and graphite have been employed as support material for MnO2 to enhance its electrical conductivity as well as electrochemical performance.36 However, these support materials exhibit poor ORR activity. On the other hand, the newly discovered carbon allotropes such as graphene and carbon nanotubes have also been employed as support materials for MnO2.37,38 Graphene, a two dimensional single layer sheet of carbon atoms, has excellent inherent properties, such as electrical conductivity, large electrochemical active surface area, better mechanical properties, and excellent chemical stability which facilitate its utilization as an excellent carbon support for growing or anchoring MnO2 nanostructures.39,40 MnO2 and graphene hybrids were prepared via physical mixing, thermal decomposition, ball milling, electrodeposition, and chemical deposition using precursors such as permanganate. Further, a few of the attempts have been focused on functionalization of graphene to further improve its catalytic activity.41 However, the performance could not be increased significantly.
Recently, nitrogen doping in graphene has become a key route to enhance its electrochemical performance by increasing its electrical conductivity and surface active site for use in energy applications.42–44 The nitrogen doped graphene may become a practical support for α-MnO2 nanorods and may be utilize as cathode electrocatalyst for ORR in MFC. Graphene and nitrogen doped graphene supported α-MnO2 nanorods have recently been used as electrode materials for supercapacitors and lithium ion batteries.45,46 In the present study, we report a one-step rapid and facile method to prepare α-MnO2 nanorods (MN), α-MnO2 nanorods supported on reduced graphene oxide (MN/rGO), and α-MnO2 nanorods supported on nitrogen doped reduced graphene oxide (MN/NrGO) hybrids via hydrothermal method as cathode catalysts for single chamber MFC. The as-synthesized electrocatalysts were characterized by XRD, SEM, TEM, Raman, XPS and TGA. The electrochemical performances of the electrocatalysts were evaluated using LSV and EIS. Finally, these electrocatalysts were employed in a novel design of a single chamber MFC at very low loading of cathode catalysts (0.5 mg cm−2) and evaluated using performance curves and compared with the Pt/C catalyst.
2. Experimental
2.1 Materials and methods
Natural flake graphite (500 mesh, >99%) was purchased from Graphite and Minerals Ltd. India. Concentrated sulfuric acid (H2SO4, 98%), hydrochloric acid (HCl, 37.5%), manganese(II) sulfate monohydrate (MnSO4·H2O, >99%), ammonia (NH3·H2O, 28 wt%), potassium permanganate (KMnO4), hydrazine hydrate (N2H4·H2O, 50–60%), hydrogen peroxide (H2O2, 30 wt%), urea (CO(NH2)2) and ethanol were purchased from Sigma Aldrich Ltd. All chemicals are of analytical grade, which have been used without any further purification. Distilled water (DI) was used in all the experiments.2.2 Electrocatalyst synthesis
2.3 Air cathode preparation
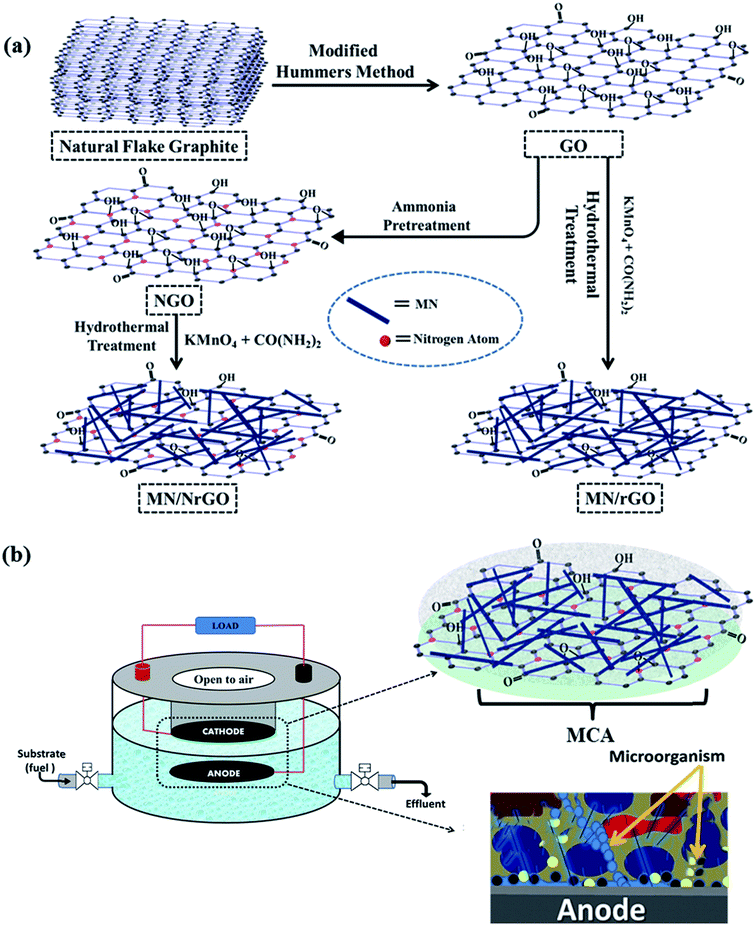
The air cathode preparation for single chamber MFC is a three step procedure, which includes gas diffusion layer preparation, catalyst coating, and membrane cathode assembly preparation. Carbon cloth used as the base to prepare air cathode was preheated for 30 minutes at 370 °C. On one side of the pretreated carbon cloth, first a base layer (40 wt% polytetrafluoroethylene (PTFE) + carbon black) and over it 4 wet proof gas diffusion layers (60 wt% PTFE) were coated. The other side of the carbon cloth was coated with electrocatalysts ink. The catalyst ink was prepared by mixing as-prepared electrocatalysts (a very low loading at 0.5 mg cm−2), Nafion solution (94 μL), and isopropanol (6 mL) using ultrasonication. Once this assembly was prepared, the Nafion membrane was hot pressed at the catalyst side of the carbon cloth electrode. The prepared assembly is known as membrane cathode assembly (MCA), as shown in Fig. 1b. The Nafion-117 membrane was utilized after pretreatment, as per the stated procedure.48 It is very important to note that it is a unique kind of air electrode for the single chamber MFC using a very low catalyst loading. The cathode is prepared in such a way that oxygen can diffuse from air to the diffusion layer and from there to catalyst side efficiently. However, the water which is in the anolyte cannot diffuse to the air side, as detailed in next section. All the cathodes were prepared by the same procedure using a catalyst loading of 0.5 mg cm−2.2.4 Single chamber MFC construction and operation
Single chamber MFC was fabricated using a novel design, as shown in Fig. 1b. One of the most important aspects of this design is the diffusion of oxygen from air to the electrocatalyst of membrane cathode assembly (MCA). Moreover, the cathode can simply be taken out from the cell without affecting the anode electrode as well as the anolyte. The level of anolyte was just above the hanging level of the cathode electrode. The excess level of the anolyte was kept minimum to avoid any water diffusion from the anolyte to the cathode surface facing air side, otherwise, a film of water would form over it and oxygen would not diffuse from air to the cathode catalyst layer facing anolyte. Specifically, prepared membrane cathode assembly (MCA) was placed at the bottom of the inner cylinder, where the diffusion layer was facing to the air side of the inner cylinder. The other side of the MCA (catalyst layer) was facing the anolyte chamber. This novel design of the MFC decouples the cathode and anode assemblies as separate modules. This is significant as it enables the utilization of the same anode system with different cathodic assemblies. This removes variations in cell performance due to differences in anodic performance, such as nature of biofilm, type of microbes, etc., and ensures that any difference in electrochemical performance in a given fuel cell assembly is only due to difference in the cathode performance. This improves the accuracy of the catalytic performance. Pure carbon cloth, treated with HCl and NaOH solution for 1 hour, was used as the anode electrode for the MFC. The effective area of the electrodes was about 14 cm2 each. The anode and cathode were separated by a distance of 1 cm and the single chamber MFC had a bed volume of around 150 mL. For every electrocatalyst, MFC in duplicates were studied simultaneously, along with repeatability tests. Copper wires were connected to both the anode and cathode with a conducting epoxy resin. The anaerobic sludge derived mixed culture was inoculated to the anode chamber with Design Synthetic Waste (DSW, with glucose) and 50 mM Phosphate Buffer Saline (PBS) that contained NaCl (8 g), KCl (0.2 g), K2HPO4 (1.74 g), and KH2PO4 (0.24 g). The DSW and PBS were refreshed everytime when the voltage dropped below 50 mV. All experiments had been performed at about 28 °C.2.5 Characterization of electrocatalysts
The crystallographic phase and structure of as-prepared electrocatalyst were investigated by XRD (MiniFlex 600 Rigaku) diffractometer using Cu-Kα radiation (λ = 1.5418 Å) at a power of 40 kV × 25 mA. Morphological properties of the prepared electrocatalysts were characterized by SEM (Zeiss EVO 50) and TEM (FEI Tecnai TF20). Raman spectra were collected using a micro Raman spectrometer (Renishaw, Gloucestershire, UK), where excitation had been achieved using a 514 nm diode laser at room temperature. X-ray photoelectron spectroscopy (XPS) was obtained using an ESCLAB-MkII (VG scientific) equipped with Mg Kα source and the C 1s peak at 285 eV as an internal standard. Thermogravimetric analysis (TGA) was carried out on a thermoanalyzer (Pyris Diamond TG/DTA) with a heating rate of 5 °C min−1 in air atmosphere. The Brunauer–Emmett–Teller (BET) surface area of the electrocatalyst was obtained from N2 adsorption–desorption isotherm (77 K) with Micrometrics ASAP 2010. The sample was first degassed at 300 °C to ensure a clean surface prior to construction of adsorption isotherm.2.6 Electrochemical measurements
The electrochemical measurements of as-prepared electrocatalysts were performed by a three-electrode experimental setup using potentiostat/galvanostat (PGSTAT 302 N, Metrohm Autolab B.V. Netherlands). The three electrode system consists of platinum wire as counter electrode, Ag/AgCl as reference electrode, and electrocatalyst coated glassy carbon disc (3 mm in diameter) as the working electrode in a solution of 0.1 M KOH electrolyte. In order to prepare the catalyst ink, catalyst (1.0 mg) was dispersed in isopropanol (1 mL) and Nafion (5 μL) solution and kept under sonication for 45 minutes. Thereafter, the working electrode was prepared by dropping the catalyst ink (10 μL) onto the surface of glassy carbon disc electrode. The linear sweep voltammetry (LSV) was conducted using rotating disc electrode (RDE) in oxygen or nitrogen saturated gas at a scan rate of 10 mV s−1. Electrochemical impedance spectroscopy (EIS) measurements were carried out in a frequency range of 106 to 0.01 Hz at open circuit condition in 50 mM phosphate-buffered saline (pH 7.4), where the working electrode was fabricated by coating the catalyst on carbon cloth.3. Results and discussion
3.1 Morphological characterization
Fig. 2 shows the SEM and TEM images of rGO, MN, MN/rGO, and MN/NrGO. Fig. 2a and a′ show the layered structure of rGO, whereas Fig. 2b and b′ show the nanorods structure of MN. Further, the absence of other morphology in both SEM and TEM images of MN suggest its high morphological purity. Also, as evidenced from TEM images, the diameter of MN is in the range of 50–80 nm and lengths in the range of 400–600 nm. The MN produced due to anisotropic growth under the influence of chemical potential during hydrothermal treatment. The morphology of MN/rGO and MN/NrGO catalysts can be seen in Fig. 2c, c′, d and d′, which reveals that MN are homogeneously distributed over the surface of graphene sheets without obvious aggregation. Further, it can also be noticed that the nanorods structure of α-MnO2, have not changed during preparation of MN/rGO and MN/NrGO hybrids, which confirm that similar growth procedures of pure MN were followed for the preparation of MN over rGO and NrGO support. Moreover, the nitrogen doping might facilitate improved homogeneous dispersion of MN over NrGO as shown in Fig. 2d′. This might be due to the fact that more active sites associated with NrGO act as anchoring sites for the formation of MN over graphene. The urea treatment during the preparation of MN/NrGO provides more active sites for MN formation. Therefore, in MN/NrGO, the NrGO sheets contain better dispersed MN in comparison to aggregation of MN in MN/rGO, as evidenced from TEM image (Fig. 2d′).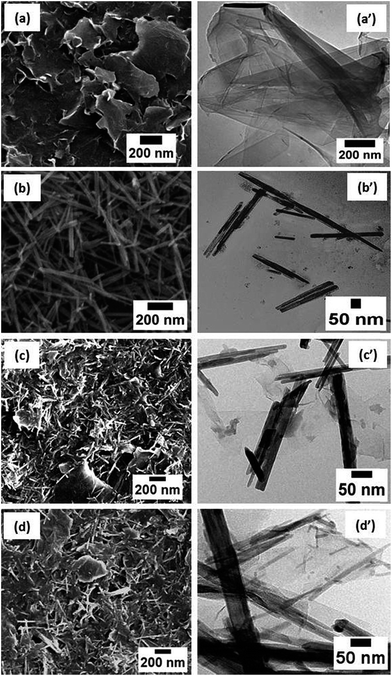 | ||
| Fig. 2 SEM & TEM morphologies rGO (a and a′), MN (b and b′), MN/rGO (c and c′), and MN/NrGO (d and d′). | ||
3.2 XRD and RAMAN analysis
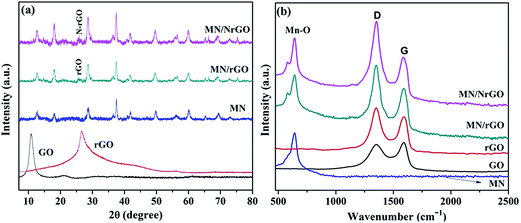
Representative XRD and RAMAN patterns of GO, rGO, MN, MN/rGO, and MN/NrGO are shown in Fig. 3. XRD in Fig. 3a shows an intense peak for GO at 10.29°, which is assigned to the (002) plane, confirming its formation using modified Hummers method. Higher interlayer spacing (0.85 nm) of GO due to presence of intercalated oxide functional group as compared to graphite (0.34 nm) was observed, which confirmed the formation of GO. The oxide functional groups were confirmed by FTIR (analysis not shown here). Further, GO loses most of its intercalated oxide functional groups after its reduction to rGO; consequently, the peak corresponding to the (002) plane shifted towards a higher angle i.e. 26.42° with lower value of interlayer spacing (0.33 nm). The XRD pattern of pure MN showed main peaks at 2θ = 12.65°, 17.88°, 28.69°, 37.48°, 41.91°, 49.88°, 56.12°, 60.11°, 65.18°, 69.45°, 72.89°, and 78.71°, which confirm that this individual diffraction pattern is perfectly match, which is assigned to the α-MnO2 phase with a tetragonal crystal system (JCPDS file no. 44-0141). No crystal impurity peaks were observed, which indicated high purity of the product. However, in case of MN/rGO, a peak from rGO has been observed at 25.73° assigned to the (002) plane which confirmed that GO was successfully reduced to rGO. Further, the crystalline structure of MN is not affected much after forming MN/NrGO and MN/rGO.Raman spectroscopy is widely used to investigate the graphitic structures, defects and disordered phases of as-prepared catalyst hybrids. Fig. 3b shows the typical Raman spectra of MN, GO, rGO, MN/rGO, and MN/NrGO, taken from different regions of the catalysts. The Raman spectra of MN displays one diagnostic band at 641 cm−1, which was caused by asymmetric stretching vibrations of Mn–O bond.37 The Raman spectra of pure GO exhibits two characteristic peaks at 1350 cm−1 and 1598 cm−1, which were associated with the D and G band, respectively. The D band was associated with the A1g in-plane breathing vibrational mode and it strongly correlates to structural defects and partially disordered structures at the edge of the sp2 carbon domain; whereas the G band was attributed to the E2g vibration mode of sp2 carbon domain and usually corresponds to the degree of graphitization.49 Further, the intensity ratio of the D band and the G band (i.e. ID/IG) determines the density of structure defects in graphene. It can be observed from the figure that the corresponding D and G bands still exist in rGO, MN/rGO, and MN/NrGO; however, a new band is observed at around 642 cm−1 in the spectra of MN/rGO and MN/NrGO and was attributed to the asymmetric stretching vibrations of Mn–O of MnO2 that confirms existence of the MN in the electrocatalysts.44 The ID/IG value observed for GO, rGO, MN/rGO and MN/NrGO were 0.95, 1.12, 1.21, and 1.25, respectively. The increase in ID/IG value of rGO, MN/rGO and MN/NrGO compared to GO was caused by the introduction of disordered carbon or of defects during the chemical reduction, the reaction of carbon with MnO4−, and the nitrogen doping step.
3.3 X-ray photoelectron spectroscopy (XPS)
XPS was used to analyze the chemical compositions and structure of as-prepared electrocatalysts and also to confirm the results obtained as discussed above. Fig. 4a shows XPS survey spectra of GO, MN/rGO, and MN/NrGO and high resolution spectra of Mn 2p (Fig. 4b), C 1s (Fig. 4c), N 1s (Fig. 4d) of MN/NrGO hybrids. In comparison to XPS spectra of GO, the peak associated with C 1s become predominant, whereas the peak associated with O 1s becomes significantly weaker, confirming that the GO get deoxygenated and reduced to MN/rGO and MN/NrGO during the hydrothermal reaction. In MN/NrGO, during ammonia treatment of GO the NH3 can react with the oxygen-containing functional groups on the surfaces of GO; consequently nitrogen atoms can be inserted into the graphene planes. Furthermore, the peak of N 1s observed in MN/NrGO assured that nitrogen atoms were successfully embedded into the graphene lattice by the ammonia pretreatment followed by hydrothermal process. The high resolution scan of Mn 2p (Fig. 4b) shows two major peaks of Mn 2p3/2 and Mn 2p1/2, which are centered at 642.01 eV and 653.78 eV, respectively with a spin energy separation of 11.65 eV. This indicates the existence of Mn4+ in the electrocatalysts is in good agreement with earlier reported data.38 Furthermore, the N 1s spectrum, as shown in Fig. 4c, is the evidence of nitrogen containing groups in NrGO showed three different valence states, pyridinic N at ca. 398.2, pyrrolic N at ca. 399.5, and quaternary N at ca. 401.9 eV, respectively. The pyridinic N and pyrrolic N can easily formed on graphene planes have high electron mobility and valuable electrochemical active sites. Further, the nitrogen content measured by elemental analysis assured that a nitrogen-doping level of 3.73% (at%) was achieved. In MN/NrGO, the C 1s spectra suggests four sub-peaks centered at approximately 284.7, 285.6, 286.9, and 289.1 eV (Fig. 4c), which are belong to C–C, C–N, C–O, C![[double bond, length as m-dash]](https://www.rsc.org/images/entities/char_e001.gif) O groups, respectively. These results reveal that the MN/NrGO electrocatalyst was successfully prepared by reactions between the oxygen-containing groups of GO and ammonia in hydrothermal process which facilitate the doping of nitrogen and the formation of C–N bonds.
O groups, respectively. These results reveal that the MN/NrGO electrocatalyst was successfully prepared by reactions between the oxygen-containing groups of GO and ammonia in hydrothermal process which facilitate the doping of nitrogen and the formation of C–N bonds.
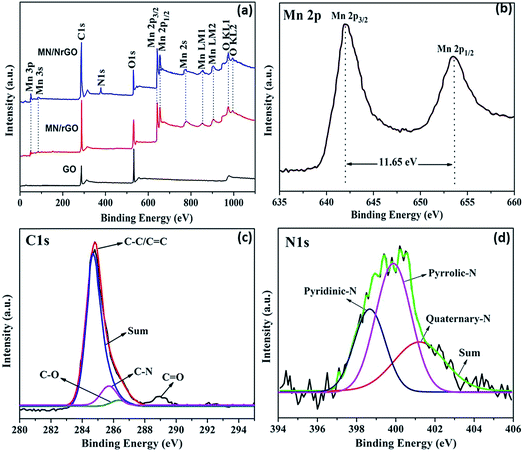 | ||
| Fig. 4 XPS survey spectra of (a) GO, MN/rGO, and MN/NrGO, and the high resolution spectra of, (b) Mn 2p, (c) C 1s, and (d) N 1s MN/NrGO. | ||
3.4 Thermal gravimetric analysis (TGA) and N2 adsorption–desorption analysis (BET)
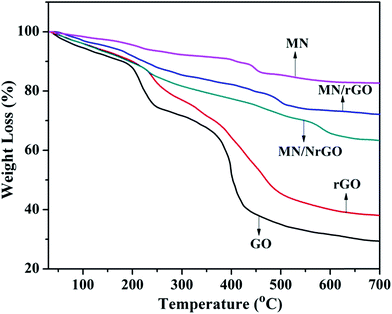
TGA was conducted to understand the thermal stability of electrocatalysts as shown in Fig. 5. In Fig. 5, a significant weight loss in GO can be observed at 205 °C, which is due to pyrolysis of oxygen-containing functional groups. On the other hand, the major weight loss in rGO, which shows slightly higher thermal stability than GO, was observed at 228 °C. Further, MN has higher thermal stability in comparison to other electrocatalysts. The first major weight loss in MN of 6.08 wt% was observed at 228 °C, which was due to dehydration of moisture molecules adsorbed on its surface. The second major weight loss of MN was observed at 452 °C and it was because of phase transformation of MnO2 to Mn2O3 due to loss of oxygen from MN lattice as per reaction 2MnO2(s) → Mn2O3(s) + ½O2(g). The phase transformation temperature of MN under air atmosphere is an important sign of thermal stability.47 The phase transformation temperature of MnO2 component (576 °C) in MN/NrGO electrocatalyst was higher compared to both in MN (452 °C) and in MN/rGO electrocatalysts (597 °C), which indicates that the thermal stability of MN may be enhanced by its crosslinking with graphene and nitrogen doped graphene.The BET surface area of MN, rGO, MN/rGO, and MN/NrGO was 95, 310, 489, and 542 m2 g−1, respectively. Significantly high surface areas of MN/rGO and MN/NrGO were obtained in comparison to bare MN and rGO. The probable reason is the synthesis of the supported electrocatalysts by one pot hydrothermal method, which helps in better exfoliation of a few layer graphene by intercalation of MnO2 nanorods apart from growing on to the surface of the graphene.
3.5 Electrochemical performance
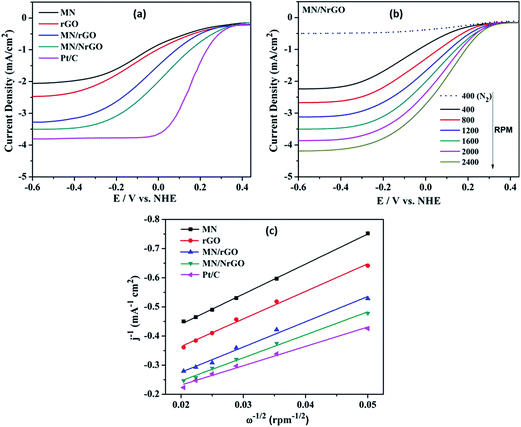
Fig. 6 shows the linear scan voltammograms (LSV) for ORR using different electrocatalysts. The commercial catalyst (Pt/C, 40 wt%) is used as a reference to compare the performance of the synthesized electrocatalysts. Fig. 6a shows representative voltammograms for all the electrocatalyst at 1600 rpm and compared with the Pt/C. The onset potential of the MN/NrGO electrode towards ORR was close to that of Pt/C, while rGO and MN electrodes were found to have their oxygen reduction at less positive potentials. Further, the plateau limiting currents of MN/NrGO are larger compared to MN/rGO, rGO, and MN, and even comparable to that of Pt/C. More positive onset potential and higher limiting current of MN/NrGO for oxygen reduction compared to MN/rGO, rGO, and MN, demonstrates that N doping in rGO results in an increased electrocatalytic activity toward the ORR, which is due to the increased specific surface area of MN/rGO and MN/NrGO and could provide a large adsorption interface for ORR to take place as compared to the MN and rGO. Moreover, this current is much larger than that obtained at the MN/rGO, rGO, and MN electrodes for other rotating speeds (not shown) also. Fig. 6b shows the LSV curves for MN/NrGO at different rotating speeds for ORR and also compared with the N2 saturated electrolyte. It can be clearly seen that the limiting diffusion current of MN/NrGO electrode increases with increasing rotating speeds. This further confirms that the nitrogen doping in MN/NrGO electrocatalyst significantly boosts its electroactive surface area towards ORR. The number of electron transfer per oxygen molecule for oxygen reduction was determined using the Koutecky–Levich eqn (1):29
 | (1) |
 | (2) |
![[thin space (1/6-em)]](https://www.rsc.org/images/entities/char_2009.gif) 485 C mol−1). DO2 is the diffusion coefficient of O2 in 0.1 M KOH (DO2 = 1.9 × 10⁻⁵ cm2 s−1), ν is the kinetic viscosity (ν = 0.01 cm2 s−1), and CO2 is the bulk concentration of O2 (CO2 = 1.2 × 10⁻⁶ mol cm−3). The constant 0.2 is adopted when the rotation speed is expressed in rpm.
485 C mol−1). DO2 is the diffusion coefficient of O2 in 0.1 M KOH (DO2 = 1.9 × 10⁻⁵ cm2 s−1), ν is the kinetic viscosity (ν = 0.01 cm2 s−1), and CO2 is the bulk concentration of O2 (CO2 = 1.2 × 10⁻⁶ mol cm−3). The constant 0.2 is adopted when the rotation speed is expressed in rpm.
Koutecky–Levich plots (Fig. 6c) produced from the RDE results, show linear relationships between jk−1 and ω−1/2 for all electrocatalysts. It is known that, in an alkaline medium O2 is either reduced to HO2− as an intermediate via a two-electron transfer process, followed by further reduction to OH−, or it can be directly reduced to OH− through a four-electron transfer pathway, the latter is more efficient process and suitable for the MFC components. Table 1 shows a few of the important data, which are extracted from Fig. 6a.
| Electrocatalysts | Current density (mA cm−2) (at −0.6 V vs. NHE) | n (e−) | Onset potential (V vs. NHE) | Rct (Ω) |
|---|---|---|---|---|
| Pt/C | −3.79 | 4.02 | 0.287 | 16.23 |
| MN/NrGO | −3.49 | 3.83 | 0.281 | 18.92 |
| MN/rGO | −3.27 | 3.34 | 0.226 | 38.12 |
| rGO | −2.45 | 2.89 | 0.185 | 384.92 |
| MN | −2.04 | 2.73 | 0.132 | 690.12 |
Number of electron transfer calculated were about 2.89 and 2.73 for the rGO and MN electrode, respectively, suggesting that ORR at the rGO and MN electrode was likely to proceed mainly via a coexisting pathway of two-electron and four-electron transfer. However, in MN/NrGO and MN/rGO electrodes the numbers of electrons transfer are 3.83 and 3.34 respectively towards ORR, indicating that the dominant oxygen reduction process primarily proceeds through a favorable 4e− reduction pathway. Such an effective oxygen reduction process is similar to that obtained from using the commercial carbon supported Pt catalyst. However, the exact mechanism for ORR at the MN/NrGO and MN/rGO electrodes is still not clear. The 4-electron pathway for ORR has been suggested to proceed through simultaneous 2-oxygen atom side and/or bridge adsorption for oxygen dissociation, which could be used to explain the observed results for the prepared electrocatalysts. On the basis of the Koutecky–Levich equation (eqn (1)), jk can be obtained at 1600 rpm from Fig. 6b. The jk (at −0.6 V vs. NHE) obtained for the Mn/NrGO electrode (3.49 mA cm−2) was closer to that of the Pt catalyst (3.79 mA cm−2), but much higher than of the MN/rGO electrode (3.27 mA cm−2), the rGO electrode (2.45 mA cm−2), and MN electrode (2.04 mA cm−2) indicating better electrocatalytic activity of Mn/NrGO towards ORR. The results discussed above reveal that the nitrogen doping and incorporation of MnO2 into GO as a noble metal-free catalyst offers much higher catalytic activity towards ORR than its individual pristine components.
EIS study was conducted to evaluate the charge transport nature of as-prepared electrocatalyst at electrode/electrolyte interface. Fig. 7 shows the Nyquist plots of electrocatalysts coated carbon cloth electrodes with well-defined semicircles followed by a straight line. Charge transfer resistance (Rct) of each electrode can be obtained from the diameter of the semicircles. The Rct value is directly related to the interfacial interaction between the catalyst and reactant or electrolyte. The measured Rct value is found to follow the order of MN/NrGO (18.92 Ω) < MN/rGO (38.12 Ω) < rGO (385.92 Ω) < MN (690.12 Ω). A lower Rct value from the MN/NrGO electrode indicates the excellent charge transport. This faster electron transport increases the oxygen reduction rate in accordance to the highest reduction current obtained from the MN/NrGO graphene electrocatalyst. A lower Rct is also responsible for the decrease in ORR overpotential for the MN/NrGO electrocatalyst. The higher ORR activity and better charge transport property of the MN/NrGO in comparison to that of MN, rGO, and MN/rGO is due to the fact that nitrogen doping not only enhanced the surface properties but also tune the electronic properties of electrocatalyst.51 The high electrical conductivity induced by N doping ensures the fast transfer of electric charges, which reduces the charge transfer resistance and eventually promotes an effective ORR mechanism. Moreover, the better electrochemical performance of the MN/rGO and MN/NrGO is also due to the presence of functional groups, which help in facilitation of the inner sphere electron transfer mechanism. Hence, high surface area, enhanced electrical conductivity as well as inner sphere electron transfer mechanism due to the presence of functional groups on rGO or NrGO, making it an excellent support for MN/NrGO.
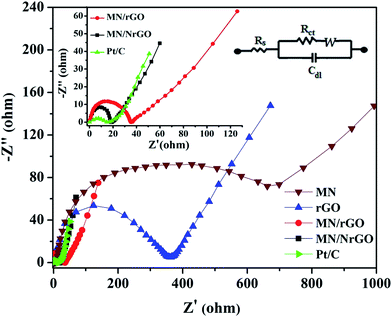 | ||
| Fig. 7 EIS spectra of MN/rGO and MN/NrGO catalysts. The inset shows the magnified EIS spectra of MN/rGO, MN/NrGO, and Pt/C electrocatalyst and an equivalent circuit diagram. | ||
3.6 MFC performance
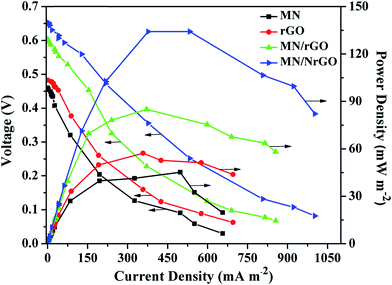
The microbial fuel cell performance curves with MN/NrGO, MN/rGO, rGO, and MN electrocatalyst air cathodes are shown in Fig. 8. The maximum power density of the MFC with MN/NrGO catalyst air cathode at a very low loading of 0.5 mg cm−2 is 135.27 mW m−2, which is significantly higher than that of MN/rGO (85.45 mW m−2), rGO (57.63 mW m−2), and MN (45.56 mW m−2) catalyst air cathodes. Furthermore, the open circuit voltage (OCV) of the MFC with MN/rGO cathode is 0.673 V, which is much higher than other electrocatalysts air cathodes. It can be noticed that the performance of MFC with MN air-cathode was found lowest, which indicated that NrGO and rGO plays a very important role as support materials to improve electrochemical performance of the MN. Furthermore, we have compared MFC performance results of our present study with earlier reported work (Table 2), which assured that the NrGO support affects the MFC performance significantly even when the MN/NrGO loading (0.5 mg cm−2) at the cathode was very low as compared to the literature. From the Table 2, it can be observed that the MFC performance with MN/NrGO air-cathode was observed to be much higher than that of earlier reported work even though the MN/NrGO loading was very low (0.5 mg cm−2) in our study. The excellent performance of the MFC with MN/NrGO cathode was attributed to the improvement of the MN/NrGO electrocatalyst activity for ORR. More importantly, the outstanding performance of the MN/NrGO might be achieved by a one-step simple method by hydrothermal technique. COD removal of the wastewater is also corroborated with the power density of the MFC. Furthermore, the strong interaction and the increased contact area between MN and GO greatly promote the catalyst stability and the electrical conductivity, thus facilitating electron transfer and improving the cathode performance. In addition, oxygen may reach the surface of the MN/NrGO electrocatalyst easily, which results in a decrease of diffusion resistance, mostly due to two-dimensional structure of graphene and of the nanostructures MN. Consequently, the mechanism of MN/NrGO for ORR is more complicated and therefore further studies would be needed to understand it in order to optimize the performance of the system.| Electrocatalysts | Electrocatalysts loading (mg cm−2) | Open circuit voltage (V) | Maximum power density (mW m−2) | COD removal efficiency | References | |
|---|---|---|---|---|---|---|
| Earlier reported work | α-MnO2 | 3 | 0.425 | 22 | 84.1 | 7 |
| α-MnO2 | 8 ± 0.2 | 0.549 ± 15 | 125 ± 11 | NA | 22 | |
| MnO2/CNT | 1 ± 0.1 | 0.440 | 93 | NA | 50 | |
| Present work | MN/NrGO | 0.5 | 0.673 | 135.27 | 88.34 | — |
| MN/rGO | 0.5 | 0.619 | 85.45 | 87.34 | — | |
| rGO | 0.5 | 0.492 | 57.63 | 86.74 | — | |
| MN | 0.5 | 0.462 | 45.56 | 86.21 | — |
4. Conclusions
Nanostructured MN/NrGO, MN/rGO, rGO, and MN electrocatalysts were prepared through a one-step facile hydrothermal method. All the electrocatalysts (MN/NrGO, MN/rGO, rGO, and MN) were used to fabricate air-cathode for MFCs. The electrochemical results towards ORR performed on RDE showed that MN/NrGO was the most effective electrocatalysts in comparison to MN/rGO, rGO and MN electrocatalysts and its electrochemical performance was close to that of Pt/C. Furthermore, EIS studies showed that MN/NrGO electrocatalyst electrode exhibits lower value of Rct in comparison to remaining three electrocatalysts electrodes, which indicated that MN/NrGO had excellent charge transport properties due to NrGO support. The performance order of MFCs with different cathodes was MN/NrGO > MN/rGO > rGO > MN. The MFC air-cathode modified by MN/NrGO, MN/rGO, rGO, and MN electrocatalysts showed that the maximum power density of 135.27 mW m−2 obtained with MN/NrGO was 1.58, 2.34, and 2.96 fold higher than those obtained with pure MN/rGO, rGO, and MN, respectively. This is probably due to better electrical properties and more number of active sites present on the NrGO support of the Mn/NrGO electrocatalyst. Therefore, the results demonstrate that MN/NrGO electrocatalyst based MFCs are suitable to produce maximum power density utilizing wastewater even at very low electrocatalyst loading (0.5 mg cm−2). Hence, MN/NrGO electrocatalyst would be a good alternative cathode catalyst when compared to Pt/C in practical MFC applications. Moreover, the novel MFC design could allow different cathode assemblies, operated over the same anode having developed biofilm. It was a nice solution as the design saved fuel cell startup time. The modular cathode would help in periodic maintenance of the industrial MFC.Acknowledgements
We acknowledge the financial support from Department of Science and Technology, Government of India (New Indigo Project) through the grant no. DST/IMRCD/New Indigo/Bio-e-MAT/2014/(G)/(ii), 5 August 2014.References
- B. E. Logan, Nat. Rev. Microbiol., 2009, 7, 375–381 CrossRef CAS PubMed.
- S. K. Butti, G. Velvizhi, M. L. K. Sulonen, J. M. Haavisto, E. O. Koroglu, A. Y. Cetinkaya, S. Singh, D. Arya, J. A. Modestra, K. V. Krishna, A. Verma, B. Ozkaya, A. M. Lakaniemi, J. A. Puhakka and S. V. Mohan, Renewable Sustainable Energy Rev., 2016, 53, 462–476 CrossRef CAS.
- A. Choudhury, L. Barbora, D. Arya, B. Lal, S. Subudhi, S. V. Mohan, S. Z. Ahammad and A. Verma, Eng. Life Sci., 2016 DOI:10.1002/elsc.201600063.
- H. Liu, S. Cheng and B. E. Logan, Environ. Sci. Technol., 2005, 39, 5488–5493 CrossRef CAS PubMed.
- S. Cheng, H. Liu and B. E. Logan, Electrochem. Commun., 2006, 8, 489–494 CrossRef CAS.
- K. B. Liew, W. R. W. Daud, M. Ghasemi, K. S. Loh, M. Ismail, S. S. Lim and J. X. Leong, Int. J. Hydrogen Energy, 2015, 40, 11625–11632 CrossRef CAS.
- M. Lu, S. Kharkwal, H. Y. Ng and S. F. Y. Li, Biosens. Bioelectron., 2011, 26, 4728–4732 CrossRef CAS PubMed.
- X. Kong, Y. Sun, Z. Yuan, D. Li, L. Li and Y. Li, Int. J. Hydrogen Energy, 2010, 35, 7224–7227 CrossRef CAS.
- S. K. Chaudhuri and D. R. Lovley, Nat. Biotechnol., 2003, 21, 1229–1232 CrossRef CAS PubMed.
- S. You, Q. Zhao, J. Zhang, J. Jiang and S. Zhao, J. Power Sources, 2006, 162, 1409–1415 CrossRef CAS.
- S. E. Oh and B. E. Logan, Appl. Microbiol. Biotechnol., 2006, 70, 162–169 CrossRef CAS PubMed.
- Z. Li, X. Zhang and L. Lei, Process Biochem., 2008, 43, 1352–1358 CrossRef CAS.
- Q. Deng, X. Li, J. Zuo, A. Ling and B. E. Logan, J. Power Sources, 2010, 195, 1130–1135 CrossRef CAS.
- B. E. Logan, Appl. Microbiol. Biotechnol., 2010, 85, 1665–1671 CrossRef CAS PubMed.
- H. Dong, H. Yu, X. Wang, Q. Zhou and J. Feng, Water Res., 2012, 46, 5777–5787 CrossRef CAS PubMed.
- M. S. El-Deab, T. Sotomura and T. Ohsaka, Electrochem. Commun., 2005, 7, 29–34 CrossRef CAS.
- W. E. Mustain and J. Prakash, J. Power Sources, 2007, 170, 28–37 CrossRef CAS.
- F. Zhao, F. Harnisch, U. Schroder, F. Scholz, P. Bogdanoff and I. Herrmann, Electrochem. Commun., 2005, 7, 1405–1410 CrossRef CAS.
- M. Lefevre, J. P. Dodelet and P. Bertrand, J. Phys. Chem. B, 2000, 104, 11238–11247 CrossRef CAS.
- A. L. Bouwkamp-Wijnoltz, W. Visscher, J. A. R. Veen and S. C. Tang, Electrochim. Acta, 1999, 45, 379–386 CrossRef CAS.
- J. M. Morris, S. Jin, J. Wang, C. Zhu and M. A. Urynowicz, Electrochem. Commun., 2007, 9, 1730–1734 CrossRef CAS.
- L. Zhang, C. Liu, L. Zhuangb, W. Li, S. Zhou and J. Zhang, Biosens. Bioelectron., 2009, 24, 2825–2829 CrossRef CAS PubMed.
- S. Liang, F. Teng, G. Bulgan, R. Zong and Y. Zhu, J. Phys. Chem. C, 2008, 112, 5307–5315 CAS.
- Y. L. Cao, H. X. Yang, X. P. Ai and L. F. Xiao, J. Electroanal. Chem., 2003, 557, 127–134 CrossRef CAS.
- M. Voinov, Electrochim. Acta, 1982, 27, 833–835 CrossRef CAS.
- H. Yuan, L. Deng, Y. Qi, N. Kobayashi and M. Hasatani, Int. J. Electrochem. Sci., 2015, 10, 3693–3706 CAS.
- I. Roche, K. Katuri and K. Scott, J. Appl. Electrochem., 2010, 40, 13–21 CrossRef CAS.
- Y. Su, H. Chai, Z. Sun, T. Liu, D. Jia and W. Zhou, Catal. Lett., 2016, 146, 1019–1026 CrossRef CAS.
- J. Zhang, C. Guo, L. Zhang and C. M. Li, Chem. Commun., 2013, 49, 6334–6336 RSC.
- J. Hao, Y. Liu, H. Shen, W. Li, J. Li, Y. Li and Q. Chen, J. Mater. Sci.: Mater. Electron., 2016, 27, 6598–6605 CrossRef CAS.
- T. N. Lambert, D. J. Davis, W. Lu, S. J. Limmer, P. G. Kotula, A. Thuli, M. Hungate, G. Ruan, Z. Jin and J. M. Tour, Chem. Commun., 2012, 48, 7931–7933 RSC.
- S. Khilari, S. Pandit, M. M. Ghangrekar, D. Das and D. Pradhan, RSC Adv., 2013, 3, 7902–7911 RSC.
- G. Gnanakumar, Z. Awan, K. S. Nahm and J. S. Xavier, Biosens. Bioelectron., 2014, 53, 528–534 CrossRef CAS PubMed.
- G. Q. Han, Y. R. Liu, W. H. Hu, B. Dong, X. Li, X. Shang, Y. M. Chai, Y. Q. Liu and C. G. Liu, J. Electrochem. Soc., 2016, 163, H67–H73 CrossRef CAS.
- V. G. Bhide and R. H. Dani, Physica, 1961, 27, 821–826 CrossRef CAS.
- I. Roche and K. Scott, J. Appl. Electrochem., 2009, 39, 197–204 CrossRef CAS.
- H. Yang, J. Jiang, W. Zhou, L. Lai, L. Xi, Y. M. Lam, Z. Shen, B. Khezri and T. Yu, Nanoscale Res. Lett., 2011, 6, 531–539 CrossRef PubMed.
- A. L. M. Reddy, M. M. Shaijumon, S. R. Gowda and P. M. Ajayan, Nano Lett., 2009, 9, 1002–1006 CrossRef CAS PubMed.
- A. K. Geim and K. S. Novoselov, Nat. Mater., 2007, 6, 183–191 CrossRef CAS PubMed.
- K. S. Novoselov, V. I. Falko, L. Colombo, P. R. Gellert, M. G. Schwab and K. Kim, Nature, 2012, 490, 192–200 CrossRef CAS PubMed.
- S. Li, Y. Hu, Q. Xu, J. Sun, B. Hou and Y. Zhang, J. Power Sources, 2012, 213, 265–269 CrossRef CAS.
- Y. Hou, H. Yuan, Z. Wen, S. Cui, X. Guo, Z. He and J. Chen, J. Power Sources, 2016, 307, 561–568 CrossRef CAS.
- Y. Liu, H. Liu, C. Wang, S. X. Hou and N. Yang, Environ. Sci. Technol., 2013, 47, 13889–13895 CrossRef CAS PubMed.
- H. W. Park, D. U. Lee, L. F. Nazar and Z. Chen, J. Electrochem. Soc., 2013, 160, A344–A350 CrossRef CAS.
- C. Chen, W. Fu and C. Yu, Mater. Lett., 2012, 82, 133–136 CrossRef CAS.
- C. Chae, K. W. Kim, Y. J. Yun, D. Lee, J. Moon, Y. Choi, S. S. Lee, S. Choi and S. Jeong, ACS Appl. Mater. Interfaces, 2016, 8, 11499–11506 Search PubMed.
- J. Mei and L. Zhang, Electrochim. Acta, 2015, 173, 338–344 CrossRef CAS.
- L. Barbora, S. Acharya and A. Verma, Macromol. Symp., 2009, 277, 177–189 CrossRef CAS.
- Y. Su, H. Chai, Z. Sun, T. Liu, D. Jia and W. Zhou, Catal. Lett., 2016, 146, 1019–1026 CrossRef CAS.
- Y. Zhang, Y. Hu, S. Li, J. Sun and B. Hou, J. Power Sources, 2011, 196, 9284–9289 CrossRef CAS.
- J. Zhang, C. Chao, N. Liu, H. Zhang, J. Liu, Y. Q. Fu, B. Guo, Z. Wang, S. Lei and P. Hu, Sci. Rep, 2016, 6, 1–10 CrossRef PubMed.
| This journal is © The Royal Society of Chemistry 2016 |

