Ultra-sensitive fluorescence determination of chromium(VI) in aqueous solution based on selectively etching of protein-stabled gold nanoclusters†
Guo Jian-fenga,
Hou Chang-jun*ab,
Yang Mei*a,
Huo Dan-quna and
Fa Huan-baoc
aKey Laboratory of Biorheology Science and Technology, Ministry of Education, College of Bioengineering, Chongqing University, Chongqing, 400044, China. E-mail: houcj@cqu.edu.cn; China.yangmei@cqu.edu.cn; Fax: +86 2365102507; Tel: +86 2365112673
bLiquor Making Bio-Technology & Application of Key Laboratory of Sichuan Province, Zigong 643000, China
cCollege of Chemistry and Chemical Engineering, Chongqing University, Chongqing, 400044, China
First published on 17th October 2016
Abstract
In this work, we have developed a simple, cost-effective and sensitive fluorescent method for the selective determination of chromium(VI) ions (Cr(VI)) in aqueous solution. In the presence of bromide ions (Br−), the strong oxidization of Cr(VI) enables it to selectively etch the bovine serum albumin-stabled gold nanoclusters (BSA-Au NCs) and formed AuBr2− complexes. Proportional fluorescence quenching of BSA-Au NCs induced by the leaching process was closely connected with concentrations of Cr(VI) and thus provided a new detecting strategy towards Cr(VI). Under optimal conditions, the amount-dependent fluorescent response was linearly correlated with the Cr(VI) concentrations ranging from 1.0 nM to 2.5 μM over 3 orders of magnitude, with a detection limit down to 0.6 nM. The as-developed strategy also performed satisfactory selectivity as well as excellent reproducibility. Moreover, this method had been successfully applied to monitor Cr(VI) with real river water samples which demonstrated the potential for field applications.
1. Introduction
Chromium is a natural element widely distributed in rocks, plants, animals, gases and volcanic dusts. Cr(III) and Cr(VI) are the most common valence states observed in nature environment.1,2 On one hand, moderate Cr(III) acts as an essential nutrient element and has great impacts on the metabolism of carbohydrates, proteins, nucleic acids; but on the other hand, overloading Cr(III) could crosslink or bind DNA and proteins, affecting cellular structures and components.3 Compared with Cr(III), Cr(VI) is much more dangerous because of high toxic and strong oxidizing properties. Once trace amounts of Cr(VI) is introduced to human body, it can easily make damage to the liver, kidneys and other organs, causing hemolysis, liver failure and even cancer.4–6 With global expansion of industrial factories, chromium is widespread utilization in industrial processes such as leather tanning, paint making, batteries, welding and chromate production.7 Such chromium containing effluents and slags discharged from excessive industrial processes pose serious threats to both environment and human health. Hence, the United States Environmental Protection Agency (US-EPA) releases a draft that maximum contaminant level of chromium should not exceed 100 ppb in drinking water and the World Health Organization (WHO) also suggests that the guideline values of total chromium and Cr(VI) in drinking water is 50 ppb and 16 ppb, respectively.1,8–10 Therefore, developing cost-effective and sensitive methods for real-time monitoring of Cr(VI) is still imperative.In recent years, different quantitative techniques based on large scientific instruments have become the conventional methods for Cr(VI) detection, such as inductively coupled plasma mass spectrometry (ICP-MS),11 atomic absorption spectroscopy (AAS)12 and X-ray fluorescence (XRF).13 Although these strategies always show high accuracy and rapid responses, they unavoidable suffer from disadvantages such as sophisticated pretreatment, high cost and requirement of skillful operation, which render them unsuitable for on-site monitoring.2,14–16 In the meantime, metal nanoclusters based fluorescent nanosensors are extremely attractive in chemical and biological analysis, as their distinct advantages of distinctive optical, electrical, and chemical properties.9 Of particular interest are those based on gold nanoclusters (Au NCs), as their ultra-small particle size, large Stokes shift, strong fluorescence, lower background signal, long time stability and low toxicity. Probes of detecting heavy metal ions such as As3+, Fe3+ and Cu2+ that based on the fluorescence quenching of Au NCs, have proven to be simple, rapid and cost-effective.17–20 Nevertheless, the majority of these probes depend on the electrostatic absorption or cross-linking between Au NCs and analytes, while there are little researches about directly redox route to quench the fluorescence of Au NCs.
Herein, to the best of our knowledge, a ultra-sensitive fluorescent method based on selectivity etching of Au NCs was first developed to detect Cr(VI) in aqueous solution. In the presence of Br−, the standard electron potential of Au(I)/Au(0) is lower than that of Cr(VI)/Cr(III), which enables gold to be oxidized by Cr(VI). With the leaching processes of gold enhancing, the fluorescence intensity of Au NCs decreased gradually. Thus, we can quantify the concentrations of Cr(VI) according to the fluorescence responses of Au NCs. As compared to other reports, the developed method is more sensitive, cost-effective and practical for sensing of Cr(VI) in just several minutes at room temperature. Besides, we also tested the practicality of this method for detecting Cr(VI) in real river water samples, which demonstrated the potential for field applications.
2. Experimental sections
2.1. Apparatus
Images of dispersed BSA-Au NCs were achieved by transmission electron microscopy (TEM, JEOL Ltd., Japan). SEM-EDX was measured on JEOL-JSM 6701F scanning electron microscope (SEM, Hitachi Ltd., Japan). Ultraviolet spectrum measurement was performed using a UV-2700 spectrophotometer (Tsushima, Japan). All fluorescence measurements were carried out on a RF-5301 fluorescence spectrophotometer (Shimadzu, Japan). The pH value was adjusted by a pH-meter PHS-25C (Shanghai, China).2.2. Materials
Gold acid chloride trihydrate (HAuCl4·3H2O) (99.0%) was purchased from Aladdin Industrial Inc. (Shanghai, China). Bovine serum albumin (BSA) was purchased from Sigma-Aldrich (St. Louis, USA). Hydrobromic acid (HBr) (47.0% aqueous solution), potassium dichromate (99.8%), acetic acid (HAc), sodium hydroxide (NaOH), ethylenediaminetetraacetic acid disodium salt (EDTA-2Na) and all other fundamental reagents (analytical reagent grade) were purchased from Titan (Shanghai, China) without further purification. All aqueous solutions were prepared with deionized water (resistivity, 18.2 MΩ cm−1) from Millipore Direct-Q Water system (Mosheim, France).2.3. Preparation of bovine serum albumin stabled gold nanoclusters
Au NCs were synthesized via reduction of HAuCl4 with BSA as both reducing and protecting agent according to the previous report with slightly modifications.21 Briefly, 5.0 ml aqueous solution of BSA (50 mg ml−1) was prepared by dissolving BSA in deionized water under vigorous stirring at 37 °C, then aqueous HAuCl4 solution (5.0 ml, 10 mM) was added to BSA solution slowly. About two minutes later, NaOH solution (1.0 M) was introduced to adjust the pH around 12, and the mixtures were continually incubated at 37 °C for 20 h under vigorous stirring. The obtained BSA-Au NCs solution was stored at 4 °C for further use.2.4. Fluorescence determination of Cr(VI) with BSA-Au NCs
For Cr(VI) sensing, HBr (2.0 M, 0.3 ml) aqueous solution was added to a 5 ml centrifuge tube and diluted with deionized water to 2.0 ml in order to decrease the solution acidity. Then 0.3 ml BSA-AuNCs aqueous solution was added into the test tube and spiked with standard Cr(VI) aqueous solution. Finally, the appropriate concentration of NaOH was used to diluted the mixture solution to 3.0 ml and adjust the pH to 1.0. The final concentrations of Cr(VI) in the test solution was ranged from 1.0 nM to 20.0 μM. After rapid thorough mixing, the solution was incubated at room temperature for 3 minutes and the corresponding fluorescence spectra of BSA-Au NCs were recorded.2.5. Feasibility test with river water samples
The real environment water sample was collected from Jialing River (Chongqing, China) and filtered through a Millipore cellulose membrane (0.2 μm) before use. The measuring strategy was described as above and the accurate Cr(VI) concentration was detected using inductively coupled plasma mass spectrometry (ICP-MS), and subsequently used to calculate recovery values.3. Results and discussion
3.1. Characterization of the BSA-Au NCs
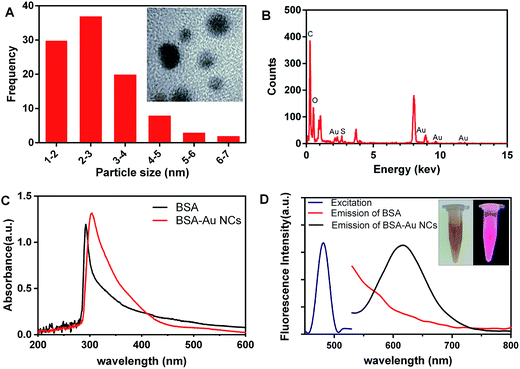
In our study, the Au NCs were synthesized by a simple, one-pot and “green” route, based on the capability of a common commercially available BSA, for the preparation of Au NCs at the physiological temperature with red emission. TEM image was applied to characterize the morphology of as-prepared BSA-Au NCs. As Fig. 1(A) shows, the BSA-Au NCs were spherical in shape and well dispersed with the average size of 3.4 ± 0.6 nm calculated by counting the average size of 100 particles. SEM-EDX spectrum showed the presence of C, O, S and Au element, the main compositions of BSA-Au NCs, further indicating the successful synthesis of BSA-Au NCs.The typical UV-vis absorption spectra of BSA and BSA-Au NCs aqueous solution is shown in Fig. 1(C). The UV-vis absorption spectrum of BSA aqueous solution exhibited maximum surface plasmon resonance (SPR) absorption at 280 nm that corresponding to previous researches. But for the BSA-Au NCs aqueous solution, the absorption peak had a red shift to 310 nm and this phenomenon could account for the synthetic Au NCs binding to the surfaces of BSA. Generally, gold nanoparticles with diameter over 10 nm usually exists the surface plasmon resonance absorption around 500 nm.1,22–25 Nevertheless, the as-prepared BSA-Au NCs that different from these reported gold nanoparticles as the SPR absorption around 500 nm is lacking, indicating that the diameter of the prepared material was relatively smaller and have unique optical properties.20 For the fluorescent properties of BSA-Au NCs, the color was brown under visible light and bright red under UV light (Fig. 1(D), the inset photographs), indicating that highly fluorescent materials were formed. The fluorescent BSA-Au NCs showed excitation and emission peaks at 480 and 615 nm, respectively (Fig. 1(D)) while BSA solution was lacking of emission peaks at 615 under the same excitation wavelength so we can assume that the sources of fluorescence was derived from Au NCs. We have also carefully evaluated the stability of BSA-Au NCs under different pH, time and temperature (Fig. S1–S3†). The as-prepared BSA-Au NCs show satisfactory performances even under extreme pH and temperature. Besides, the fluorescence of BSA-Au NCs only has slightly quenching after a month and we may attribute the favorable stability to the protection of BSA.
3.2. Sensing mechanism
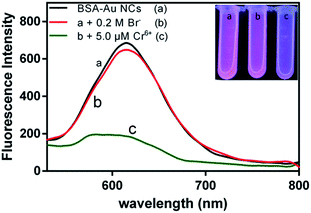
Scheme 1 illustrates the sensing mechanism of proposed method in our study. Briefly, Au NCs with red emissions at 615 nm have high fluorescence under the excitation at 480 nm and that is unique optical property for particular size. As we know, the standard electron potential of Au(I)/Au(0) and Cr(VI)/Cr(III) is 1.69 eV and 1.33 eV, respectively and thus Cr(VI) does not have the enough ability to etching gold in most instances.26–28 Nevertheless, in the presence of Br−, the electron potential of Au(I)/Au(0) decreased because the bromide ions as ligands of gold and formed the AuBr2− compounds. Along with the selective etching processes of gold on the surface of Au NCs by Cr(VI), the amount and size of Au NCs decreased gradually and thus induced the corresponding fluorescence quenching. Therefore, we can quantitate the level of Cr(VI) by monitoring the fluorescence intensity change (ΔF).In order to better understand the roles that Cr(VI) and Br− play in the leaching processes of BSA-Au NCs, the fluorescence emission spectra of BSA-Au NCs aqueous solution was observed (Fig. 2). The initial BSA-Au NCs exhibited a high fluorescence emission peaks located at 615 nm (curve a). After addition of 0.2 M Br− and adjust the pH to 1, only a negligible fluorescence quenching because of few relatively unstable Au NCs aggregated (curve b) under strong acid environment. However, upon Cr(VI) was added into the reaction system, the fluorescence emission intensity of BSA-Au NCs decreased dramatically (curve c) and it was caused by the violent etching processes of Au NCs induced by Cr(VI).
3.3. Optimization of the conditions for Cr(VI) measurement
In order to optimize the conditions for the Cr(VI) measurement, relevant experimental parameters, including pH value, concentration of Br− and incubation time were carefully evaluated in our research.As a critical factor for the Cr(VI) measurement, the influence of pH was first investigated in our study. On one hand, the electron potential of Cr(VI)/Cr(III) deceases along with increasing pH, e.g., the electron potentials of Cr(VI)/Cr(III) are 1.271 eV and 0.995 eV calculated by Nernst equation when pH values are 1.0 and 3.0, respectively. Thus, the lower pH environment can increase the oxidation ability of Cr(VI) and enhancing the etching of gold.27 But on the other hand, the keeping decreased pH circumstance might influence the stability of BSA-Au NCs as well as selectivity of as-developed method. So took both aspects into consideration, we chose pH = 1.0 for further investigations (Fig. 3(A)).
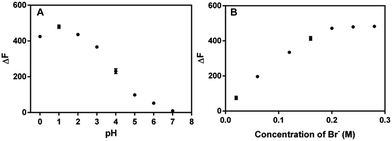 | ||
| Fig. 3 (A) Influence of pH and (B) concentration of Br− on the fluorescence intensity of BSA-Au NCs in the presence of 5.0 μM Cr(VI). | ||
Then, as ligand of gold, Br− also played an indispensable role in detecting Cr(VI). As proved in Fig. 3(B), the response enhanced gradually with increasing concentration of Br− and reached maximum at 0.2 M. As we had discussed above, Br− can decrease the electron potentials of gold by forming AuBr2− compounds and thus accelerating the leaching of Au NCs. Nevertheless, high concentration of Br− might reduce the selectivity of proposed method and the excessive Br− might also react with Cr(VI) as the electron potentials of Br(0)/Br− is 1.09 eV. Considering both sensitivity and selectivity, 0.2 M Br− was used in later studies.
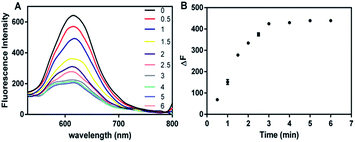
Apart from pH and concentration of Br−, the incubation response time was final to discuss in our study. Commonly, the redox etching of gold is a slow process, always taking plenty time and requiring extra incubation temperature to accelerate reaction.22,24,29–32 However, we got a favorable dynamic response time as shown in Fig. 4, the whole detecting procedure need no more than 3 minutes without any extra assistance such as heating or microwave irradiation. The satisfactory result could be attributed to the ultra-large specific surface area of Au NCs which greatly accelerating the redox etching procedure.
3.4. Sensitivity in analyzing Cr(VI) with BSA-Au NCs
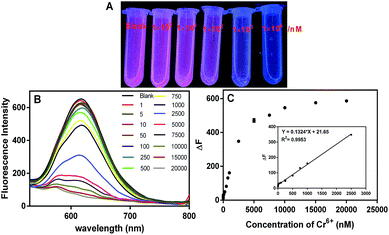
In order to study the sensitivity (linearity and detection limit) of the proposed method, under optimum conditions, the fluorescence of BSA-Au NCs was monitored in the presence of a series of gradient concentrations of Cr(VI). As shown in Fig. 5(B), upon increasing of Cr(VI) concentration ranged from 1.0 nM to 20.0 μM, the fluorescence intensity of BSA-Au NCs decreased gradually, indicating an enhancement of gold leaching. We obtained a favorable linear relationship (R2 = 0.9953) between the difference values of fluorescence intensity (ΔF) and the concentrations of Cr(VI) over the range from 1.0 nM to 2.5 μM with detection limit was 0.6 nM calculated with 3δ/k, where δ is the standard deviation for 11 blank samples and k is the slope of calibration line (Fig. 5(C)). The photographic images under UV light also showed the corresponding color changes and the concentration of Cr(VI) over 10.0 nM could easily distinguished through naked eyes (Fig. 5(A)), indicating the as-developed method had a potential on-site application in the monitoring of Cr(VI). Besides, Table 1 lists some performance comparisons between the presented method and published analytical techniques, with the result indicating the outstanding performance on tracing Cr(VI).| Detection technique | Probe | Detection range (μM) | Detection limit (μM) | Ref. |
|---|---|---|---|---|
| Colorimetry | GNRs | 0.1–20 | 0.088 | a27 |
| Colorimetry | AA-capped AgNPs | 0.08–1.84 | 0.05 | b33 |
| FRET | CdTe@SiO2 and RhB | 0.02–0.3 | 0.0062 | c34 |
| Fluorimetry | G-C3N4 nanosheets | 0.6–300 | 0.15 | d35 |
| Fluorimetry | SRBH | 0.01–0.3 | 0.0015 | e4 |
| Fluorimetry | BHABN | 2.5–90 | 0.36 | f5 |
| Fluorimetry | Cu-NCs | 0.05–60 | 0.043 | g36 |
| Fluorimetry | BSA-Au NCs | 0.001–2.5 | 0.0006 | This work |
3.5. Specificity in analyzing Cr(VI) with BSA-Au NCs
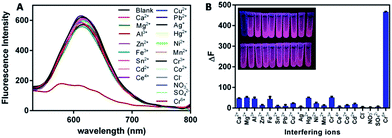
Apart from sensitivity, the specificity is another critical factor that dominates the performance of the proposed method. Therefore, other potential interfering ions in nature water system, including 50.0 μM Ca2+, Mg2+, Al3+, Zn2+, Fe3+, Sn2+, Pb2+, Cu2+, Ag+, Ni2+, Mn2+, Cr3+, Ce4+, Co2+, Cd2+, Cl−, NO3−, SO42− were examined under optimum conditions. As Fig. 6 shows, high concentration of interfering ions only induced negligible or slightly fluorescence quenching of BSA-Au NCs, while tenth concentration of Cr(VI) causing a dramatically fluorescence intensity decrease. According to previous study, Hg2+ could quench the fluorescence of BSA-Au NCs as the interaction effects between Hg2+ with Au+.37 In order to remove the possible influence of Hg2+, 0.1 M EDTA-2Na aqueous solution was successfully used as masking ligand to remove Hg2+ at pH = 10 before test (Fig. S4†). The principle operates might be that the strong chelating effects between EDTA-2Na and Hg2+ (the formation constant = ∼21.8) and the chelate complexes are stable enough at pH = 1 which avoiding the interaction of Hg2+ with Au+.38 Besides, we also checked the effect of EDTA-2Na aqueous solution on detection of other interfering ions including Cr(VI). As a strong heavy metal chelating agent, EDTA-2Na could chelate with metal ions easily such as Ca2+, Mg2+, Mn2+ etc. while Cr(VI) mostly exists in the form of dichromate that cannot chelate with EDTA-2Na, which greatly reducing the influence from other metal ions.39 As shown in Fig. S5,† the striking contrast demonstrated that as-prepared method has strong resistance to interfering ions and that might attribute to the chelating effects of EDTA-2Na and the selectivity etching of gold induced by Cr(VI) in the complex environment.3.6. Repeatability and reproducibility in analyzing Cr(VI) with BSA-Au NCs
Repeatability and reproducibility is an important factor to character the performance of sensors. Thus, we also test the repeatability and reproducibility by evaluating on the response using the as-developed method in different batches, each of which was measured with 5 repeated tests. As shown in Fig. S6,† although slight fluctuation of response for different parallel tests in different batches, the average signal remains consistent after reaction with 5.0 μM Cr(VI). According to the statistical analysis, the relative standard deviations (R.S.D.) of 5 repeat tests in different batches were ranged 0.74% to 1.98% and the R.S.D. of the 10 batches test was 3.86%, demonstrating the excellent performance in detecting Cr(VI).3.7. Application of the method to detect Cr(VI) in river water samples
Although BSA-Au NCs and Br− have little toxicity in our study, the tests need to be operated under acid condition. Thus, the proposed method has low toxicity and was adapted more to detecting Cr(VI) in nature water system. Therefore, herein, samples of Jialing River (Chongqing, China) water were used to test the practicality of the proposed method. Simultaneously, the accurate concentration in the water sample was measured using ICP-MS. The results in Table 2 show that the recoveries ranged from 93.92% to 103.50%, demonstrating the high potential of our method for Cr(VI) quantification in real environmental water samples.| River sample | Spiked [Cr6+]/μM | Detected/μM | R.S.D.% (n = 5) | Recovery/% |
|---|---|---|---|---|
| 1# | 0 | 0.0235 | — | — |
| 2# | 0.5 | 0.4931 | 1.301 | 93.92 |
| 3# | 1.0 | 1.0585 | 2.442 | 103.50 |
| 4# | 2.0 | 1.9879 | 2.187 | 98.22 |
4. Conclusion
In summary, a ultra-sensitive fluorescent method for detecting Cr(VI) was first developed based on the redox etching gold on the surface of red emission BSA-Au NCs. The fluorescence quenching induced by leaching processes have positive correlation with concentrations of Cr(VI), providing a cost-effective detecting strategy towards Cr(VI). As compared to other reported sensing methods, the proposed sensor offers many advantages, such as simplicity, practicality, high sensitivity, good selectivity as well as excellent repeatability and reproducibility. Moreover, the detection procedure could be completed in just 3 minutes without any extra assistance such as heating or microwave irradiation. Besides, the color change induced by Cr(VI) as low as 10 nM is remarkable enough to be observed under UV light by naked-eyes, making it a promising approach for on-line monitoring of Cr(VI) in water samples.Acknowledgements
The authors would like to acknowledge the financial support from National Natural Science Foundation of China (No. 31171684), Chongqing Graduate Student Research Innovation Project (CYS15010), CSTC2015shmszxl20097 and the workstation in Sichuan Province GY2015-01.Notes and references
- W. Chen, F. Cao, W. Zheng, Y. Tian, Y. Xianyu, P. Xu, W. Zhang, Z. Wang, K. Deng and X. Jiang, Nanoscale, 2015, 7, 2042–2049 RSC.
- M. Elavarasi, M. L. Paul, A. Rajeshwari, N. Chandrasekaran, A. B. Mandal and A. Mukherjee, Anal. Methods, 2012, 4, 3407–3412 RSC.
- M. L. Zhao, L. G. Ma, M. Zhang, W. G. Cao, L. T. Yang and L. J. Ma, Spectrochim. Acta, Part A, 2013, 116, 460–465 CrossRef CAS PubMed.
- A. F. Zheng, J. L. Chen, G. H. Wu, G. L. Wu, Y. G. Zhang and H. P. Wei, Spectrochim. Acta, Part A, 2009, 74, 265–270 CrossRef PubMed.
- Z. Y. Zhang, C. M. Sha, A. F. Liu, Z. Y. Zhang and D. M. Xu, J. Fluoresc., 2015, 25, 335–340 CrossRef CAS PubMed.
- C. X. Sui, Y. F. Liu, W. H. Zhang, P. A. Li and D. Zhang, Microchim. Acta, 2014, 181, 347–353 CrossRef CAS.
- H. Li, T. Wu, B. Cai, W. Ma, Y. Sun, S. Gan, D. Han and L. Niu, Appl. Catal., B, 2015, 164, 344–351 CrossRef CAS.
- W.-H. Leung, L. Zou, W.-H. Lo and P.-H. Chan, ChemPlusChem, 2013, 78, 1440–1445 CrossRef CAS.
- J. R. Zhang, A. L. Zeng, H. Q. Luo and N. B. Li, J. Hazard. Mater., 2016, 304, 66–72 CrossRef CAS PubMed.
- F. Y. Zheng, X. F. Lin, H. W. Yu, S. X. Li and X. G. Huang, Sens. Actuators, B, 2016, 226, 500–505 CrossRef CAS.
- B. Wen, X. Q. Shan and J. Lian, Talanta, 2002, 56, 681–687 CrossRef CAS PubMed.
- J. Chwastowska, W. Skwara, E. Sterlinska and L. Pszonicki, Talanta, 2005, 66, 1345–1349 CrossRef CAS PubMed.
- I. Tsuyumoto and Y. Maruyama, Anal. Chem., 2011, 83, 7566–7569 CrossRef CAS PubMed.
- J. Zou, Y. Tang, Y. Zhai, H. Zhong and J. Song, Anal. Methods, 2013, 5, 2720–2726 RSC.
- D. W. Zhang, Z. Y. Dong, X. Z. Jiang, M. Y. Feng, W. Li and G. H. Gao, Anal. Methods, 2013, 5, 1669–1675 RSC.
- M. Zheng, Z. G. Xie, D. Qu, D. Li, P. Du, X. B. Jing and Z. C. Sun, ACS Appl. Mater. Interfaces, 2013, 5, 13242–13247 CAS.
- S. Roy, G. Palui and A. Banerjee, Nanoscale, 2012, 4, 2734–2740 RSC.
- J. A. Ho, H. C. Chang and W. T. Su, Anal. Chem., 2012, 84, 3246–3253 CrossRef PubMed.
- W. Chen, X. Tu and X. Guo, Chem. Commun., 2009, 1736–1738, 10.1039/b820145e.
- H. Y. Zhang, Q. Liu, T. Wang, Z. J. Yun, G. L. Li, J. Y. Liu and G. B. Jiang, Anal. Chim. Acta, 2013, 770, 140–146 CrossRef CAS PubMed.
- J. Xie, Y. Zheng and J. Y. Ying, J. Am. Chem. Soc., 2009, 131, 888–889 CrossRef CAS PubMed.
- Y.-Y. Chen, H.-T. Chang, Y.-C. Shiang, Y.-L. Hung, C.-K. Chiang and C.-C. Huang, Anal. Chem., 2009, 81, 9433–9439 CrossRef CAS PubMed.
- X. Wang, Y. Wei, S. Wang and L. Chen, Colloids Surf., A, 2015, 472, 57–62 CrossRef CAS.
- Y.-M. Fang, J. Song, J.-S. Chen, S.-B. Li, L. Zhang, G.-N. Chen and J.-J. Sun, J. Mater. Chem., 2011, 21, 7898–7900 RSC.
- P.-C. Chen, P. Roy, L.-Y. Chen, R. Ravindranath and H.-T. Chang, Part. Part. Syst. Charact., 2014, 31, 917–942 CrossRef CAS.
- G. Jian-feng, H. Chang-jun, Y. Mei, H. Dan-qun, L. Jun-jie, F. Huan-bao, L. Hui-bo and Y. Ping, Anal. Methods, 2016, 8, 5526–5532 RSC.
- F.-M. Li, J.-M. Liu, X.-X. Wang, L.-P. Lin, W.-L. Cai, X. Lin, Y.-N. Zeng, Z.-M. Li and S.-Q. Lin, Sens. Actuators, B, 2011, 155, 817–822 CrossRef CAS.
- J. Xin, F. Zhang, Y. Gao, Y. Feng, S. Chen and A. Wu, Talanta, 2012, 101, 122–127 CrossRef CAS PubMed.
- R. Liu, Z. Chen, S. Wang, C. Qu, L. Chen and Z. Wang, Talanta, 2013, 112, 37–42 CrossRef CAS PubMed.
- S. Wang, Z. Chen, L. Chen, R. Liu and L. Chen, Analyst, 2013, 138, 2080–2084 RSC.
- S. K. Tripathy, J. Y. Woo and C.-S. Han, Sens. Actuators, B, 2013, 181, 114–118 CrossRef CAS.
- X. Fu, T. Lou, Z. Chen, M. Lin, W. Feng and L. Chen, ACS Appl. Mater. Interfaces, 2012, 4, 1080–1086 CAS.
- X. Wu, Y. Xu, Y. Dong, X. Jiang and N. Zhu, Anal. Methods, 2013, 5, 560–565 RSC.
- H. L. Tao, M. Z. Xu, Q. J. Zhang, X. H. Zhang, S. H. Li, F. X. Zhong, C. Sun and X. F. Liao, Anal. Methods, 2013, 5, 5961–5968 RSC.
- M. C. Rong, L. P. Lin, X. H. Song, Y. R. Wang, Y. X. Zhong, J. W. Yan, Y. F. Feng, X. Y. Zeng and X. Chen, Biosens. Bioelectron., 2015, 68, 210–217 CrossRef CAS PubMed.
- M. L. Cui, G. Song, C. Wang and Q. J. Song, Microchim. Acta, 2015, 182, 1371–1377 CrossRef CAS.
- J. Xie, Y. Zheng and J. Y. Ying, Chem. Commun., 2010, 46, 961–963 RSC.
- Y.-F. Lee and C.-C. Huang, ACS Appl. Mater. Interfaces, 2011, 3, 2747–2754 CAS.
- H. Zhang, Q. Liu, W. Thanh, Z. Yun, G. Li, J. Liu and G. Jiang, Anal. Chim. Acta, 2013, 770, 140–146 CrossRef CAS PubMed.
Footnote |
| † Electronic supplementary information (ESI) available. See DOI: 10.1039/c6ra23222a |
| This journal is © The Royal Society of Chemistry 2016 |

