Spectrometric and kinetics studies involving anionic chromogenic chemodosimeters based on silylated imines in acetonitrile or acetonitrile–water mixtures†
Celso R. Nicoleti,
Leandro G. Nandi,
Gianluca Ciancaleoni and
Vanderlei G. Machado*
Department of Chemistry, Universidade Federal de Santa Catarina, CP 476, Florianópolis, Santa Catarina 88040-900, Brazil. E-mail: vanderlei.machado@ufsc.br
First published on 18th October 2016
Abstract
Three chromogenic anionic chemodosimeters (1–3) based on silylated imines were synthesized and characterized. Solutions of compound 1 in acetonitrile with 4.0% (v/v) of water are colorless, but with the addition of several anions only CN−, and to a lesser extent F−, changed the color of the solutions to orange. However, compounds 2 and 3 were selective toward F− in acetonitrile. The nucleophilic attack of F− or CN− on the silicon center of the chemodosimeters, through an SN2@Si mechanism, released colored phenolates as leaving groups. PGSE NMR data corroborated the mechanism postulated for the reaction. Kinetics studies were carried out, revealing that a higher second-order rate constant was obtained for the reaction of 1 with F−. The addition of water to the system reduces the nucleophilicity of F−, showing a slower second-order rate constant in relation to CN−, the latter anion being less hydrated and the more reactive species for the nucleophilic attack on the silicon center of 1.
Introduction
Anion species are fundamental in many biological, environmental and industrial systems due to their structural features and reactivity.1–13 Two examples of anions of great importance in many fields are cyanide (CN−) and fluoride (F−). CN− is a very toxic species due to its strong binding affinity with the active site of the enzyme cytochrome-oxidase, causing a decrease in oxidative metabolism and cell death.14 In addition, CN− is found in some fruit seeds,15 roots,16 and insects,17,18 the anion being delivered by means of the hydrolysis of cyanogenic glycosides. The other anion, F−, exhibits a beneficial effect regarding dental care.19 However, acute F− toxicity can result in gastric and kidney disorders, skeletal fluorosis, and even death. Moreover, some studies have suggested that F− exposure is toxic to the brain.20Various methods have been used to determine F− and CN−, but often they require sophisticated instrumentation and are associated with high costs.21–24 In the search for easy, efficient, and low cost alternatives, many research groups have reported chromogenic and fluorogenic chemodosimeters for the selective detection of anionic species.25–27 This strategy is based on irreversible chemical reactions between a nucleophile and a chemodosimeter with electrophilic centers.28–30
Various chemodosimeters have been designed in recent years for the detection and quantification of CN−![[thin space (1/6-em)]](https://www.rsc.org/images/entities/char_2009.gif) 31–37 and F−
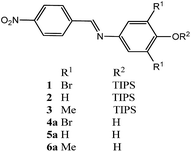
31–37 and F−![[thin space (1/6-em)]](https://www.rsc.org/images/entities/char_2009.gif) 38–46 in different media. Many of these systems have been designed for the detection of F− based on the cleavage of the Si–O bond in organic,47–50 organic-water,40,51–55 and aqueous media,56–61 considering the strong affinity between F− and silicon. Recently, we reported a chromogenic chemodosimeter based on 3,5-dibromo-N-(4-nitrobenzylidene)-4-[(triisopropylsilyl)oxy]aniline (1; Fig. 1) for the highly selective detection of CN− in an aqueous micellar system.62 This study represented the first report found in the literature involving the chemodosimeter approach based on the cleavage of the Si–O bond for the detection of CN− in purely aqueous solutions. This system is able to detect CN− in water and in human blood plasma, with high sensitivity and specific selectivity.62
38–46 in different media. Many of these systems have been designed for the detection of F− based on the cleavage of the Si–O bond in organic,47–50 organic-water,40,51–55 and aqueous media,56–61 considering the strong affinity between F− and silicon. Recently, we reported a chromogenic chemodosimeter based on 3,5-dibromo-N-(4-nitrobenzylidene)-4-[(triisopropylsilyl)oxy]aniline (1; Fig. 1) for the highly selective detection of CN− in an aqueous micellar system.62 This study represented the first report found in the literature involving the chemodosimeter approach based on the cleavage of the Si–O bond for the detection of CN− in purely aqueous solutions. This system is able to detect CN− in water and in human blood plasma, with high sensitivity and specific selectivity.62
The features exhibited by compound 1 as chemodosimeter have motivated us to study the reaction of this and related compounds with anionic species using different techniques, in order to provide evidences on the mechanism of the reaction. Thus, herein we report studies involving compound 1 and two novel silylated imines (2, 3) as chemodosimeters for the detection specifically of CN− and F− anions in acetonitrile and acetonitrile–water mixtures, using UV-vis, 1H NMR, and HRMS techniques. The phenols 4a–6a were also synthesized in order to compare their corresponding phenolates with the products of the reactions of 1–3 with the anions.
Results and discussion
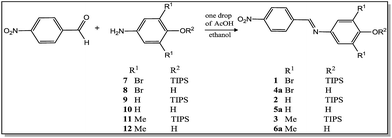
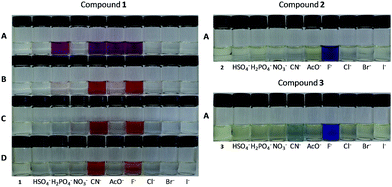
Scheme 1 shows the synthesis of the compounds. Silylated imines (1–3) and their corresponding phenols (4a–6a) were synthesized following a methodology described in the literature62,63 by condensation of the corresponding amines 7–12 with 4-nitrobenzaldehyde in the presence of a small amount of acetic acid. The novel compounds 2, 3, and 6a were characterized by means of IR, 1H NMR, 13C NMR, and HRMS spectrometric techniques.Fig. 2A shows the influence of the individual addition of different anions (HSO4−, H2PO4−, NO3−, CN−, AcO−, F−, Cl−, Br−, and I−) as tetra-n-butylammonium salts to solutions of compounds 1–3 in acetonitrile. The solutions of these compounds are colorless, but in the presence of the anions only H2PO4−, CN−, AcO− and F− caused the appearance of a pink color for compound 1. Only F− (and to a much lesser extent CN−) was able to cause changes to violet for compound 2 and blue for compound 3. The colors of the resulting solutions match the colors of their corresponding phenolate dyes 4b–6b obtained through the deprotonation of compounds 4a–6a (see ESI†).
Fig. 2B–D shows that on the addition of a small amount (4.0%) of water to the solutions of 1, only CN−, and to a lesser extent F−, caused a change in the solution color to orange. The change in the color of the resulting solution from pink in acetonitrile to orange with the addition of 4.0% of water is due to the fact that the dye generated (4b) is a strongly solvatochromic species.64,65 The fact that the addition of a small amount of water makes the system highly selective toward CN− in comparison with other anions has been exploited in the literature,63,66–70 especially in studies involving chromogenic chemosensors based on acid–base strategies. The explanation relates to the fact that the free energies of hydration for H2PO4− (−465 kJ mol−1), F− (−465 kJ mol−1), and AcO− (−365 kJ mol−1) are high in comparison to that observed for CN− (−295 kJ mol−1).71,72 CN− is less hydrated with the addition of water, being a more strongly nucleophilic species than the other species and therefore it is more able to carry out a nucleophilic attack on the silicon center in the compound 1, displacing the colored species 4b as a leaving group.
Fig. 3 shows the UV-vis spectra and the relative absorbance values for solutions of 1 in the absence and presence of the anions. For compound 1 in acetonitrile (Fig. 3A) a band with a maximum at 360 nm appears, which decreases in intensity with the addition of H2PO4−, CN−, AcO− and F− due to Si–O bond cleavage, with the simultaneous appearance of another band with a maximum at 516 nm, related to phenolate 4b. With the addition of 4.0% (v/v) of water (Fig. 3B), CN−, and to a lesser extent F−, causes the appearance of the band in the visible region, with a maximum at 484 nm.
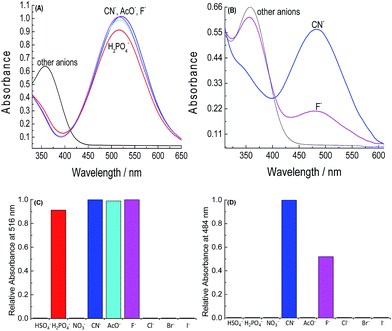 | ||
| Fig. 3 UV-vis spectra for solutions of 1 in the presence of HSO4−, H2PO4−, NO3−, CN−, AcO−, F−, Cl−, Br−, and I−, as tetra-n-butylammonium salts (A) in acetonitrile and (B) in acetonitrile with 4.0% (v/v) of water and respective relative absorbance values (C) in acetonitrile and (D) in acetonitrile with 4.0% of water. For concentrations of 1 and the anions, see Fig. 1. All spectra were made 5 min after the addition of the anions. | ||
Fig. 4A and B shows the UV-vis spectra for solutions of 2 and 3 in the absence and presence of the anions and Fig. 4C and D exhibits their corresponding relative absorbance values. Compounds 2 and 3 in acetonitrile (Fig. 4A and B) have bands with maximum absorbance at 372 nm and 380 nm, respectively. The addition of CN− and F− decreases the intensity of the bands, due to Si–O bond cleavage, with the simultaneous appearance of another band, with a maximum at 550 nm for 2, coinciding with that verified for the phenolate 5b, and at 614 nm for compound 3, which coincides with that verified for compound 6b.
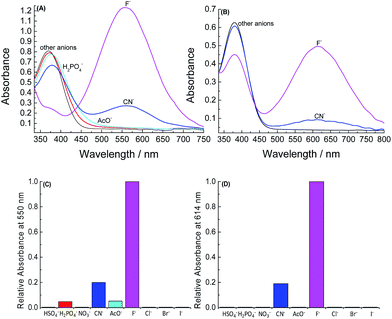 | ||
| Fig. 4 UV-vis spectra for solutions of (A) 2 and (B) 3 in the presence of HSO4−, H2PO4−, NO3−, CN−, AcO−, F−, Cl−, Br−, and I−, as tetra-n-butylammonium salts in pure acetonitrile and (C and D) respective relative absorbance values. For concentrations of 2, 3, and the anions, see Fig. 1. All spectra were made 5 min after the addition of the anions. | ||
1H NMR studies were performed for compound 1 in CD3CN with the addition of consecutive aliquots of CN− (Fig. 5). Compound 1 shows the singlet at δ 8.67 ppm (Ha), corresponding to the proton of the imine group, the doublet at δ 8.10 ppm (Hb) of the aromatic protons and another doublet assigned to the triisopropyl group at δ 1.17 ppm (Hc). After the addition of 1.3 equivalents of CN− these signals disappeared. Simultaneously, the spectrum of the product exhibited the signals of a singlet at δ 8.51 ppm (Hd), a doublet at δ 7.96 ppm (He), and a distorted doublet at δ 1.02 ppm (Hf). More detailed 1H NMR analysis showed that the chemical shifts of the final spectrum coincide with the 1H NMR spectrum of 4a in the presence of CN− in excess (Fig. S2†), indicating that the species generated (4b) is the same in the two cases. The results of the titration experiments obtained employing 1 with F− using the 1H NMR technique were similar to those found for CN−. Similar 1H NMR spectrometry results were obtained for 2, 3, and their corresponding phenols (5a and 6a) in CD3CN with the addition of several equivalents of F− (Fig. S4–S7†).
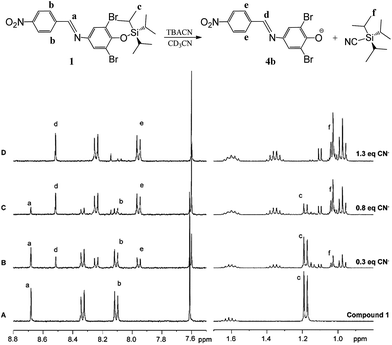 | ||
| Fig. 5 1H NMR spectra (400 MHz, CD3CN) of 1 (A) in the absence and in the presence of (B) 0.3, (C) 0.8, and (D) 1.3 equivalents of tetra-n-butylammonium cyanide. | ||
A similar titration experiment was carried out to study the interaction between 1 and tetra-n-butylammonium fluoride in CD3CN (Fig. 6). Analysis of the 1H NMR spectra shows that after the addition of 1.2 equivalents of F− to a solution of 1 (2.7 mmol L−1) in CD3CN the peaks relative to 1 are completely absent. In particular, the doublet related to the isopropyl groups shifts from δ 1.17 to 1.07 ppm and the septet of the same groups shifts from δ 1.60 to 1.13 ppm, assuming a more complex pattern. On the other hand, a sharp signal at δ −187 ppm appears in the 19F NMR spectrum (Fg, see Fig. 6).
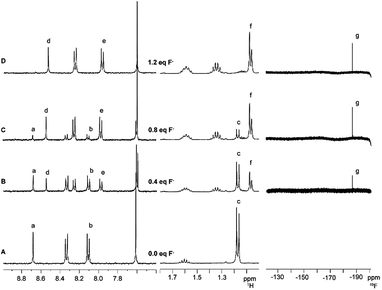 | ||
| Fig. 6 1H and 19F NMR spectra (400 MHz, CD3CN) of 1 (A) in the absence and in the presence of (B) 0.4, (C) 0.8, and (D) 1.2 equivalents of tetra-n-butylammonium fluoride. | ||
In order to verify the nature of the product(s), a series of Pulse Gradient Spin-Echo (PGSE) NMR experiments were carried out. This technique allows the hydrodynamic volume of the species in solution to be measured,73 aiding their identification (see details in the Experimental section). From the plot in Fig. 7, it is evident that the peaks corresponding to Hd and Hf relate to species with different self-diffusion coefficients, indicating that they do not belong to the same molecular system. In particular, Hd relates to a species with a hydrodynamic volume (VH) of 481 Å3 (entry 2, Table 1) and Hf to a different species with a VH of 159 Å3 (entry 3, Table 1). Therefore, we can reasonably conclude that, since the peaks Hf and Fg show comparable VH values, they belong to the same molecular system. A hydrodynamic volume around 150 Å3 is perfectly compatible with the FSi(Pri)3 species and also the chemical shift of fluorine is compatible with a FSiR3 moiety.74 On the other hand, a volume of 481 Å3 is compatible with the phenolate 4b.
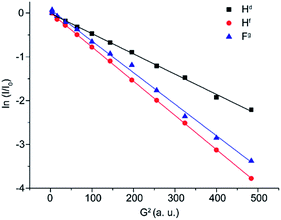 | ||
| Fig. 7 Plot of ln(I/I0) versus G2 for a solution of 1 + 1.2 equivalent of tetra-n-butylammonium fluoride in CD3CN. | ||
| Entry | Solution | Dt | rH | VH |
|---|---|---|---|---|
| 1 | 1 | 12.4 | 5.11 | 559 |
| 2 | 1 + 1.2 eq. F− (Hd) | 13.3 | 4.86 | 481 |
| 3 | 1 + 1.2 eq. F− (Hf) | 22.5 | 3.36 | 159 |
| 4 | 1 + 1.2 eq. F− (Fg) | 23.5 | 3.27 | 146 |
| 5 | 1 + 1.3 eq. CN− (Hd) | 13.6 | 4.80 | 463 |
| 6 | 1 + 1.3 eq. CN− (Hf) | 21.0 | 3.52 | 183 |
Similar results can be obtained after the addition of TBACN to a solution of 1 (see Fig. S30†). In this case Hd shows a VH of 463 Å3 and Hf of 183 Å3 (entries 5 and 6, Table 1). These values are similar to those obtained with TBAF, within the experimental error, confirming the same fragmentation in the two cases.
In addition, ESI mass spectra were obtained for 1 in the presence of F− and CN− (see Fig. S31†), showing m/z peaks of [M]− at 398.8764, after the addition of F−, and [M]− at 398.8780, after the addition of CN−, corresponding to that of 4b. Thus, the characterization by both NMR and MS spectrometric techniques demonstrated the Si–O bond cleavage in the chemodosimeter by F− and CN− with the formation of 4b.
Scheme 2 describes the chemodosimeter approach based on compounds 1–3. The nucleophilic attack of F− or CN− on the silicon center, through an SN2@Si mechanism,75–77 releases the colored species 4b–6b as leaving groups.
Kinetic measurements
The reaction of compounds 1–3 with the anionic species occurs quantitatively in acetonitrile at 25.0 °C. Rate constants for the reactions were determined by following the appearance of the corresponding phenolates 4b, 5b, and 6b at 516, 550, and 614 nm, respectively, and the reactions studied are strictly second order. Kinetic runs were performed under first-order conditions with at least a 10-fold excess of the anionic nucleophile. The observed pseudo-first-rate constant (kobs) values obtained were plotted as a function of c (anion), being linear with zero intercepts, providing the second-order rate constants (k2). The k2 values were reproducible to within ±2%.Fig. 8 shows plots of the kobs values for the reaction of compounds 1–3 with F− in acetonitrile at 25.0 °C, which were used to provide the corresponding k2 values. Table 2 shows the k2 values obtained for the reactions involving compounds 1–3 and F−. Data show that the k2 values decrease in the order: 1 > 2 > 3. This order suggests that the substituents at the 2, 6 position in the compounds change the reactivity of the compounds due to a change in the nature of the phenolate leaving group. Thus, the negative inductive effect of bromo substituents in compound 1 makes the corresponding phenolate a better leaving group than that verified for compound 2. On the other hand, the positive inductive effect of the methyl groups in compound 3 makes its phenolate a poorer leaving group than those of compounds 1 and 2. These data are corroborated by comparison with the pKa values of the phenols 4a–6a in water and their corresponding estimated pKa values in acetonitrile (Table 3).63 Data show that the pKa values increase in the order: 4a < 5a < 6a, which is intrinsically related to the ability of the conjugated bases to act as leaving groups.
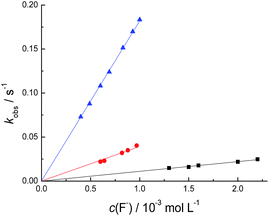 | ||
Fig. 8 Influence of c(F−) on the kobs value for the reaction of 1 ( ), 2 ( ), 2 ( ), and 3 ( ), and 3 ( ) with F− in acetonitrile at 25.0 °C. ) with F− in acetonitrile at 25.0 °C. | ||
| Compound | 1 | 2 | 3 |
| k2 (L mol−1 s−1) | 182 | 39.3 | 11.0 |
| r2 | 0.9999 | 0.9970 | 0.9996 |
Since compound 1 was the most reactive of the chemodosimeters investigated, its reaction with CN−, H2PO4− and AcO− was studied in acetonitrile at 25.0 °C to provide the corresponding k2 values (Fig. 9). Table 4 shows that the k2 values for the reaction of 1 with the anions follow the decreasing order of nucleophilicity in acetonitrile: F− > CN− > AcO− > H2PO4−, which reflects the nucleophilic potential of these species in a non-hydrogen-bond donor solvent, as is the case of acetonitrile.
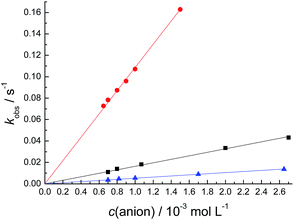 | ||
Fig. 9 Influence of the concentration of CN− ( ), AcO− ( ), AcO− ( ), and H2PO4− ( ), and H2PO4− ( ) on the kobs values of 1 with the anions in acetonitrile at 25.0 °C. ) on the kobs values of 1 with the anions in acetonitrile at 25.0 °C. | ||
| Anion | F− | CN− | AcO− | H2PO4− |
| k2 (L mol−1 s−1) | 182 | 109 | 16.3 | 5.23 |
| r2 | 0.9999 | 0.9997 | 0.9989 | 0.9992 |
The addition of small amounts of water leads to a decrease in the kobs values of 1 with the anions. Fig. 10 shows plots of the kobs values as a function of the CN− and F− concentrations for compound 1 in acetonitrile with different amounts of water, while Table 5 shows the corresponding k2 values obtained. The rate constants decreased with the addition of water, which is consistent with other data published in the literature.51,54 This is due to the fact that F− becomes strongly solvated by water molecules, which makes the hydrated species less able to act as a nucleophile. However, CN− interacts more weakly with water molecules and therefore acts more efficiently as a nucleophile in these experimental conditions, reacting faster with the silicon center of 1.
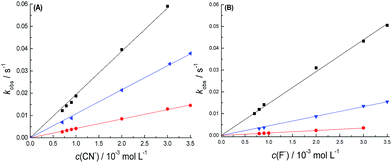 | ||
Fig. 10 Influence of the concentration of (A) CN− and (B) F− on the kobs values of 1 in acetonitrile at 25.0 °C in the presence of 1.0% ( ), 2.0% ( ), 2.0% ( ), and 4.0% ( ), and 4.0% ( ) of water. ) of water. | ||
| 1.0% water | 2.0% water | 4.0% water | ||||
|---|---|---|---|---|---|---|
| Anion | F− | CN− | F− | CN− | F− | CN− |
| k2 (L mol−1 s−1) | 14.6 | 19.4 | 4.21 | 10.8 | 1.13 | 4.41 |
| r2 | 0.9990 | 0.9993 | 0.9995 | 0.9999 | 0.9995 | 0.9992 |
Conclusions
Silylated imines (1–3) and their corresponding phenols (4a–6a) were successfully synthesized and characterized. Compounds 1–3 were applied in a strategy based on a chemodosimeter approach for the selective detection of F− or CN− in pure acetonitrile or acetonitrile–water mixtures. Experimental studies verified the nucleophilic attack of F− or CN− on the silicon center of the compounds as well the species generated by oxygen–silicon bond cleavage, these studies being monitored using UV-vis, HRMS, and 1H NMR techniques. PGSE NMR experiments were utilized in the studies, by analyzing the hydrodynamic volumes of the products generated in solution. The data obtained corroborated the mechanism postulated for the reaction, through an SN2@Si mechanism, with the nucleophilic attack of F− or CN− on the silicon center.Kinetics studies showed that the silylated imines react faster with F− in pure acetonitrile in relation to other anions, due to their greater nucleophilic potential. In addition, compound 1 exhibited higher k2 values in relation to the other compounds. This is due to the fact that the negative inductive effect of bromo substituents present in 1 improves the nature of the leaving group. The addition of water to the medium caused a decrease in the k2 values of 1 with F− and CN− due to the fact that water solvates the anions, hindering their action as nucleophiles. However, the interaction of CN− with the water molecules is weaker than that of F−, leading to the reaction with CN− being faster than that with F− in aqueous medium.
The results reported herein provide a useful approach to the design of new molecules for the development of anionic chemodosimeters that can act in different ways and with selectivity.
Experimental section
Reagents
Acetonitrile (HPLC grade, Sigma-Aldrich) was purified according to a previously described procedure and then stored.78 The deionized water used in the measurements was boiled and bubbled with nitrogen and kept in a nitrogen atmosphere to avoid the presence of carbon dioxide. Acetone, acetonitrile, and absolute ethanol were purchased from Vetec and dried and stored over 4 Å molecular sieves in sealed bottles. All anions (HSO4−, H2PO4−, NO3−, CN−, AcO−, F−, Cl−, Br−, and I−) were used as tetra-n-butylammonium salts with purity greater than 94–99%. The anions were purchased from Fluka (Cl−, >98%; NO3−, >97%; H2PO4−, >97%), Vetec (Br−, >99%; I−, >99%; HSO4−, >99%) and Sigma-Aldrich (F−, >97%; AcO−, >97%; CN−, >94%) and were dried over P4O10 under vacuum before use.Instrumentation
UV-vis measurements were performed with an HP 8452A spectrophotometer equipped with a thermostated bath at 25.0 °C, using a 1 cm quartz square cuvette. The maximum absorption on the UV-vis spectra (λmax) was calculated from the first derivative of the absorption spectrum. Melting points were obtained on a Kofler hot stage and were uncorrected. The nuclear magnetic resonance (NMR) spectra were obtained using a Bruker Avance 200, Avance 400 or Varian AS-400 spectrometers. The 1H NMR data are reported as chemical shifts (δ in ppm), with the solvent resonance as the internal standard. Data are reported as follows: chemical shift, multiplicity (s = singlet, d = doublet, and m = multiplet), coupling constants (Hz) and integration. The 13C NMR data are reported as chemical shifts (δ in ppm). Infrared (IR) spectra were recorded on a Shimadzu spectrophotometer (model Prestige-21), with KBr pellets. High-resolution mass spectra (HRMS) analysis was carried out using an electro-spray ionization (ESI) quadrupole time-of-flight (QTOF) mass spectrometer. The instrument was calibrated using an internal calibration standard (low concentration tuning mix) supplied by Agilent Technologies.Synthesis of the compounds and characterization
The 4-aminophenols (8, 10, and 12) and their corresponding silylated derivatives (7, 9, and 11) were prepared as described previously.35,62 Compounds 1 and 4a are the same as those described in a recent publication.62 Compound 5a was obtained according to a procedure described in the literature.63General procedure for the synthesis of the imines (2, 3, and 6a)
4-Nitrobenzaldehyde (0.50 g; 3.31 mmol) and the respective amine (3.31 mmol) were dissolved in dry ethanol (5 mL) in a round-bottom flask containing acetic acid (one drop). The reaction mixture was then stirred for 3 h at room temperature. The reaction was monitored by thin layer chromatography (TLC) eluting with n-hexane![[thin space (1/6-em)]](https://www.rsc.org/images/entities/char_2009.gif) :
:![[thin space (1/6-em)]](https://www.rsc.org/images/entities/char_2009.gif) ethyl acetate (3
ethyl acetate (3![[thin space (1/6-em)]](https://www.rsc.org/images/entities/char_2009.gif) :
:![[thin space (1/6-em)]](https://www.rsc.org/images/entities/char_2009.gif) 1; v/v). The precipitate in the reaction medium was filtered off under vacuum, washed with iced ethanol and recrystallized from ethanol.
1; v/v). The precipitate in the reaction medium was filtered off under vacuum, washed with iced ethanol and recrystallized from ethanol.
![[small nu, Greek, macron]](https://www.rsc.org/images/entities/i_char_e0ce.gif) max/cm−1): 2941, 2864 (C–H), 1600 (C
max/cm−1): 2941, 2864 (C–H), 1600 (C![[double bond, length as m-dash]](https://www.rsc.org/images/entities/char_e001.gif) N), 1636, 1501 (C
N), 1636, 1501 (C![[double bond, length as m-dash]](https://www.rsc.org/images/entities/char_e001.gif) C), 1522, 1341 (N
C), 1522, 1341 (N![[double bond, length as m-dash]](https://www.rsc.org/images/entities/char_e001.gif) O), 1260, 909 (Si(CH3)n); 1H NMR (400 MHz, CDCl3) δ/ppm: 8.56 (1H, s), 8.30 (2H, d, J = 8.6 Hz), 8.04 (2H, d, J = 8.6 Hz), 7.23 (2H, d, J = 9.0 Hz), 6.92 (2H, d, J = 9.0 Hz), 1.26 (3H, m), 1.11 (18H, d, J = 7.4 Hz); 13C NMR (100 MHz, CDCl3) δ/ppm: 154.76, 148.92, 143.77, 141.94, 129.03, 123.96, 122.49, 120.54, 104.97, 17.88, 12.63; HRMS (ESI, TOF): m/z calcd for C22H31N2O3Si [M + H]+ 399.2098, found 399.2092.
O), 1260, 909 (Si(CH3)n); 1H NMR (400 MHz, CDCl3) δ/ppm: 8.56 (1H, s), 8.30 (2H, d, J = 8.6 Hz), 8.04 (2H, d, J = 8.6 Hz), 7.23 (2H, d, J = 9.0 Hz), 6.92 (2H, d, J = 9.0 Hz), 1.26 (3H, m), 1.11 (18H, d, J = 7.4 Hz); 13C NMR (100 MHz, CDCl3) δ/ppm: 154.76, 148.92, 143.77, 141.94, 129.03, 123.96, 122.49, 120.54, 104.97, 17.88, 12.63; HRMS (ESI, TOF): m/z calcd for C22H31N2O3Si [M + H]+ 399.2098, found 399.2092.![[small nu, Greek, macron]](https://www.rsc.org/images/entities/i_char_e0ce.gif) max/cm−1): 2923, 2866 (C–H), 1599 (C
max/cm−1): 2923, 2866 (C–H), 1599 (C![[double bond, length as m-dash]](https://www.rsc.org/images/entities/char_e001.gif) N), 1634, 1479 (C
N), 1634, 1479 (C![[double bond, length as m-dash]](https://www.rsc.org/images/entities/char_e001.gif) C), 1522, 1342 (N
C), 1522, 1342 (N![[double bond, length as m-dash]](https://www.rsc.org/images/entities/char_e001.gif) O), 1246, 883 (Si(CH3)n), 1234 (C–O); 1H NMR (400 MHz, CDCl3) δ/ppm: 8.56 (1H, s), 8.30 (2H, d, J = 8.6 Hz), 8.03 (2H, d, J = 8.6 Hz), 6.98 (2H, s), 2.29 (6H, s), 1.31 (3H, m), 1.12 (18H, d, J = 7.4 Hz); 13C NMR (100 MHz, CDCl3) δ/ppm: 154.47, 153.40, 148.84, 143.31, 142.09, 128.99, 128.93, 123.95, 121.71, 104.97, 17.98, 14.22; HRMS (ESI, TOF): m/z calcd for C24H35N2O3Si [M + H]+ 427.2411, found 427.2412.
O), 1246, 883 (Si(CH3)n), 1234 (C–O); 1H NMR (400 MHz, CDCl3) δ/ppm: 8.56 (1H, s), 8.30 (2H, d, J = 8.6 Hz), 8.03 (2H, d, J = 8.6 Hz), 6.98 (2H, s), 2.29 (6H, s), 1.31 (3H, m), 1.12 (18H, d, J = 7.4 Hz); 13C NMR (100 MHz, CDCl3) δ/ppm: 154.47, 153.40, 148.84, 143.31, 142.09, 128.99, 128.93, 123.95, 121.71, 104.97, 17.98, 14.22; HRMS (ESI, TOF): m/z calcd for C24H35N2O3Si [M + H]+ 427.2411, found 427.2412.![[small nu, Greek, macron]](https://www.rsc.org/images/entities/i_char_e0ce.gif) max/cm−1): 3192 (OH), 2951, 2921 (C–H), 1597 (C
max/cm−1): 3192 (OH), 2951, 2921 (C–H), 1597 (C![[double bond, length as m-dash]](https://www.rsc.org/images/entities/char_e001.gif) N), 1656, 1481 (C
N), 1656, 1481 (C![[double bond, length as m-dash]](https://www.rsc.org/images/entities/char_e001.gif) C), 1515, 1338 (N
C), 1515, 1338 (N![[double bond, length as m-dash]](https://www.rsc.org/images/entities/char_e001.gif) O), 1228 (C–O); 1H NMR (400 MHz, DMSO-d6) δ/ppm: 8.78 (1H, s), 8.51 (1H, s), 8.33 (2H, d, J = 8.6 Hz), 8.12 (2H, d, J = 8.6 Hz), 7.06 (2H, s), 2.19 (6H, s). 13C NMR (100 MHz, DMSO-d6) δ/ppm: 154.49, 153.16, 148.27, 142.23, 141.53, 128.99, 124.93, 123.97, 121.75, 16.72; HRMS (ESI, TOF): m/z calcd for C15H15N2O3 [M + H]+ 271.1077, found 271.1073.
O), 1228 (C–O); 1H NMR (400 MHz, DMSO-d6) δ/ppm: 8.78 (1H, s), 8.51 (1H, s), 8.33 (2H, d, J = 8.6 Hz), 8.12 (2H, d, J = 8.6 Hz), 7.06 (2H, s), 2.19 (6H, s). 13C NMR (100 MHz, DMSO-d6) δ/ppm: 154.49, 153.16, 148.27, 142.23, 141.53, 128.99, 124.93, 123.97, 121.75, 16.72; HRMS (ESI, TOF): m/z calcd for C15H15N2O3 [M + H]+ 271.1077, found 271.1073.UV-vis study of compounds 1–3 with the anions
A stock solution of 1–3 was prepared in anhydrous acetone in a concentration of 1.2 × 10⁻² mol L−1. An aliquot of the solution, sufficient to give a concentration of 4.0 × 10⁻⁵ mol L−1 for 1 and 3, and 5.0 × 10⁻⁵ mol L−1 for 2, was collected with a microsyringe and placed in a volumetric flask. After evaporation of the solvent the solid was dissolved in dry acetonitrile. These solutions were then used to prepare the solutions of each anion in concentrations of 6.0 × 10⁻⁴ mol L−1 for 1, 1.0 × 10⁻³ mol L−1 for 2, and 7.0 × 10⁻⁴ mol L−1 for 3, in 5 mL volumetric flasks. Subsequently, these solutions were transferred to quartz cuvettes hermetically sealed with a rubber septum and UV-vis spectra were recorded. Similar experiments were carried out with acetonitrile–water mixtures to evaluate the influence of the medium on the performance of 1. The maximum of the UV-vis spectra (λmax) were calculated from the first derivative of the absorption spectrum.NMR titrations
1H NMR titrations were carried out in CD3CN solutions at concentrations of 2.70 × 10⁻³, 2.51 × 10⁻², 2.34 × 10⁻², 2.50 × 10⁻², 4.13 × 10⁻², and 3.70 × 10⁻² mol L−1 for 1, 2, 3, 4a, 5a, and 6a, respectively. Aliquots of 0.5 mol L−1 F− and CN− (as tetra-n-butylammonium salts) stock solutions were added to the NMR tubes containing the compounds and the 1H NMR spectra were obtained after 3 min at 22.0 °C.PGSE NMR experiments
1H and 19F PGSE NMR measurements were performed using the double stimulated echo sequence with a longitudinal eddy current79 at 293 K without spinning. The dependence of the resonance intensity (I) on a constant waiting time and on a varied gradient strength G is described by the following equation:where I is the intensity of the observed spin echo, I0 the intensity of the spin echo in the absence of a gradient, Dt the self-diffusion coefficient, Δ the delay between the midpoints of the gradients, δ the length of the gradient pulse, and γ the magnetogyric ratio. The shape of the gradients was rectangular, their length d was 4–5 ms, and their strength G was varied during the experiments. The semi-logarithmic plots of ln(I/I0) versus G2 were fitted using a standard linear regression algorithm, and a correlation factor better than 0.99 was always obtained. Different G values and numbers of transients were used for different samples.
The self-diffusion coefficient Dt, which is directly proportional to the slope m of the regression line obtained by plotting ln(I/I0) versus G2 (Fig. 7), was estimated by determining the proportionality constant for a sample of HDO (5%) in D2O (known diffusion coefficients in the range 274–318 K)80 under exactly the same conditions as the sample of interest. TMS was used as the internal standard. The Dt data were treated as described in the literature in order to derive the hydrodynamic dimensions.73 Error propagation analysis yielded a standard deviation of approximately 3–4% in the hydrodynamic radius.
Kinetics of the reaction of 1–3 with anions in acetonitrile and acetonitrile–water mixtures
A stock solution of 1–3 was prepared as previously described. All reactions were initiated by mixing an aliquot of these solutions in a hermetically sealed quartz cuvette containing 1.5 mL of dry acetonitrile. The final concentrations of 1–3 in all kinetic experiments were the same as those shown previously to UV-vis study. After the thermal equilibrium at 25.0 °C was reached, aliquots of a stock solution of 3.0 × 10⁻² mol L−1 of the anions in dry acetonitrile and acetonitrile–water mixtures were added to the cuvette and the kinetics data were collected. The reaction was monitored through the change in absorbance (A) at 516, 550, and 614 nm for 1, 2, and 3, respectively, as a function of the reaction time t. Experiments were also performed for 1 in acetonitrile containing water in proportions (v/v) of 1.0%, 2.0%, and 4.0% and the absorbance values were collected at 498, 490, and 484 nm, respectively. The kobs values were obtained through nonlinear least-squares regression curve-fitting using the program ORIGIN 6.1.Acknowledgements
The authors are grateful to the Brazilian governmental agencies Conselho Nacional de Desenvolvimento Científico e Tecnológico (CNPq), Fundação de Amparo à Pesquisa e Inovação do Estado de Santa Catarina (FAPESC), and Coordenação de Aperfeiçoamento de Pessoal de Nível Superior (CAPES) for their financial support, as well as to the Laboratório Central de Biologia Molecular (CEBIME/UFSC) and UFSC.Notes and references
- G. J. Park, G. R. You, Y. W. Choi and C. Kim, Sens. Actuators, B, 2016, 229, 257–271 CrossRef CAS.
- A. Ghosh, D. A. Jose and R. Kaushik, Sens. Actuators, B, 2016, 229, 545–560 CrossRef CAS.
- X. Zheng, W. Zhu, D. Liu, H. Ai, Y. Huang and Z. Lu, ACS Appl. Mater. Interfaces, 2014, 6, 7996–8000 CAS.
- Y. Yang, Q. Zhao, W. Feng and F. Li, Chem. Rev., 2013, 113, 192–270 CrossRef CAS PubMed.
- M. Wenzel, J. R. Hiscock and P. A. Gale, Chem. Soc. Rev., 2012, 41, 480–520 RSC.
- F. Wang, L. Wang, X. Chen and J. Yoon, Chem. Soc. Rev., 2014, 43, 4312–4324 RSC.
- M. E. Moragues, R. Martínez-Máñez and F. Sancenón, Chem. Soc. Rev., 2011, 40, 2593–2643 RSC.
- Y. Zhou, J. F. Zhang and J. Yoon, Chem. Rev., 2014, 114, 5511–5571 CrossRef CAS PubMed.
- R. Martínez-Máñez and F. Sancenón, Chem. Rev., 2003, 103, 4419–4476 CrossRef PubMed.
- X. Zhou, S. Lee, Z. Xu and J. Yoon, Chem. Rev., 2015, 115, 7944–8000 CrossRef CAS PubMed.
- F. Cheng, X. Wu, M. Liu, Y. Lon, G. Chen and R. Zeng, Sens. Actuators, B, 2016, 228, 673–678 CrossRef CAS.
- V. S. Lin, W. Chen, M. Xian and C. J. Chang, Chem. Soc. Rev., 2015, 44, 4596–4618 RSC.
- L. Gai, J. Mack, H. Lu, T. Nyokong, Z. Li, N. Kobayashi and Z. Shen, Coord. Chem. Rev., 2015, 285, 24–51 CrossRef CAS.
- J. Hamel, Crit. Care Nurse, 2011, 31, 72–82 CrossRef PubMed.
- I. F. Bolarinwa, C. Orfila and M. R. A. Morgan, Food Chem., 2014, 152, 133–139 CrossRef CAS PubMed.
- A. E. Burns, J. H. Bradbury, T. R. Cavagnaro and R. M. Gleadow, J. Food Compos. Anal., 2012, 25, 79–82 CrossRef CAS.
- L. D. Tivana, J. Da Cruz Francisco, F. Zelder, B. Bergenståhl and P. Dejmek, Food Chem., 2014, 158, 20–27 CrossRef CAS PubMed.
- S. Pentzold, M. Zagrobelny, N. Bjarnholt, J. Kroymann, H. Vogel, C. E. Olsen, B. L. Møller and S. Bak, Insect Biochem. Mol. Biol., 2015, 66, 119–128 CrossRef CAS PubMed.
- J. A. Cury, B. H. de Oliveira, A. P. P. dos Santos and L. M. A. Tenuta, Dent. Mater., 2016, 32, 323–333 CrossRef CAS PubMed.
- D. L. Ozsvath, Rev. Environ. Sci. Bio/Technol., 2009, 8, 59–79 CrossRef CAS.
- W. Wu, Q. Xiao, P. Zhang, M. Ye, Y. Wan and H. Liang, Food Chem., 2015, 172, 681–684 CrossRef CAS PubMed.
- E. P. Randviir and C. E. Banks, Trends Anal. Chem., 2015, 64, 75–85 CrossRef CAS.
- S. Oszwałdowski, K. Połeć and M. Jarosz, Talanta, 2000, 51, 817–824 CrossRef.
- S.-M. Kwon and H.-S. Shin, J. Chromatogr. A, 2015, 1407, 216–221 CrossRef CAS PubMed.
- E. V. Anslyn, J. Org. Chem., 2007, 72, 687–699 CrossRef CAS PubMed.
- J. Wang, H.-B. Liu, Z. Tong and C.-S. Ha, Coord. Chem. Rev., 2015, 303, 139–184 CrossRef CAS.
- L. You, D. Zha and E. V. Anslyn, Chem. Rev., 2015, 115, 7840–7892 CrossRef CAS PubMed.
- K. Kaur, R. Saini, A. Kumar, V. Luxami, N. Kaur, P. Singh and S. Kumar, Coord. Chem. Rev., 2012, 256, 1992–2028 CrossRef CAS.
- P. B. Pati, Sens. Actuators, B, 2016, 222, 374–390 CrossRef CAS.
- L. M. Zimmermann-Dimer and V. G. Machado, Quim. Nova, 2008, 31, 2134–2146 CrossRef CAS.
- J. Li, W. Wei, X. Qi, G. Zuo, J. Fang and W. Dong, Sens. Actuators, B, 2016, 228, 330–334 CrossRef CAS.
- A. S. Gupta, A. Garg, K. Paul and V. Luxami, J. Lumin., 2016, 173, 165–170 CrossRef CAS.
- C. Arivazhagan, R. Borthakur, R. Jagan and S. Ghosh, Dalton Trans., 2016, 45, 5014–5020 RSC.
- J. L. O. Buske, C. R. Nicoleti, A. A. Cavallaro and V. G. Machado, J. Braz. Chem. Soc., 2015, 26, 2507–2519 CAS.
- J. P. T. A. Guerra, A. Lindner, C. R. Nicoleti, V. G. Marini, M. Silva and V. G. Machado, Tetrahedron Lett., 2015, 56, 4733–4736 CrossRef CAS.
- L. G. Nandi, C. R. Nicoleti, I. C. Bellettini and V. G. Machado, Anal. Chem., 2014, 86, 4653–4656 CrossRef CAS PubMed.
- P. A. Gale and T. Gunnlaugsson, Chem. Soc. Rev., 2010, 39, 3595–3596 RSC.
- M. Kaur, M. J. Cho and D. H. Choi, Dyes Pigm., 2014, 103, 154–160 CrossRef CAS.
- X.-Y. Wang, F.-J. Guan, B. Li, H. Zhang, H.-W. Wu, K. Ji and C.-X. Liu, Chin. Chem. Lett., 2016, 27, 211–214 CrossRef CAS.
- J. Cao, C. Zhao and W. Zhu, Tetrahedron Lett., 2012, 53, 2107–2110 CrossRef CAS.
- M. R. Rao, S. M. Mobin and M. Ravikanth, Tetrahedron, 2010, 66, 1728–1734 CrossRef CAS.
- G. Li, W.-T. Gong, J.-W. Ye, Y. Lin and G.-L. Ning, Tetrahedron Lett., 2011, 52, 1313–1316 CrossRef CAS.
- S. Goswami, A. K. Das, A. Manna, A. K. Maity, H.-K. Fun, C. K. Quah and P. Saha, Tetrahedron Lett., 2014, 55, 2633–2638 CrossRef CAS.
- L. Fu, F.-F. Tian, L. Lai, Y. Liu, P. D. Harvey and F.-L. Jiang, Sens. Actuators, B, 2014, 193, 701–707 CrossRef CAS.
- V. Luxami, A. Kumar, M. S. Hundal and S. Kumar, Sens. Actuators, B, 2010, 145, 1–6 CrossRef CAS.
- Z. Luo, B. Yang, C. Zhong, F. Tang, M. Yuan, Y. Xue, G. Yao, J. Zhang and Y. Zhang, Dyes Pigm., 2013, 97, 52–57 CrossRef CAS.
- Y. Li, X. Zhang, B. Zhu, J. Yan and W. Xu, Anal. Sci., 2010, 26, 1077–1080 CrossRef CAS PubMed.
- X. Cao, W. Lin, Q. Yu and J. Wang, Org. Lett., 2011, 13, 6098–6101 CrossRef CAS PubMed.
- Y. Bao, B. Liu, H. Wang, J. Tian and R. Bai, Chem. Commun., 2011, 47, 3957–3959 RSC.
- X. Li, B. Hu, J. Li, P. Lu and Y. Wang, Sens. Actuators, B, 2014, 203, 635–640 CrossRef CAS.
- A. Agostini, M. Milani, R. Martínez-Máñez, M. Licchelli, J. Soto and F. Sancenón, Chem.–Asian J., 2012, 7, 2040–2044 CrossRef CAS PubMed.
- X.-F. Yang, S.-J. Ye, Q. Bai and X.-Q. Wang, J. Fluoresc., 2007, 17, 81–87 CrossRef CAS PubMed.
- S. Y. Kim and J.-I. Hong, Org. Lett., 2007, 9, 3109–3112 CrossRef CAS PubMed.
- P. Sokkalingam and C.-H. Lee, J. Org. Chem., 2011, 76, 3820–3828 CrossRef CAS PubMed.
- O. A. Bozdemir, F. Sozmen, O. Buyukcakir, R. Guliyev, Y. Cakmak and E. U. Akkaya, Org. Lett., 2010, 12, 1400–1403 CrossRef CAS PubMed.
- L. K. Calderón-Ortiz, E. Täuscher, E. L. Bastos, H. Görls, D. Weiß and R. Beckert, Eur. J. Org. Chem., 2012, 2535–2541 CrossRef.
- L. Li, Y. Ji and X. Tang, Anal. Chem., 2014, 86, 10006–10009 CrossRef CAS PubMed.
- S. Y. Kim, J. Park, M. Koh, S. B. Park and J.-I. Hong, Chem. Commun., 2009, 4735–4737 RSC.
- S. Elsayed, A. Agostini, L. E. Santos-Figueroa, R. Martínez-Máñez and F. Sancenón, ChemistryOpen, 2013, 2, 58–62 CrossRef CAS PubMed.
- R. Hu, J. Feng, D. Hu, S. Wang, S. Li, Y. Li and G. Yang, Angew. Chem., Int. Ed., 2010, 49, 4915–4918 CrossRef CAS PubMed.
- R. Chavali, N. S. K. Gunda, S. Naicker and S. K. Mitra, Anal. Chem. Res., 2015, 6, 26–31 CrossRef CAS.
- C. R. Nicoleti, L. G. Nandi and V. G. Machado, Anal. Chem., 2015, 87, 362–366 CrossRef CAS PubMed.
- C. R. Nicoleti, V. G. Marini, L. M. Zimmermann and V. G. Machado, J. Braz. Chem. Soc., 2012, 23, 1488–1500 CrossRef CAS.
- L. G. Nandi, F. Facin, V. G. Marini, L. M. Zimmermann, L. A. Giusti, R. da Silva, G. F. Caramori and V. G. Machado, J. Org. Chem., 2012, 77, 10668–10679 CrossRef CAS PubMed.
- C. Reichardt, Chem. Rev., 1994, 94, 2319–2358 CrossRef CAS.
- L. M. Zimmermann-Dimer and V. G. Machado, Dyes Pigm., 2009, 82, 187–195 CrossRef CAS.
- V. G. Marini, L. M. Zimmermann and V. G. Machado, Spectrochim. Acta, Part A, 2010, 75, 799–806 CrossRef PubMed.
- V. G. Marini, E. Torri, L. M. Zimmermann and V. G. Machado, ARKIVOC, 2010, 146–162 CAS.
- W.-J. Qu, T.-B. Wei, Q. Lin, W.-T. Li, J.-X. Su, G.-Y. Liang and Y.-M. Zhang, Sens. Actuators, B, 2016, 232, 115–124 CrossRef CAS.
- S.-T. Wang, J.-L. Chir, Y. Jhong and A.-T. Wu, J. Lumin., 2015, 167, 413–417 CrossRef CAS.
- Y. Marcus, J. Chem. Soc., Faraday Trans., 1991, 87, 2995–2999 RSC.
- C.-G. Zhan and D. A. Dixon, J. Phys. Chem. A, 2004, 108, 2020–2029 CrossRef CAS.
- A. Macchioni, G. Ciancaleoni, C. Zuccaccia and D. Zuccaccia, Chem. Soc. Rev., 2008, 37, 479–489 RSC.
- H. J. Reich, “Fluorine NMR Data”, to be found under http://www.chem.wisc.edu/areas/reich/handouts/nmr/f-data.htm, accessed August 2016.
- S. C. A. H. Pierrefixe, C. Fonseca Guerra and F. M. Bickelhaupt, Chem.–Eur. J., 2008, 14, 819–828 CrossRef PubMed.
- A. P. Bento and F. M. Bickelhaupt, J. Org. Chem., 2007, 72, 2201–2207 CrossRef CAS PubMed.
- R. J. P. Corriu and B. J. L. Henner, J. Organomet. Chem., 1975, 102, 407–416 CrossRef CAS.
- B. S. Furniss, A. J. Hannaford, P. W. G. Smith and A. R. Tatchell, Vogel's Textbook of Practical Organic Chemistry, Longman, London, 5th edn, 1989 Search PubMed.
- A. Jerschow and N. Müller, J. Magn. Reson., 1997, 125, 372–375 CrossRef CAS.
- R. Mills, J. Phys. Chem., 1973, 77, 685–688 CrossRef CAS.
Footnote |
| † Electronic supplementary information (ESI) available. See DOI: 10.1039/c6ra23156j |
| This journal is © The Royal Society of Chemistry 2016 |

