Unusual ferromagnetic behaviour of embedded non-functionalized Au nanoparticles in Bi/Au bilayer films
Sudakshina Prusty†
a,
Vantari Siva†a,
Neeraj Shukla‡
b,
Biswarup Satpati c,
K. Senapatia and
Pratap K. Sahoo
 *a
*a
aSchool of Physical Sciences, National Institute of Science Education and Research (NISER), HBNI, Jatni, Bhubaneswar, Odisha – 752050, India. E-mail: pratap.sahoo@niser.ac.in
bUGC-DAE CSR, Kalpakkam node, Kokilamedu – 603104, India
cSurface Physics & Materials Science Division, Saha Institute of Nuclear Physics, 1/AF Bidhannagar, Kolkata, India – 700064
First published on 21st October 2016
Abstract
There is a growing consensus through various experimental and theoretical studies that gold can exhibit magnetic properties at low dimensions in contrast to its well-known diamagnetic nature when in bulk form. Although theoretical simulation studies show that bare gold nanoclusters can be intrinsically magnetic, experimental reports to prove this theory are scarcely available since most of the studies are based on functionalized gold nanoparticles. In this article, we report unusual ferromagnetic behaviour that is observed in embedded non-functionalized Au nanoparticles using superconducting quantum interference device (SQUID) magnetometry. These nanoparticles are obtained after irradiating thermally deposited Au/Bi double bilayer films using 1.5 MeV Au ions at different fluences from 5 × 10¹⁴ to 1 × 10¹⁶ ions per cm2. A detailed study of cross-sectional high resolution transmission electron microscopy (X-HRTEM) results for the irradiated sample confirms the presence of embedded Au nanoparticles with an average size of 2.61 nm. The unusual ferromagnetic behaviour is attributed to these embedded Au nanoparticles that were formed after ion irradiation.
1 Introduction
Gold nanoparticles have been subject to very broad and intense research activity in recent years because of their unconventional properties compared to the bulk form. This makes them a promising material for applications in diverse areas such as optics, electronics, catalysis and many more. In the last few years a couple of reports have claimed that gold nanoparticles in different forms1–15 could also be magnetic, a property which is perhaps the least expected since bulk gold is well-known to be diamagnetic. Hori et al.5 were the first group to report a magnetic moment in polymer-coated Au and Pd nanoparticles. Subsequently, many experimental papers have published data confirming the appearance of magnetic polarization on ligand-coated (functionalized) nanoparticles made from gold and other metals that are diamagnetic when in bulk.5–8 Some studies have also observed magnetism in functionalized gold films.9–12 Carmeli et al.13 observed magnetism when organic diamagnetic molecules were self-assembled as a monolayer on gold substrates. While all of the reports deal with functionalized particles or surfaces, there are only a few reports available in the literature which show magnetism in bare gold nanoparticles.2–4 Wu et al.2 showed bare 3.5 nm Au clusters being ferrimagnetic, exhibiting a net moment of 16 bohr magneton per cluster when extrapolated to 0 K. Using neutron diffraction measurements, Li et al.3 have detected ferromagnetism in bare Au nanoparticles that are 4 nm in size. Similarly, Tuboltsev et al.4 demonstrated ferromagnetic behaviour of cluster deposited Au nanocrystals. These results are not only shown through experiments, as a couple of theoretical simulation studies have also reportedly predicted that magnetism indeed exists in very small gold clusters.16–18 Bare gold films deposited on glass have been shown to have a positive magnetization at 5 K though the sample is completely diamagnetic at 300 K.14 Although so many experimental papers report similar observations, the magnetic behaviour has shown great variability, even being contradictory at times, for unclear reasons.Since most of the properties of nanoparticles are due to a large surface to volume ratio, the magnetic moment observed in gold nanoparticles may fluctuate if there is a change in their size, position, orientation or neighbourhood. The magnetism observed so far is mostly from nanoparticles that are free to move, such as functionalized nanoparticles dispersed in liquids or deposited onto a substrate in air. This becomes an issue for applications requiring a permanent and stable magnetic moment. To overcome this problem, embedding the nanoparticles in a matrix would be a good alternative. Since it is not certain that the magnetic behaviour would be preserved in embedded nanoparticles, it is challenging to synthesize such structures with accurate control of the above mentioned features. There are a few reports about the synthesis of embedded gold nanoparticles in thin films of TiO219 and porous graphene20 using chemical routes. However the average sizes of the nanoparticles were 39 nm and 14 nm, respectively, which is too large to expect magnetic behaviour. One of the non-chemical methods which is well established for the synthesis of embedded nanoparticles is the ion beam technique, such as ion irradiation and implantation. It enables the synthesis and tailoring of the properties of the nanoparticles in a much controlled manner by selecting suitable beam parameters such as ion energy, mass, fluence, current density, etc. The embedded nanoparticles are very stable and well isolated from the surrounding environment. There are many reports demonstrating embedded gold nanoparticles either in a substrate or in a thin film by ion irradiation and implantation.21–26 Singh et al.21 have shown that embedded gold nanoparticles are formed after ion irradiation of gold thin films on a glass substrate. The synthesis of nearly monodispersed embedded gold nanoparticles in SiO2 is shown by V. Ramaswamy et al.25 using a multistep ion implantation process. Somehow, the magnetic nature of such embedded particles has not yet been explored. So far, there is only one report by Venta et al.,27 which has demonstrated a large magnetic moment in functionalized gold nanoparticles that are 3–4 nm in size and embedded in a polymer matrix using chemical synthesis. Interestingly, some preliminary studies predict that the functionalization of gold nanoparticles quenches the magnetism, in comparison to bare gold clusters.16 However, there is no literature available so far exploring the magnetic nature of non-functionalized (or bare) embedded gold nanoparticles.
In this report, we present observation of ferromagnetic behaviour of embedded Au nanoparticles formed after the irradiation of thermally deposited Au/Bi double bilayer thin films using 1.5 MeV Au ions. Glancing angle X-ray diffraction (GAXRD) measurements were carried out to check the structural modification after ion irradiation. The ferromagnetic behavior of all the samples is ascertained at different temperatures by employing SQUID magnetometry. The morphological changes in the post irradiated samples were compared with the as-deposited samples using field emission scanning electron microscopy (FESEM). The mechanism of formation of the embedded nanoparticles has been discussed in light of a cross-sectional high resolution transmission electron microscopy (X-HRTEM) study of the irradiated samples, which shows embedded Au nanoparticles of mean sizes less than 3 nm. The ferromagnetism observed in the irradiated samples is attributed to these small Au nanoparticles.
2 Experimental
A set of double bilayer thin films of Bi and Au were deposited on Si by thermal and e-beam evaporation respectively, without breaking the vacuum. The rate of evaporation of Bi and Au was 0.05 nm s−1 and 0.01 nm s−1 respectively. These films were deposited under a vacuum that was below 5 × 10⁻⁷ mbar. The thickness of each film was 30 nm as recorded by a quartz crystal thickness monitor. For better uniformity of the films, the substrate holder was rotated at 14 revolutions per minute (RPM). These as-deposited samples were irradiated with Au2+ ions with an energy of 1.5 MeV at different fluences from 5 × 10¹⁴ to 1 × 10¹⁶ ions per cm2 using a pelletron accelerator. The crystalline nature of the as-deposited and irradiated samples was examined through GAXRD measurements using a Bruker D8 Advance diffractometer. The glancing angle of the X-rays for all of the samples was kept at 0.5°. The magnetic nature of the samples was analysed by employing a Quantum Design SQUID magnetometer. The evolution of the surface morphology of all of the samples was studied using a Carl-Zeiss FESEM. Compositional analysis and elemental mapping were also performed using energy dispersive spectroscopy (EDS) (Oxford Instruments), attached to the FESEM system. A detailed structural analysis was carried out using X-TEM and X-HRTEM employing FEI, Tecnai F30 TEM.3 Results and discussion
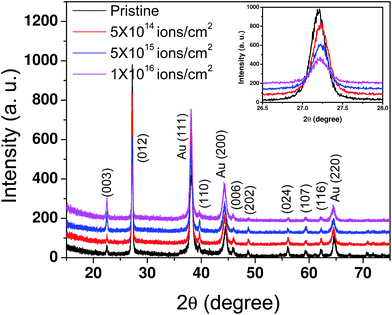
The as-deposited and irradiated samples were characterized using GAXRD as depicted in Fig. 1. The presence of a rhombohedral phase of Bi (with the space group R![[3 with combining macron]](https://www.rsc.org/images/entities/char_0033_0304.gif) m, JCPDS card no. 44-1246) and cubic phase of Au (with the space group Fm
m, JCPDS card no. 44-1246) and cubic phase of Au (with the space group Fm![[3 with combining macron]](https://www.rsc.org/images/entities/char_0033_0304.gif) m, JCPDS card no. 89-3697) was clearly observed and marked in the figure. None of the patterns for the irradiated samples show any new peaks which implies that no new crystalline phase of Au–Bi was formed after ion irradiation. However, the intensity of the most prominent peak of Bi at 27.2° is reduced drastically after irradiation, as shown in the inset to Fig. 1. This indicates that there could be a substantial reduction in the amount of crystalline Bi present in the sample which contributes to the intensity of this peak. The FWHM of all of the peaks showed a marginal increase with increasing fluence. This implies that complete amorphization of the sample was not possible. Usually, highly energetic ion beams, while traversing through materials, loose energy via elastic (nuclear energy loss, Sn) and inelastic (electronic energy loss, Se) collisions. The elastic collision leads to atomic displacement through the interface and inelastic collision causes a rise in the local temperature. More details of the collision process and the relevant equations can be found in ref. 28. Calculation of Sn and Se was done using SRIM (Stopping Range of Ions in Matter),29 which is a standard software package based on Monte-Carlo simulations. The required input parameters are: type of target atom, type of irradiating ion and its energy. Thus, for 1.5 MeV Au2+ ions, the Sn and Se values are 4.64 and 1.68 keV nm−1 in Bi and 9.53 and 2.40 keV nm−1 in Au, respectively. Since for both the elements Sn is large, ballistic transport of the atoms at the interface is expected. On the other hand, even though the value of Se is smaller compared to Sn, it can not be completely neglected. Thus one would expect a combined effect of atomic mixing and local heating in the irradiated samples. However, smaller Se values would yield a heat energy which is not enough for the formation of an alloy phase of Au–Bi. This could be the reason for the absence of any new peaks corresponding to the Au–Bi phase in the GAXRD spectra. Also, at comparatively lower energy irradiation (up to a few MeV), metals with a close-packed structure and non-directional bonding possess strong damage regeneration.30 Hence, irradiation-induced disorder rapidly regenerates and amorphization is not observed in these samples.
m, JCPDS card no. 89-3697) was clearly observed and marked in the figure. None of the patterns for the irradiated samples show any new peaks which implies that no new crystalline phase of Au–Bi was formed after ion irradiation. However, the intensity of the most prominent peak of Bi at 27.2° is reduced drastically after irradiation, as shown in the inset to Fig. 1. This indicates that there could be a substantial reduction in the amount of crystalline Bi present in the sample which contributes to the intensity of this peak. The FWHM of all of the peaks showed a marginal increase with increasing fluence. This implies that complete amorphization of the sample was not possible. Usually, highly energetic ion beams, while traversing through materials, loose energy via elastic (nuclear energy loss, Sn) and inelastic (electronic energy loss, Se) collisions. The elastic collision leads to atomic displacement through the interface and inelastic collision causes a rise in the local temperature. More details of the collision process and the relevant equations can be found in ref. 28. Calculation of Sn and Se was done using SRIM (Stopping Range of Ions in Matter),29 which is a standard software package based on Monte-Carlo simulations. The required input parameters are: type of target atom, type of irradiating ion and its energy. Thus, for 1.5 MeV Au2+ ions, the Sn and Se values are 4.64 and 1.68 keV nm−1 in Bi and 9.53 and 2.40 keV nm−1 in Au, respectively. Since for both the elements Sn is large, ballistic transport of the atoms at the interface is expected. On the other hand, even though the value of Se is smaller compared to Sn, it can not be completely neglected. Thus one would expect a combined effect of atomic mixing and local heating in the irradiated samples. However, smaller Se values would yield a heat energy which is not enough for the formation of an alloy phase of Au–Bi. This could be the reason for the absence of any new peaks corresponding to the Au–Bi phase in the GAXRD spectra. Also, at comparatively lower energy irradiation (up to a few MeV), metals with a close-packed structure and non-directional bonding possess strong damage regeneration.30 Hence, irradiation-induced disorder rapidly regenerates and amorphization is not observed in these samples.
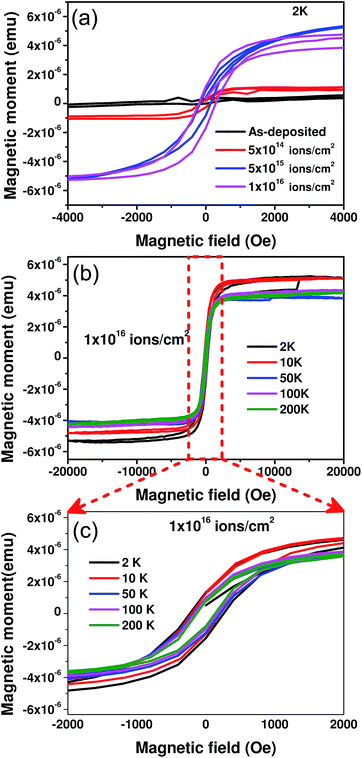
The magnetization (M) of the as-deposited and ion irradiated samples was measured as a function of the applied magnetic field (H) at various temperatures down to 2 K using a SQUID magnetometer. Fig. 2(a) shows the M–H curves for the as-deposited and irradiated samples at 2 K. The as-deposited sample shows diamagnetic behaviour even at low temperatures, which was expected since both Bi and Au are well-known diamagnetic materials in bulk. After irradiation the diamagnetic behaviour disappears and the hysteresis nature of the samples gradually evolves as the fluence is increased. All of the M–H loops for the ion irradiated samples are shown after subtracting any possible diamagnetic contribution from the sample holder and unirradiated portion of the bilayer samples. Since we did not observe any hysteresis behavior from the as-deposited samples, it is evident that ion irradiation certainly plays a significant role in inducing magnetism in the samples. A representative picture showing the systematic study of the complete hysteresis loop in the temperature range of 2–200 K is depicted in Fig. 2(b) for the highest fluence, 1 × 10¹⁶ ions per cm2. Fig. 2(c) shows a blown up view of the relevant region of Fig. 2(b), which is marked by a red rectangle.
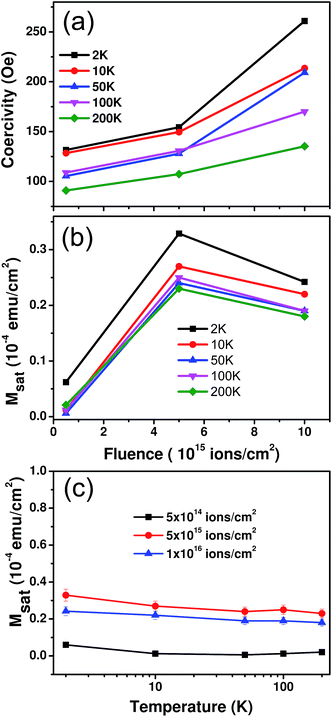
The coercivity and saturation magnetisation values were determined from the M–H curves for each irradiated sample at all of the available temperatures as displayed in Fig. 3. The coercivity values of the samples are found to increase with fluence at all temperatures as shown in Fig. 3(a). The maximum change in coercivity is from 131 Oe to 261 Oe, as seen at the lowest temperature (2 K). In the case of the ion irradiated samples the fluence is quantified by the number of ions bombarded per unit area of the sample. Hence, in Fig. 3(b), we have calculated the saturation magnetisation/area (Msat) of the samples in order to understand the effect of fluence. For all temperatures, Msat increases substantially up to the fluence of 5 × 10¹⁵ ions per cm2 and then tends to decrease slightly. Fig. 3(c) shows marginal changes in Msat with varying temperature indicating a higher Curie temperature. Thus, from Fig. 2 and 3, it is clearly evident that the irradiated samples exhibit characteristic ferromagnetic behaviour unlike the as-deposited sample which is completely diamagnetic in nature. Some of the reported31 reasons behind ferromagnetism in non-magnetic materials include magnetic impurity, oxygen vacancies, secondary phases or metallic nanoparticles. We will examine them one by one. First, there are no magnetic impurities present in any of the samples since GAXRD (and FESEM-EDS analysis shown later) indicates that no other element is present. Furthermore, we also carried out a scanning transmission electron microscopy (STEM)-EDS study for the sample that was irradiated at the highest dose to cross-verify the results. With a 0.1 atomic percent detection limit, this also showed no traces of any magnetic impurities. Hence their contribution to the magnetic behaviour is ruled out. Second, since gold is the top layer of the bilayer films, there is no natural oxide formation on the surface of the as-deposited sample. There are only two oxide species that are possible in the sample i.e., SiO2 or bismuth oxides (both are diamagnetic), which may produce oxygen vacancies after ion irradiation. However, there are no reports of oxygen vacancy induced magnetism in these oxides and hence this is excluded as the cause of the magnetism. The GAXRD observations show no evidence of any new peaks corresponding to any secondary ferromagnetic phases. Finally, the possible contribution of the metallic nanoparticles to the magnetic behaviour was explored. Recently, there have been a couple of experimental and theoretical reports claiming ferromagnetism in gold nanoparticles with a size of about 3 nm,2–4,16 whereas Bi nanoparticles are not known so far to show similar behaviour. We believe that Au nanoparticles are formed in the sample once the Au ions come to a stop after bombardment. This conjecture seems to be a better explanation for the observed dependence of the saturation magnetisation on fluence as shown in Fig. 3(b). Since the number of Au nanoparticles increases with increasing fluence, there will be a tendency for them to agglomerate and form bigger sized particles or clusters. Hori et al.32 have observed that the saturation magnetisation is at a maximum for Au nanocrystals with a size of around 3 nm. For the fluence of 1 × 10¹⁶ ions per cm2, agglomeration in the sample seems to form larger nanoparticles leading to a marginal decrease in the saturation magnetisation value. To confirm the presence of gold nanoparticles in the samples and estimate their size, a detailed microscopic structural analysis was performed.
The surface morphology of all of the samples was studied using FESEM as shown in Fig. 4(a)–(d). The as-deposited sample in Fig. 4(a) shows the formation of grains with distinct boundaries. The grain boundaries become obscure in Fig. 4(b)–(d) for the irradiated samples as the fluence is increased from 5 × 10¹⁴ ions per cm2 to 1 × 10¹⁶ ions per cm2. Also, a molten layer seems to spread all over as the fluence is increased. Bi is known to have a low melting point (271.3 °C) compared to Au (1064.4 °C). Thus, even though Se is less, it is sufficient to drive the Bi layer into a molten state and surround the Au grains gradually. This movement of molten Bi around the Au clusters may lead to the formation of core–shell structures. Using a 10 keV electron beam, EDS studies of all of the samples were carried out to determine the compositional changes after irradiation. The compositional weight percentages of all of the samples are tabulated in Table 1. Initially, the weight percentage of Au increases upto a certain fluence, which can be attributed to the deposition of Au ions in the sample. At the highest fluence, the relative decrease in the weight percentage may be due to the sputtering of atoms from the top Au layer. The weight percentage of Bi also comes down systematically with the ion fluence, which could possibly be due to its evaporation after reaching a molten state. To understand the interaction of Au ions with the samples, a detailed TRIM calculation of the ion range in the films was carried out as displayed in Fig. 5. It shows a bimodal distribution of Au ions in the samples as a function of the depth from the surface. The distribution has a narrow peak at a depth of around 91 nm and a broad peak at 287 nm. This implies that most of the Au ions get implanted in the film itself at a shallow depth and the rest go deeper into the substrate.
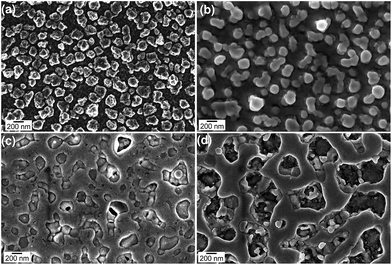 | ||
| Fig. 4 FESEM images showing the surface morphology of (a) as-deposited and post-irradiated samples at fluences of (b) 5 × 10¹⁴, (c) 5 × 10¹⁵ and (d) 1 × 10¹⁶ ions per cm2. | ||
| Element | Pristine | 5 × 10¹⁴ | 5 × 10¹⁵ | 1 × 10¹⁶ |
|---|---|---|---|---|
| Si K | 2.71 | 2.68 | 4.12 | 13.06 |
| Au M | 69.4 | 74.98 | 75.73 | 69.01 |
| Bi M | 27.89 | 22.34 | 20.15 | 17.93 |
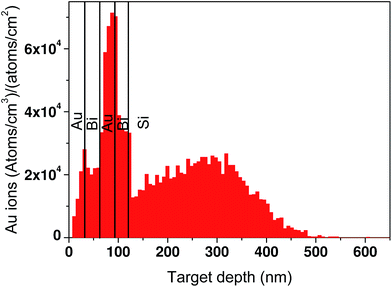 | ||
| Fig. 5 Calculated range distribution of 1.5 MeV gold ions in the Bi/Au double bilayer films, using the TRIM package. | ||
Based on the above observations, a schematic explanation is suggested to understand the interaction of the Au ions with the sample as depicted in Fig. 6. Fig. 6(a) represents the as-deposited sample where inhomogeneous polycrystalline films of Bi and Au are deposited on the Si substrate. Upon irradiation by Au ions of medium fluence, mixing of the layers occurs due to the displacement of atoms and the distinctness of the interfaces fades away as depicted in Fig. 6(b). The mixing process gets even easier as the Bi layers are expected to become molten due to partial heating. The atoms of the molten Bi tend to gradually surround the Au grains making the Au film much more discontinuous. When the ions finally come to a stop, they deposit the rest of their energy and induce the formation of small nanoparticles that are embedded in the film and substrate. At the highest fluence, the discontinuous parts of the Au film segregate to become big nanoclusters surrounded by a Bi layer, much like a core–shell structure. Also, the number of smaller nanoparticles increases as the fluence is increased. Thus one would expect the formation of two types of gold nanostructures in the sample due to the bombarded Au ions after they stop moving further: (1) big size Au nanoclusters surrounded by molten Bi, (2) very small nanoparticles produced due to fragmentation of the rest of the gold films in between these big clusters and a few more formed in the substrate as shown in Fig. 6(c).
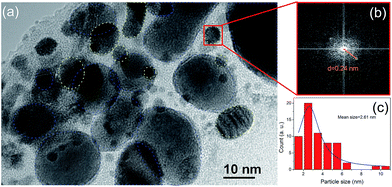
Fig. 7(a) and (b) display comparative X-TEM images of the as-deposited film and the sample irradiated at the highest dose of 1 × 10¹⁶ ions per cm2, respectively. The as-deposited sample (detached from the substrate during the X-TEM sample preparation) shows high roughness and irregularly shaped island-like structures due to the process of dewetting. The irradiated sample exhibits giant nanoclusters with a size of more than 200 nm and a large number of smaller nanoparticles embedded in between and below these clusters. This is in agreement with the TRIM calculation of the ion range showing a bimodal distribution. Ion induced heating leads to agglomeration in the sample which could be the reason for the formation of the giant nanoclusters. The smaller nanoparticles in between the clusters are due to the implanted ions at a depth of 91 nm corresponding to the narrow peak in Fig. 6. Similarly, the ions deposited at a depth of 287 nm result in the formation of nanoparticles that are embedded near to the substrate interface. However, the observed Au cluster sizes are much bigger than the sizes reported to show magnetism. Hence, a closer look at the size of the smaller nanoparticles that are embedded in between the bigger clusters was sought after by employing X-HRTEM, as depicted in Fig. 8. The (111) interplanar spacing (d111) for a particle (marked by the red square) was determined using the fast Fourier transform of the lattice fringe spacing. The value obtained was 0.24 nm which confirms that it is a gold nanoparticle. This calculation was repeated at different points in the figure marked by the yellow dotted lines for cross verification. A similar calculation was also performed for the nanoparticles that were observed in the portions of the figure marked by the blue dotted lines. The lattice spacing value obtained is 0.3 nm corresponding to Bi. Since we are interested in Au nanoparticles only, their size distribution was estimated from several images acquired from different positions of the same sample. Though very small nanoparticles that were observed in the TEM images could not be resolved for identification, these are expected to be Au nanoparticles. In fact, upon heat treatment, Bi is shown to form larger nanoparticles compared to other metals.33 Since Bi would be in a molten state due to irradiation-induced heating, there will be a tendency to form larger nanoparticles as compared with Au. Thus, the mean size of the Au nanoparticles that was obtained from the size distribution was determined to be 2.61 ± 0.18 nm, which is of the same order as the values reported for the Au nanoparticles that depict magnetism. This confirms that the observed ferromagnetism in our samples is indeed due to the formation of Au nanoparticles after ion irradiation.
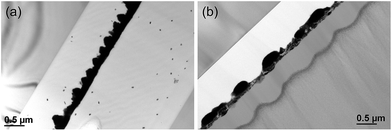 | ||
| Fig. 7 X-TEM images of the (a) as-deposited film and (b) sample irradiated at the highest fluence of 1 × 10¹⁶ ions per cm2. | ||
4 Conclusions
Embedded Au nanoparticles are obtained in thermally deposited Au/Bi double bilayer films after irradiation with 1.5 MeV Au ions. The GAXRD spectra showed no complete amorphization nor any alloy formation. SQUID magnetometer measurements of the post-irradiated samples revealed unusual ferromagnetic behavior in contrast to the complete diamagnetic nature of the as-deposited film. The origin of this ferromagnetic nature is speculated to be mainly due to the Au nanoparticles with a size below 3 nm being present in the sample and hence an elaborate structural analysis was carried out. FESEM and EDS studies imply the presence of molten state Bi surrounding the Au clusters due to partial heating in the post-irradiated samples. A TRIM calculation carried out for the sample indicates that the Au ions get implanted in the sample with a bimodal distribution. A schematic explanation of the entire process is also proposed. X-TEM imaging of the sample irradiated at the highest dose reveals the presence of Au nanoparticles embedded in between and beneath giant nanoclusters. On the basis of the TRIM calculation, it is suggested that these nanoparticles are produced by the projected Au ions after they get implanted in the sample. Finally, X-HRTEM analysis confirms the presence of Au nanoparticles with an average size of 2.61 nm which contribute to the ferromagnetic nature of the irradiated sample. It is an important observation, indicating that ferromagnetism can also be observed in non-functionalized, embedded Au nanoparticles which are free from any chemical impurities and are very much stable. This would be advantageous from a technological application point of view.Acknowledgements
We thank all the members of the Ion Beam Laboratory of Institute of Physics, Bhubaneswar for their help in the irradiation experiments. The authors acknowledge the funding from the National Institute of Science Education and Research (NISER) and Department of Atomic Energy (DAE), India.References
- G. L. Nealon, B. Donnio, R. Greget, J.-P. Kappler, E. Terazzib and J.-L. Gallani, Nanoscale, 2012, 4, 5244 RSC.
- C. M. Wu, C. Y. Li, Y. T. Kuo, C. W. Wang, S. Y. Wu and W. H. Li, J. Nanopart. Res., 2010, 12, 177 CrossRef CAS.
- C. Y. Li, C. M. Wu, S. K. Karna, C. W. Wang, D. Hsu, C. J. Wang and W. H. Li, Phys. Rev. B: Condens. Matter Mater. Phys., 2011, 83, 174446 CrossRef.
- V. Tuboltsev, A. Savin, A. Pirojenko and J. Raisanen, ACS Nano, 2013, 7, 6691 CrossRef CAS PubMed.
- H. Hori, T. Teranishi, Y. Nakae, Y. Seino, M. Miyake and S. Yamada, Phys. Lett. A, 1999, 263, 406 CrossRef CAS.
- P. Crespo, R. Litran, T. C. Rojas, M. Multigner, J. M. de la Fuente, J. C. Sanchez-Lopez, M. A. García, A. Hernando, S. Penades and A. Fernandez, Phys. Rev. Lett., 2004, 93, 087204 CrossRef CAS PubMed.
- J. S. Garitaonandia, M. Insausti, E. Goikolea, M. Suzuki, J. D. Cashion, N. Kawamura, H. Ohsawa, I. G. de Muro, K. Suzuki, F. Plazaola and T. Rojo, Nano Lett., 2008, 8, 661 CrossRef CAS PubMed.
- Y. Yamamoto, T. Miura, M. Suzuki, N. Kawamura, H. Miyagaya, T. Nakamura, K. Kobayashi, T. Teranishi and H. Hori, Phys. Rev. Lett., 2006, 93, 116801 CrossRef PubMed.
- K. N. K. Kowlgi, G. J. M. Koper, S. J. Picken, U. Lafont, L. Zhang and B. Norder, Langmuir, 2011, 27, 7783 CrossRef CAS PubMed.
- M. Suda, N. Kameyama, A. Ikegami and Y. Einaga, J. Am. Chem. Soc., 2009, 131, 865 CrossRef CAS PubMed.
- Z. Vager, I. Carmeli, G. Leitus, S. Reich and R. Naaman, J. Phys. Chem. Solids, 2004, 65, 713 CrossRef CAS.
- R. Naaman and Z. Vager, Phys. Chem. Chem. Phys., 2006, 8, 2217 RSC.
- I. Carmeli, G. Leitus, R. Naaman, S. Reich and Z. Vager, J. Chem. Phys., 2003, 118, 10372 CrossRef CAS.
- S. Reich, G. Leitus and Y. Feldman, Appl. Phys. Lett., 2006, 88, 222502 CrossRef.
- R. Jin, Nanoscale, 2010, 2, 343 RSC.
- R. J. Magyar, V. Mujica, M. Marquez and C. Gonzalez, Phys. Rev. B: Condens. Matter Mater. Phys., 2007, 75, 144421 CrossRef.
- W. Luo, S. J. Pennycook and S. T. Pantelides, Nano Lett., 2007, 7, 3134 CrossRef CAS PubMed.
- S. S. Pundlik, K. Kalyanaraman and U. V. Waghmare, J. Phys. Chem. C, 2011, 115, 3809 CAS.
- C. Diaz-Egea, T. Ben, M. Herrera, J. Hernandez, E. Pedrueza, J. L. Valdes, J. P. Martínez-Pastor, F. Attouchi, Z. Mafhoud, O. Stephan and S. I. Molina, Nanotechnology, 2015, 26, 405702 CrossRef PubMed.
- Q. Xi, X. Chen, D. G. Evans and W. Yang, Langmuir, 2012, 28, 9885 CrossRef CAS PubMed.
- U. B. Singh, D. C. Agarwal, S. A. Khan, S. Mohapatra, H. Amekura, D. P. Datta, A. Kumar, R. K. Choudhury, T. K. Chan, T. Osipowicz and D. K. Avasthi, Beilstein J. Nanotechnol., 2014, 5, 105 CrossRef PubMed.
- F. Ren, X. H. Xiao, G. X. Cai, J. Bo Wang and C. Z. Jiang, Appl. Phys. A, 2009, 96, 317 CrossRef CAS.
- S. Dhara, Crit. Rev. Solid State Mater. Sci., 2007, 32, 1 CrossRef CAS.
- A. Meldrum, L. A. Boatner and C. W. White, Nucl. Instrum. Methods Phys. Res., Sect. B, 2001, 178, 7 CrossRef CAS.
- V. Ramaswamy, T. E. Haynes, C. W. White, W. J. Moberly Chan, S. Roorda and M. J. Aziz, Nano Lett., 2005, 5, 373 CrossRef CAS PubMed.
- B. Satpati, P. V. Satyam, T. Som and B. N. Dev, J. Appl. Phys., 2004, 96, 5212 CrossRef CAS.
- J. de la Venta, A. Pucci, E. F. Pinel, M. A. Garcia, C. d. J. Fernandez, P. Crespo, P. Mazzoldi, G. Ruggeri and A. Hernando, Adv. Mater., 2007, 19, 875 CrossRef CAS.
- M. Nastasi, J. W. Mayer and J. K. Hirvonen, Ion-Solid interactions: Fundamentals and applications, University press, Cambridge, 1966 Search PubMed.
- J. F. Ziegler, J. Biersack and U. Littmark, The Stopping and Range of Ions in Matter, Pergamon Press, 1985 Search PubMed.
- D. J. Sprouster and M. C. Ridgway, Appl. Sci., 2012, 2, 396 CrossRef CAS.
- P. D. Borges, L. M. R. Scolfaro, H. W. L. Alves, E. F. da Silva Jr and L. V. C. Assali, Nanoscale Res. Lett., 2012, 7, 540 CrossRef PubMed.
- H. Hori, Y. Yamamoto, T. Iwamoto, T. Miura, T. Teranishi and M. Miyake, Phys. Rev. B: Condens. Matter Mater. Phys., 2004, 69, 174411 CrossRef.
- E. A. Olson, M. Y. Efremov, M. Zhang, Z. Zhang and L. H. Allen, J. Appl. Phys., 2005, 97, 034304 CrossRef.
Footnotes |
| † These authors contributed equally to this work. |
| ‡ Present address: Department of Physics, NIT, Patna-800005, Bihar, India. |
| This journal is © The Royal Society of Chemistry 2016 |

![[thin space (1/6-em)]](https://www.rsc.org/images/entities/char_2009.gif) 000 Oe to 20
000 Oe to 20