Ferrocenyl chalcones with phenolic and pyridyl anchors as potential sensitizers in dye-sensitized solar cells

Ratna Chauhan a, Reena Yadavb, Ashish Kumar Singhc, Manoj Trivedid, Gabriele Kociok-Köhne, Abhinav Kumar*b, Suresh Gosavif and Sunit Ranea
aCenter for Materials for Electronic Technology, Pune-411008, India
bDepartment of Chemistry, Faculty of Science, University of Lucknow, Lucknow 226 007, India. E-mail: abhinavmarshal@gmail.com
cSchool of Material Science and Technology, Indian Institute of Technology (Banaras Hindu University), Varanasi-221005, India
dDepartment of Physical Sciences, Shree Guru Gobind Singh Tricentenary University, Gurgaon, Haryana-122505, India
eChemical Characterisation and Analysis Facility (CCAF), University of Bath, Bath BA2 7AY, UK
fDepartment of Physics, University of Pune, Pune-411021, India

Received 15th September 2016 , Accepted 2nd October 2016

First published on 3rd October 2016


Abstract

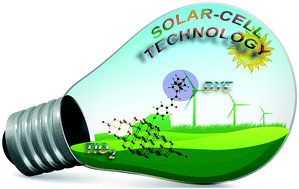
Five ferrocenyl chalcones viz. (E)-1-(3′-hydroxyphenyl)-3-ferrocenylprop-2-en-1-one (H-1), (E)-1-(4′-hydroxyphenyl)-3-ferrocenylprop-2-en-1-one (H-2), (E)-1-(2′-hydroxyphenyl)-3-ferrocenylprop-2-en-1-one (H-3), (E)-1-(4-pyridyl)-3-ferrocenylprop-2-en-1-one (H-4) and (E)-1-(2-pyridyl)-3-ferrocenylprop-2-en-1-one (H-5) having hydroxyl or pyridyl as the anchoring group have been synthesized and characterized using microanalyses, IR, 1H and 13C NMR, and in three cases, using single-crystal X-ray diffraction. UV-vis spectroscopic studies indicates that in comparison to ferrocene the electronic absorption bands of the synthesized dyes H-1–H-5 are bathochromically shifted up to 530 nm with concomitant enhancement in their intensities. The synthesized dyes have been exploited as photosensitizers in TiO2-based dye-sensitized solar cells (DSSCs). The photovoltaic performances and charge transport properties (EIS spectra) were studied to evaluate the synthesized dye performances in DSSCs. Amongst all the ferrocenyl chalcone dyes, those with the hydroxyl linker H-1–H-3 showed relatively superior photovoltaic performance in comparison to the dyes having a pyridyl anchor. The superior performances of H-1–H-3 are probably due to the better electronic communication between the ferrocene and the six-membered aromatic ring with anchoring group as well as the high dye loading abilities of these compounds on the TiO2 surface, which suppress charge recombination, prolong electron lifetime, and decreases the total resistance of DSSCs. The assembly fabricated using H-2 showed the best performance with an overall conversion efficiency η of 6.55%, Jsc of 11.99 mA cm−2 and Voc of −0.74 V. The long term stability of the photocurrent output of the cell using H-2 as photosensitizer has been monitored during 700 h which shows 92% retention of the cell parameters. Also, H-2 showed better thermal stability than the state-of-the-art N719 dye and also has a comparable lifetime of electrons in the conduction band.


Introduction

Dye-sensitized solar cells (DSSCs) can act as encouraging energy conversion devices for the generation of clean renewable energy and in turn can decrease the emissions of greenhouse gases with the advantages of low cost, simple processing and efficient performance.1,2 DSSCs consist of a dye molecule, semiconducting photoanode, redox mediator, and counter electrode. Their operating principle involves excitation of dye molecules by absorbing photons and transfer of electrons from the dye to the conduction band of TiO2 to the counter electrode via a external load.1 The oxidized dye molecule is regenerated by electron donation from the electrolyte whereas the oxidized electrolyte is in turn regenerated at the counter electrode by electrons passing through the external load.

Recent research efforts have been aimed toward further improving the efficiency by optimizing the dye architecture, employing suitable redox mediators, photoanodes and counter electrode materials.3 For instance, the dye architecture can be tuned to improve the molar extinction coefficient and the solar light harvesting capacity by modifying its chromophoric as well as anchoring group, thereby increasing the photocurrent and efficiency.4–6 Presently, power conversion efficiencies (η) for converting light to electricity have been found to be greater than 11% when ruthenium complexes7–10 and zinc porphyrins11,12 have been used. Also, using a co-sensitization strategy, an efficiency of up to 14.7% was reported using a carbazole/alkyl-functionalized oligothiophene/alkoxysilyl-anchor ADEKA-1 as photosensitizer co-sensitized with a carboxy-anchor LEG-4 dye.13 The reported conversion efficiency for these compounds are obtained when they are deposited on nanoporous TiO2 films as photoanodes, using I/I3 or Co2+/Co3+ redox couples as electrolytes, and using platinized conducting glass as counter electrodes.

We are interested in exploiting ferrocene as an antenna in dye-sensitized solar cells (DSSCs). The choice of using ferrocene derivatives as sensitizers is due to their well-defined reversible one-electron redox process14–16 and electron donating properties.14,17,18 Since the formal reduction potential E0 of the ferrocenyl group is dependent on the nature of the substituents on the cyclopentadienyl ring, the redox potential can be tuned to obtain the desired potential for a specific application.14,18,19 Keeping these aspects in mind we have reported the light harvesting properties of the homo- and heteroleptic complexes of ferrocenyl dithiocarbamates,20–24 as well as their organomercury(II) derivatives.25,26 Recently, we reported the investigation of ferrocenyl dithiocarbamates and dithiocarbonates as possible systems to be implemented in DSSCs.27,28 In addition to these sulfur derivatives, π-conjugated derivatives of ferrocene and biferrocene with different anchors have been reported by our group.29,30 In addition to our reports, Misra et al. had reported ferrocenyl substituted triphenylamine- based donor–acceptor dyes for dye sensitized solar cells.31 Sirbu et al. reported DSSCs fabricated using a trisubstituted ferrocene-based porphyrin derivative with a cobalt(II/III) electrolyte, with modest conversion efficiency32 and Cariello and co-workers have designed some ferrocenyl based dyes and investigated the role of π-conjugation on the conversion efficiency.33

Although ferrocenyl substituted chalcones have been reported with various applications34–41 their use as sensitizers in dye-sensitized solar cells has not been explored. Hence, we thought of deploying enone conjugated ferrocenyl systems with anchoring groups substituted at different positions in the aromatic ring as sensitizers in dye-sensitized solar cells. This work was undertaken due to two important reasons: (1) incorporation of a conjugated enone moiety can induce bathochromic as well as hyperchromic shifts in the electronic absorption spectrum of the ferrocene band which is generally observed at ∼450 nm.42 This can improve the light harvesting properties of dye. (2) The anchoring groups substituted at different positions in the aromatic ring can change the dihedral angle between the aromatic ring containing the anchoring group and the plane of the enone linkage through which one can tune the electronic communication between the ferrocenyl group and aromatic ring via the enone linkage.39 We believe that these two important points will be important when techno-economic aspects for these dyes are explored and therefore we wish to report the syntheses, characterization and light harvesting properties of some ferrocenyl chalcones with anchoring groups substituted at different positions in the aromatic ring.

Results and discussion

Ferrocenyl chalcones H-1–H-5 comprising of –OH or pyridyl anchors at varying positions were prepared by base-catalyzed Claisen–Schmidt condensation of the appropriate 2-, 3- and 4-hydroxyacetophenones as well as 2- and 4-acetylpyridines (Scheme 1). All the five compounds were air stable and were characterized by IR, 1H and 13C NMR spectroscopy, elemental analyses and in three cases structures were confirmed by single-crystal X-ray diffraction analysis.
image file: c6ra23034b-s1.tif
Scheme 1 Synthetic route for preparation of sensitizers.

Spectroscopy

The IR spectra for all five compounds display bands at ∼1635–1694 cm−1 corresponding to the carbonyl group while bands at ∼1560–1594 cm−1 are indicative of the C[double bond, length as m-dash]Cvinyl group. Also in the case of H-1–H-3 the bands at ∼3300 cm−1 corresponds to the presence of phenolic –OH. All compounds display well-resolved 1H NMR signals which integrate to the corresponding hydrogens.

Crystal structures

Three X-ray structures are reported in the current study. Single crystals of the complexes were obtained by slow evaporation of dichloromethane–ethanol mixtures (50[thin space (1/6-em)]:[thin space (1/6-em)]50 v/v). The X-ray structural analyses of H-1, H-2 and H-3 indicates that all three compounds crystallize in the monoclinic system. The molecular structures of all the three compounds (Fig. 1–3) and their torsion angles (Table 1) reveal that the Cp ring and enone linkage are almost co-planar with a dihedral angle of less than 10°. The planar aromatic ring deviates slightly from the plane made by the enone linkage: the dihedral angle between the six-membered aromatic ring (C14–C19) and the plane of the enone linkage (C11–C12–C13–O1) is 9.49(14)° for H-1, 4.21(18)° for H-2 and 6.21(15)° for H-3. These small dihedral angles indicate the possibility for strong electronic communications between the ferrocenyl group and aromatic ring containing the –OH group through the enone linkage.39 The dihedral angle values indicate that the electronic communication follows the order H-2 > H-3 > H-1. These X-ray parameters suggest that these ferrocenyl chalcone derivatives may be utilized in DSSCs as high electronic communication is one of the important prerequisites for a molecule to be used as a sensitizer.1,2 It is also noteworthy that the spatial arrangement of the enone part is similar in all the three sensitizers. The two double bonds (C[double bond, length as m-dash]O and C[double bond, length as m-dash]C) about the intervening C–C single bond are in the s-trans conformation for all the three sensitizers (Table 2).
image file: c6ra23034b-f1.tif
Fig. 1 ORTEP diagram for sensitizer H-1. Thermal ellipsoids are plotted at the 30% probability level.

image file: c6ra23034b-f2.tif
Fig. 2 ORTEP diagram for sensitizer H-2. Thermal ellipsoids are plotted at the 30% probability level.

image file: c6ra23034b-f3.tif
Fig. 3 ORTEP diagram for sensitizer H-3. Thermal ellipsoids are plotted at the 30% probability level.
Table 1 Selected geometrical parameters for the sensitizers (Å and °)
  H-1 H-2 H-3
Bond lengths
C10–C11 1.449(2) 1.457(3) 1.445(2)
C11–C12 1.342(2) 1.340(3) 1.339(2)
C12–C13 1.467(2) 1.470(3) 1.464(2)
C13–C14 1.497(2) 1.486(3) 1.474(2)
C13–O1 1.237(2) 1.240(2) 1.249(2)
[thin space (1/6-em)]
Bond angles
C10–C11–C12 124.74(15) 125.50(19) 125.40(17)
C11–C12–C13 122.11(16) 122.50(19) 121.31(16)
C12–C13–C14 118.54(15) 119.45(18) 120.28(15)
C12–C13–O1 120.95(15) 120.85(19) 119.70(16)
C14–C13–O1 120.50(15) 119.70(18) 120.00(16)
[thin space (1/6-em)]
Torsion angles
C9–C10–C11–C12 179.54(16) −9.3(3) 9.5(3)
C13–C12–C11–C10 179.76(15) 179.21(18) −178.33(16)
C14–C13–C12–C11 179.20(15) −176.65(19) 177.45(16)


Table 2 TD-DFT excitations and approximate assignments for H-1–H-5
Energy/eV λmax/nm Oscillator strength (f) Composition (%) Nature of transition and approximate assignment
H-1
2.43 510 0.075 HOMO → LUMO (35%) HOMO−1 → LUMO+2 (23%) Fc → Ar(OH)–C[double bond, length as m-dash]C–C[double bond, length as m-dash]O
[thin space (1/6-em)]
H-2
2.38 522 0.078 HOMO → LUMO (38%) HOMO−1 → LUMO+3 (18%) Fc → Ar(OH)–C[double bond, length as m-dash]C–C[double bond, length as m-dash]O
[thin space (1/6-em)]
H-3
2.42 512 0.071 HOMO → LUMO (37%) HOMO−1 → LUMO+3 (17%) Fc → Ar(OH)–C[double bond, length as m-dash]C–C[double bond, length as m-dash]O
[thin space (1/6-em)]
H-4
2.34 529 0.090 HOMO → LUMO (39%) HOMO−1 → LUMO+2 (18%) Fc → Py–C[double bond, length as m-dash]C–C[double bond, length as m-dash]O
[thin space (1/6-em)]
H-5
2.37 523 0.071 HOMO → LUMO (33%) HOMO−1 → LUMO+2 (17%) Fc → Py–C[double bond, length as m-dash]C–C[double bond, length as m-dash]O


Optical properties of the sensitizers

The electronic absorption spectra for the sensitizers were recorded in dichloromethane solution and are presented in Fig. 4. The electronic absorption spectra for all five sensitizers display a prominent band located at ∼530 nm which due to the d → d transition (assigned to 1E1g1A1g).42 However, in comparison to ferrocene, the band is significantly red shifted.42 This bathochromic shifting may be attributed to extensive π-conjugation operating from ferrocene to the aromatic system via the enone linkage thereby leading to strong electronic communication in the molecule. This significant red shifting in the electronic absorption band corresponding to ferrocene provides impetus to use these molecules as potential sensitizers in DSSC. The electronic spectra of the dyes recorded on a TiO2 film (Fig. 5) indicates slight broadening as well as minor bathochromic shifts which may arise because of aggregation43a or electronic coupling of the dyes on the TiO2 surface.43b
image file: c6ra23034b-f4.tif
Fig. 4 Electronic spectra of dyes recorded in 10−4 M dichloromethane solution.

image file: c6ra23034b-f5.tif
Fig. 5 Electronic spectra of dyes adsorbed on TiO2 film.

In order to gain insight into the nature of transitions in all of the molecules time-dependent density functional theory calculations have been performed. In all the five cases the HOMO is mainly located at the ferrocenyl center and the LUMO is present at the aromatic ring (containing the phenolic/pyridyl fragment) along with the enone-moiety to some extent (Fig. 6).


image file: c6ra23034b-f6.tif
Fig. 6 Energy level diagram for the cell assembly fabricated by dyes H-1–H-5 (computed HOMO and LUMO plots are also shown).

Electrochemical properties

In order to determine the HOMO–LUMO levels and to evaluate the possibility of electron transfer from the excited dye molecules to the conduction band of TiO2 and dye regeneration by the electrolyte (I/I3−), the electrochemical properties of H-1–H-5 were measured using cyclic voltammetry (CV) in dichloromethane containing 0.1 M tetrabutylammonium perchlorate (Bu4NClO4). The experiments were performed with a three-electrode system with platinum-disc working electrode, a platinum-wire counter electrode and an Ag/Ag+ (in acetonitrile) reference electrode. Prior to experiments, the electrochemical solution was purged with purified nitrogen gas to eliminate dissolved oxygen from the solution. Cyclic voltammograms were recorded using anhydrous solutions of the dye (10−4 M) in dichloromethane containing supporting electrolyte. The potential scan rate was 100 mV s−1. These dyes are easily reduced and oxidized in solution due to the ferrocene moiety present in the system. The differences in the values of redox potential may be due to variation in the position of –OH or N(py) groups at the aromatic fragment of the chalcone. As expected, all the dyes exhibited a quasireversible oxidation wave and the electrochemical parameters are summarized in Table 3.
Table 3 Electrochemical properties of the sensitizersa
Dye Ep,a/V Ep,c/V ΔE (= Ep,aEp,c)/V E0 (= (Ep,a + Ep,c)/2)/V E.S. = E0 +
a E.S. excited state (LUMO); E0 ground state (HOMO) of dyes.
H-1 0.616 0.386 0.230 0.501 −1.84
H-2 0.594 0.504 0.090 0.549 −1.87
H-3 0.630 0.532 0.098 0.581 −1.80
H-4 0.578 0.418 0.160 0.498 −1.81
H-5 0.638 0.430 0.208 0.534 −1.79


For efficient electron injection, the LUMO level of dyes should lie above the conduction band (CB) of the TiO2 semiconductor, and for effective dye regeneration, the HOMO energy level of dye should lie below the I/I3− redox electrolyte. Also, the TiO2 conduction band edge can be shifted toward negative potential on adding additives such as 4-tert-butylpyridine (TBP) to the I/I3− redox electrolyte which in turn improves the open circuit potential.44 Hence, the energy levels of the synthesized dyes are suitable for electron injection and dye regeneration thermodynamically.45 From the values calculated by cyclic voltammetry it is clear that the excited state of dyes are more negative (−1.79 to −1.87 V vs. Ag/Ag+ in acetonitrile) than the conduction band edge of TiO2 (−0.85 V vs. Ag/Ag+ in acetonitrile) and the ground state of the dyes are more positive (+0.498 to +0.549 V vs. Ag/Ag+ in acetonitrile). The LUMO level of all dyes are higher than the TiO2 conductive band and the HOMO level of dyes are below the redox potential of the redox couple, thus ensuring the feasibility of electron injection and dye regeneration (Fig. 6).

Electron structure and electron injection

To assess the electron injection mechanism in the case of dye + (TiO2)30 interaction, we should refer to the density of states (DOS) plot of the dye + (TiO2)30 system. The DOS of the dyes are presented in Fig. 7. When compared to the DOS of the cluster (Fig. 8), the DOS of the dyes shows clearly localized states, which are all occupied (Fig. 7). The DOS of (TiO2)30 as well as dye + (TiO2)30 in which the dye is adsorbed to (TiO2)30 cluster through phenolic/pyridyl anchors (Fig. S1 ESI) are presented in Fig. 8. In the case of dye + (TiO2)30, the DOS plot clearly indicate core states, the valence band (VB), and conduction band (CB). The fundamental TiO2 valence band is located at the energy levels roughly between −10.0 and −8.2 eV, and the conduction band is located starting from −4.2 eV. From the DOS plot for the bare (TiO2)30 cluster, a clear separation between the VB and CB without any gap states is observed. The adsorption of the dyes onto the nanoparticle surface introduces occupied states at the lower part of the nanoparticle band gap and extends the valence states from around −8.2 to −5.6 eV. Based on the DOS plots (Fig. 8), it is concluded that lower energy electrons are excited from VB energy levels approximately between −8.2 and −5.6 to 5.8 eV for dye + (TiO2)30 and then transferred to CB states above −4.2 eV. Based on the DOS plot, the minimum inter-band excitation energy lies in the range of 1.4–1.6 eV for the dye + (TiO2)30 systems. The results of DOS indicates significant electronic coupling between LUMO of dyes and the CB of TiO2, however, this electronic coupling is relatively weaker in H-4 and H-5 dyes comprising the pyridyl moiety.
image file: c6ra23034b-f7.tif
Fig. 7 Density of states (DOS) plots for H-1–H-5 and bare (TiO2)30 cluster.

image file: c6ra23034b-f8.tif
Fig. 8 DOS plots for (TiO2)30 cluster + H-1–H-5 and bare (TiO2)30 cluster.

Photovoltaic performance

The ferrocenyl chalcone dyes (H-1–H-5) were exploited as sensitizers in DSSCs. Fig. 9 shows the JV curve for the devices using dyes H-1–H-5 which were measured under AM 1.5 illuminations (100 mW cm−2 at 298 K). The photovoltaic performance of the dyes H-1–H-5 and N719 sensitized cells are presented in Table 4. Under standard global illumination condition the dye sensitized cell gave a maximum short circuit photocurrent density (Jsc) and cell efficiency (η) of about 11.99 mA cm−2 and 6.55%, respectively, with H-2 and minimum short circuit photocurrent density (Jsc) and cell efficiency (η) 8.70 mA cm−2 and 3.66%, respectively, with H-5. The DSSCs based on H-1, H-3, H-4 and H-5 exhibited relatively lower photovoltaic performances than the DSSCs based on H-2. This may be mainly due to the lower Jsc and fill factor values for the DSSCs based on H-1, H-3, H-4 and H-5. The Voc and fill factor values of the solar cells must be improved to achieve highly efficient photovoltaic performance.1 Although H-1, H-2 and H-3 are simply positional isomers with varying positions of the anchoring phenolic –OH group, they exhibited different photovoltaic parameters due to the varying degrees of the electronic communications operating between the ferrocene and the six-membered aromatic ring having anchoring group through the enone moiety. As is evident from the X-ray structures, the dihedral angles between the six-membered aromatic ring and the enone moiety follow the order H-2 < H-3 < H-1 (vide supra) which indicates that the order of electronic communication is H-2 > H-3 > H-1 and this is in agreement with the observed photovoltaic parameters. The relatively poorer performances of H-4 and H-5 based cell set-ups may be due to relatively inefficient adsorption of these dyes on TiO2 because of the presence of pyridyl anchoring groups, which directly influences electron injection. The relatively superior performance of H-4 in comparison to H-5 may arise because of the better electronic communication between the ferrocene and the six-membered aromatic ring in H-4 than in H-5.
image file: c6ra23034b-f9.tif
Fig. 9 JV curves for DSSCs based on H-1–H-5 sensitized photoelectrodes and N719 sensitized photoelectrodes under irradiation.
Table 4 Photovoltaic parameters for the dyes
Dye Dye loading amount/mmol cm−2 Jsc/mA cm−2 Voc/V FF η (%) Max. IPCE (%) τeff/ms
N719 3.78 × 10⁻⁷ 13.62 −0.77 0.73 7.70 55 6.62
H-1 2.94 × 10⁻⁷ 10.44 −0.75 0.72 5.71 39 3.88
H-2 3.76 × 10⁻⁷ 11.99 −0.74 0.74 6.55 48 6.35
H-3 3.53 × 10⁻⁷ 11.22 −0.72 0.75 6.06 43 4.92
H-4 2.31 × 10⁻⁷ 9.13 −0.72 0.65 4.24 35 2.12
H-5 2.12 × 10⁻⁷ 8.70 −0.68 0.62 3.66 32 1.88


Under the same conditions, the N719 sensitized cell gave a Jsc of 13.62 mA cm−2, Voc of 0.77 V, fill factor of 0.73, and corresponding efficiency of about 7.7%. The Voc of the ferrocenyl chalcone dyes are lower than that of the N719 dye because the molecular structure of the dyes presented herein comprises of phenolic –OH or pyridyl group but lacks the –COOH group. In comparison to phenolic –OH or pyridyl groups, the –COOH functional group has better capability to combine with TiO2 nanoparticles, and hence can boost the coupling effect of electrons on the TiO2 conduction band to acquire a rapid electron-transport rate.

In our previous investigations, we have synthesized transition-metal ferrocenyl dithiocarbamates20–24 and phenylmercury(II) methylferrocenyldithiocarbamates25 involving ferrocene with no specific anchoring groups and these dyes acted as photosensitizers through remote sensing or physical adsorption on the TiO2 surface and showed a spectral response in the range of 400–440 nm. The obtained efficiency was ∼60% that of the N719 dye with these systems. Our recent investigation with phenylmercury(II) methylferrocenyldithiocarbamates with –OH linker26 showed enhancement of the photovoltaic performance. To overcome the anchoring problem we had also designed π-extended ferrocenes29 with varied anchoring groups which provided better anchorage than the previous dyes and gave relatively better results. However, in all the cases we were unable to enhance the spectral response in the visible region beyond 450 nm. With the ferrocenyl chalcones in the presented investigation we succeeded in extending the spectral response in the visible region up to 530 nm. The presented results are encouraging and clearly indicate that the photovoltaic parameters of ferrocenyl chalcones as photosensitizers are almost comparable to the N719 dye and these ferrocenyl based dyes with some fine tuning may become promising candidates for the realization of high cell performance, low-cost production, and non-toxicity.

The photocurrent action spectra are shown in Fig. 10, where the incident photon-to-current conversion efficiency (IPCE) is plotted as a function of wavelength. The photocurrent action spectrum resembles the absorption spectra except for a slight red shift by ca. 3–4 nm. The strong absorption of blue light by I/I3 electrolyte is considered to decrease the IPCE value in the short wavelength region,47 resulting in the red shift of the peak in the action spectrum. The observed differences in the photocurrent obtained by the JV curve and IPCE spectra for the same sensitizer is due to the differences in the intensities and energies of the light source (Tables S1 and S2, ESI).


image file: c6ra23034b-f10.tif
Fig. 10 IPCE plots for the sensitizers N719 and H-1–H-5.

The maximum IPCE values observed at the characteristic wavelengths for the dyes are 39, 48, 43, 35 and 32% for complexes H-1, H-2, H-3, H-4 and H-5, respectively. These IPCE values obtained under short-circuit conditions can be increased if the semiconductor photoanode is externally biased with positive potential.

In dye-sensitized solar cells, the charge carrier dynamics in the interfacial regions of TiO2/dye/electrolyte, and its correlation with cell performance have been investigated by electrochemical impedance spectroscopy (EIS).46 The Nyquist plots of EIS for DSSCs sensitized by N719 as well as dyes H-1–H-5, measured at their open circuit potential (OCP) over a frequency range of 10−2 to 9 × 10⁵ Hz under standard AM 1.5G solar irradiation are shown in Fig. 11. Two semicircles in the Nyquist plots are observed. The small and large semicircles located in the high and middle frequency regions are assigned to the charge transfer at the Pt/electrolyte and TiO2/dye/electrolyte interfaces, respectively. Under light illumination, the radius of the large semicircle located in middle frequency regions in the Nyquist plot decreases, suggesting a decrease of the electron transfer impedance and an increase of charge transfer rate at this interface. Upon illumination the decrease in charge transport resistance in the middle frequency region follows the order N719 > H-2 > H-3 > H-1 > H-4 > H-5.47 Further, Bode plots (Fig. 11b) were plotted in order to find out the lifetime (τe) of electrons using the following equation.47

image file: c6ra23034b-t1.tif
where, fmax is the frequency at the maximum of the curve in the intermediate frequency region in the Bode plot.


image file: c6ra23034b-f11.tif
Fig. 11 Electrochemical impedance spectra of DSSCs measured at Voc, 100 mW cm−2: (a) Nyquist plots, (b) Bode plots.

The electron lifetime (τe) for the devices with N719 and H-2 were found to be longer than with H-1, H-3, H-4 and H-5. This difference might be expected, since the adsorption of N719 and H-2 on TiO2 may lead to better dye coverage for passivity of the TiO2 surface and thus minimizes the recombination due to electron back-transfer between TiO2 and I3. The improvement in charge transport properties, longer electron lifetime and suppression in back reaction leads to the enhancement in cell efficiency.

Open-circuit voltage decay (OCVD)

The OCVD technique is a powerful tool to investigate the interfacial recombination processes operating in the TiO2 based DSSCs between injected electrons and the electrolyte and provides some quantifiable insight into the electron recombination rate in DSSCs.48,49 The OCVD decay curves of the DSSCs based on different photoelectrodes are presented in Fig. 12. It is apparent from the figure that the OCVD response of the DSSC fabricated using H-2 sensitized photoelectrode is much slower than that of the other sensitizers reported herein (H-1, H-3, H-4 and H-5) especially in the shorter time domain (within 12 s). Since decay of Voc reflects the decrease in electron concentration, which mainly arises by charge recombination,50 the cell sensitized by H-2 has a lower electron recombination rate than that of the cell sensitized by H-1, H-3, H-4 and H-5, which are favorable for improving the performance of DSSCs.
image file: c6ra23034b-f12.tif
Fig. 12 Open-circuit voltage decay curves of the DSSCs based on different photoelectrodes.

Long-term stability

Long-term stability measurements were carried out on devices sensitized with H-2 by subjecting them to prolonged operation of the cell at full solar light intensity for 700 h at 298 K (Fig. 13). The cells were kept at their maximum power point during the illumination. We obtained excellent stability over this long time period, showing that H-2 is a very stable dye and not prone to degradation. The durability for 700 h was tested by measuring the data at different intervals during 700 h and non-accelerated tests were undertaken. The graph shows 92% retention of the cell parameters, which indicates high cell stability. The drop in PCE of 7–8% for the devices is attributed to desorption of a small amount of sensitizer from the TiO2 surface, decreasing the photovoltaic performance. In the future, the introduction of stronger anchoring groups into the high-performance H-2 type design should serve to minimize any dye desorption and further improve the stability of the device.
image file: c6ra23034b-f13.tif
Fig. 13 Photovoltaic parameters of the cell made from sensitizer H-2 upon prolonged operation; Jsc: short-circuit photocurrent density; Voc: open-circuit voltage; FF: fill factor; η: power conversion efficiency.

Efficiency versus thermal stress

The heating effect occurring due to the continuous use of a cell under illumination is a major impediment for long term practical use of DSSCs. To making an allowance for this, we studied the effect of different annealing temperature on the efficiency of standard N719 dye and the most efficient dye H-2 reported herein. For measuring the thermal stability of both N719 and H-2 dyes, the cells were heated to different temperatures up to 200 °C for 30 min and their efficiency was tested after cooling to the room temperature. Fig. 14 indicates the superior stability of dye H-2 over N719 dye. From this study we also found that the efficiency degradation temperature for N719 dye was 50 °C whereas it was 100 °C for H-2. This thermal stability is an encouraging aspect for the long term thermal stability of these ferrocenyl chalcone based dyes in DSSCs.
image file: c6ra23034b-f14.tif
Fig. 14 Effect of thermal stress on solar cell efficiency of N719 and dye H-2.

Conclusion

Based on the findings of the present investigation it can be concluded that the synthesized ferrocenyl chalcone dyes with anchoring groups at different positions can act as donor type sensitizers and with the use of these dyes, the spectral response of wide band gap TiO2 electrode can be extended well into the visible region (up to 530 nm wavelength). The action spectrum obtained with these compounds adsorbed on TiO2 electrode provides clear evidence for their sensitization effect. Also, the DOS plot for the (TiO2)30 + H-2 system indicated that the adsorption of dye H-2 to the nanoparticle surface of (TiO2)30 introduces occupied states at the lower part of the nanoparticle band gap, leading to effective VB broadening, extending valence states from around −8.2 to −5.6 eV. Although we have succeeded in achieving only ∼85% of cell efficiency of N719 dye, as far as the techno-economic aspects are concerned, these ferrocene chalcone based dyes may be an alternative for the N719 dye. The long term stability of the photocurrent output of the cell using H-2 as photosensitizer has been monitored during 700 h which shows 92% retention of the cell parameters. Also, H-2 showed better thermal stability than the state-of-the-art N719 dye and has a comparable lifetime of electrons in the conduction band. We also showed that the dihedral angles between the six-membered aromatic ring having anchoring group and the enone moiety controls the electronic communication between the ferrocenyl moiety and the six-membered ring which in turn controls the photovoltaic parameters of these devices. Hence enhancement in the spectral response in the visible region, use of a suitable anchoring group, electron communication properties and low lying LUMO level, better thermal and long term stabilities makes these ferrocenyl chalcone systems an attractive candidate for enhancing the cell efficiency in DSSCs.

Experimental

Materials and methods

All chemicals and reagents were commercially available and used without further purification. Ferrocene carbaldehyde, 2-, 3-, 4-hydroxyacetophenone and 2- and 4-acetylpyridine were purchased from Sigma-Aldrich. Solvents were distilled in accordance with the standard procedure.

Physical measurements

Elemental analyses were performed on a Perkin-Elmer 240C, H, N analyzer. Infrared spectra were recorded as KBr pellets on a Shimadzu IRAffinity-1S. 1H and 13C NMR spectra were recorded on a BRUKER Avance III FTNMR spectrophotometer. Chemical shifts were reported in parts per million using TMS as internal standard. The electronic absorption spectra in dichloromethane solutions were recorded using a SPECORD 210 PLUS BU UV-vis spectrophotometer. Electrochemistry was carried out using a Pt working electrode, Pt rod counter electrode and Ag/AgCl as a working electrode. All the electrochemical experiments were carried out in dichloromethane. In all cases TBAP (0.1 M) was used as the supporting electrolyte. After each experiment the reference electrode was calibrated against the ferrocene/ferrocenium couple which was found to be at 0.55 V. The photoelectrochemical performance, including the short-circuit current (Jsc, mA cm−2), open-circuit voltage (Voc, V), fill factor (FF), and overall energy conversion efficiency (η) were determined from the JV curve obtained by using a digital Keithley 236 instrument under white light irradiation from a 1000 W/HS xenon arc lamp with 100 mW cm−2 light intensity corresponding to 1.5 AM. The maximum output power (Pmax) was obtained by determining a point on JV curve corresponding to which the product of current (Jmax) and voltage (Vmax) is maximum. The power conversion efficiency (η) and fill factor (FF) were evaluated using the following relations:
image file: c6ra23034b-t2.tif

image file: c6ra23034b-t3.tif
here Jsc, Voc and Iinc are short-circuit photocurrent, open-circuit potential and intensity of incident light, respectively.

To avoid spurious light reflections and refractions, a black mask was used for the cell on the illuminated side and also covered the side area of the cell, which could otherwise contribute to the cell response and lead to erroneous interpretation. The reproducibility and reliability of all results were confirmed by testing three cells each of H-1–H-5 sensitized photoanodes and keeping all structural and photovoltaic characterization identical. The active area of the cells was 0.25 cm2.

The incident photon-to-electron conversion efficiency (IPCE) was measured by using a 300 W Xe lamp light source joined to a monochromator (Oriel). A reference Si photodiode calibrated for spectral response was used for the monochromatic power-density calibration. From the values of Jsc and the intensity of the corresponding monochromatic light (Iinc), the incident photon-to-current conversion efficiency (IPCE) was calculated at each excitation wavelength (λ) using the following relation:

image file: c6ra23034b-t4.tif

Electrochemical impedance spectroscopy (EIS) was performed on a CH 660C electrochemical analyzer (CH Instruments, Shanghai, China) in a two-electrode configuration. The photoanode was used as a working electrode and the Pt electrode as a counter electrode. The electron transport properties were investigated using electrochemical impedance spectroscopy (EIS) with a 10 mV ac signal in the frequency range of 10−2 to 105 Hz.

Syntheses

Ferrocene carbaldehyde (0.107 g, 0.50 mmol) and 3-hydroxyacetophenone (0.071 g, 0.52 mmol) (H-1) were dissolved in dry ethanol (3 mL) and the reaction mixture was stirred for 30 min under nitrogen atmosphere. To the reaction mixture an aqueous solution of potassium hydroxide (0.78 mL) (40% w/w) was added dropwise during which the reaction mixture turned violet–red. This was stirred for 6 h and kept in a freezer overnight. The mixture was poured onto crushed ice and neutralized with dilute HCl (40%). The obtained precipitate was filtered off and washed six times with water and the precipitate was recrystallised from methanol.

The same procedure was applied to prepare 4-hydroxyacetophenone (0.071 g, 0.52 mmol) (H-2), 2-hydroxyacetophenone (0.0.71 g, 0.52 mmol) (H-3) and 2-acetylpyridine (0.063 g, 0.52 mmol) (H-5).

(E)-1-(3′-Hydroxyphenyl)-3-ferrocenylprop-2-en-1-one (H-1). Violet solid. (Yield 0.145 g, 87.3%); mp 153 °C. IR (KBr, cm−1): 3243 (O–H), 3050 (Ar, C–H), 1635 (C[double bond, length as m-dash]O), 1580 (C[double bond, length as m-dash]Cvinyl), 1364, 1293, 1207 (Cp, C[double bond, length as m-dash]C), 490 (Fe–Cp). 1H NMR (300.13 MHz, CDCl3): δ 7.80 (d, J = 15.0, 1H, Hvinyl), 7.67 (d, J = 18.3, 1H, Har), 7.53 (s, 1H, Har), 7.37 (t, J = 7.2, 1H, Har), 7.13 (d, J = 15.0, 1H, Har), 6.65 (s, 1H, Hvinyl), 4.60 (s, 2H, C5H4), 4.50 (s, 2H, C5H4), 4.19 (s, 5H, C5H5). 13C NMR (75.50 MHz, CDCl3): δ 188.1 (C[double bond, length as m-dash]O), 146.0 (Car), 139.2 (Cvinyl), 133.2 (Car), 129.6 (Car), 119.7 (Cvinyl), 119.1 (Car), 118.9 (Car), 114.3 (Car), 78.9 (C5H4), 71.2 (C5H4), 69.3 (C5H5), 68.7 (C5H4). Elemental analysis for C19H16FeO2 (Mr = 332.17): calc.: C, 68.70%; H, 4.85%. Found: C, 69.21%; H 4.89%.
(E)-1-(4′-Hydroxyphenyl)-3-ferrocenylprop-2-en-1-one (H-2). Violet solid. (Yield 0.118 g, 71.1%); mp 170 °C. IR (KBr, cm−1): 3199 (O–H), 3100 (Ar, C–H), 1630 (C[double bond, length as m-dash]O), 1584 (C[double bond, length as m-dash]Cvinyl), 1362, 1299, 1276 (Cp, C[double bond, length as m-dash]C), 490 (Fe–Cp). 1H NMR (300.13 MHz, CDCl3): δ 7.93 (d, J = 7.5, 1H, Hvinyl), 7.75 (d, J = 7.5, 2H, Har), 7.13 (d, J = 8.4, 1H, Hvinyl), 6.94 (d, J = 6.9, 2H, Har), 4.59 (d, J = 5.7, 2H, C5H4), 4.50 (s, 2H, C5H4), 4.18 (s, 5H, C5H5). 13C NMR (75.50 MHz, CDCl3): δ 198 (C[double bond, length as m-dash]O), 161.1 (Car), 146.0 (Car), 131.3 (Cvinyl), 130.1 (Car), 122.9 (Cvinyl), 115.7 (Car), 78.9 (C5H4), 71.8 (C5H4), 70.1 (C5H5), 69.3 (C5H4). Elemental analysis for C19H16FeO2 (Mr = 332.17): calc.: C, 68.70%; H, 4.85%. Found: C, 68.98%; H 4.92%.
(E)-1-(2′-Hydroxyphenyl)-3-ferrocenylprop-2-en-1-one (H-3). Violet solid. (Yield 0.120 g, 72.3%); mp 138 °C. IR (KBr, cm−1): 3400 (O–H), 3100 (Ar, C–H), 1630 (C[double bond, length as m-dash]O), 1557 (C[double bond, length as m-dash]Cvinyl), 1347, 1304, 1207 (Cp, C[double bond, length as m-dash]C), 500 (Fe–Cp). 1H NMR (300.13 MHz, CDCl3): δ 7.93 (s, 1H, Hvinyl), 7.87 (d, J = 7.8, 1H, Har), 7.51 (t, J = 8.1, 1H, Har), 7.22 (s, 1H, Hvinyl), 7.03 (d, J = 8.4, 1H, Har), 6.95 (t, J = 7.0, 1H, Har), 4.64 (s, 2H, C5H4), 4.54 (s, 2H, C5H4), 4.20 (s, 5H, C5H5). 13C NMR (75.50 MHz, CDCl3): δ 192.9 (C[double bond, length as m-dash]O), 163.8 (Car), 148.2 (Cvinyl), 136.1 (Car), 129.6 (Car), 120.2 (Cvinyl), 118.9, 118.8, 116.8 (Car), 78.9 (C5H4), 72.1 (C5H4), 70.1 (C5H5), 69.5 (C5H4). Elemental analysis for C19H16FeO2 (Mr = 332.17): calc.: C, 68.70%; H, 4.85%. Found: C, 69.11%; H 4.95%.
(E)-1-(4-Pyridyl)-3-ferrocenylprop-2-en-1-one (H-4). A mixture of ferrocene carbaldehyde (0.107 g, 0.50 mmol) and 4-acetylpyridine (0.063 g, 0.52 mmol) was ground homogeneously with solid potassium hydroxide (at a mole ratio of the mixture to KOH of 1[thin space (1/6-em)]:[thin space (1/6-em)]5) in a mortar and pestle. The mixture was then allowed to stand in an oil-bath at 70 °C for 24 h. During this time the mixture turned deep red. The product was extracted with dichloromethane and dried with Na2SO4. After filtration, the product was concentrated and precipitated with light petroleum to obtain a violet solid product which was purified by column chromatography (SiO2, petroleum ether–diethyl ether = 1[thin space (1/6-em)]:[thin space (1/6-em)]1) (Yield 0.100 g, 63.1%); mp 95 °C. IR (KBr, cm−1): 3100 (Ar, C–H), 2300 (Ar C[double bond, length as m-dash]N), 1680 (C[double bond, length as m-dash]O), 1595 (C[double bond, length as m-dash]Cvinyl), 1350, 1250 (Cp, C[double bond, length as m-dash]C), 483 (Fe–Cp). 1H NMR (300.13 MHz, CDCl3): δ 9.96 (s, 2H, py), 7.78 (s, 2H, py), 7.55 (d, J = 3.0, 1H, Hvinyl), 6.77 (d, J = 15.6, 1H, Hvinyl), 4.66 (s, 2H, C5H4), 4.47 (s, 2H, C5H4), 4.28 (s, 5H, C5H5). 13C NMR (75.50 MHz, CDCl3): δ 193.7 (Cketo), 146.8 (CPy), 142.3 (Cvinyl), 135.7 (CPy), 120.5 (Cvinyl), 79.7 (C5H4), 71.6 (C5H4), 69.9 (C5H5), 68.9 (C5H4). Elemental analysis for C18H15FeNO (Mr = 317.16): calc.: C, 68.16%; H, 4.77%; N, 4.42%. Found: C 68.54%; H, 4.89%; N, 4.67%.
(E)-1-(2-Pyridyl)-3-ferrocenylprop-2-en-1-one (H-5). Violet solid. (Yield 0.084 g, 53.2%); mp 135 °C. IR (KBr, cm−1): 3090 (Ar, C–H), 2150 (C[double bond, length as m-dash]N), 1694 (C[double bond, length as m-dash]O), 1594 (C[double bond, length as m-dash]Cvinyl), 1356, 1319 (Cp), 488 (Fe–Cp). 1H NMR (300.13 MHz, CDCl3): δ 8.74 (d, J = 4.2, 1H, py), 8.64 (d, J = 4.2, 1H, Hvinyl), 8.21 (d, J = 7.8, 1H, Hvinyl), 8.02 (d, J = 7.8, 1H, py), 7.89 (m, 1H, py), 7.46 (m, 1H, py), 4.68 (t, J = 1.8, 2H, C5H4), 4.57 (t, J = 1.8, 2H, C5H4), 4.19 (s, 5H, C5H5). 13C NMR (75.50 MHz, CDCl3): δ 188.7 (C[double bond, length as m-dash]O), 154.9 (CPy), 149.0 (CPy), 147.0 (Cvinyl), 137.0, 127.1, 123.1 (CPy), 117.9 (Cvinyl), 79.6 (C5H4), 71.7 (C5H4), 70.1 (C5H5), 68.8 (C5H4). Elemental analysis for C18H15FeNO (Mr = 317.16): calc.: C, 68.16%; H, 4.77%; N, 4.42%. Found: C 68.34%; H, 4.83%; N, 4.64%.

DSSC fabrication

Transparent conductive glass plates coated with F-doped SnO2 (FTO, purchased from Pilkington. Co. Ltd., 8 Ω/γ) were used to prepare both the photo- and counter-electrodes. Commercialized TiO2 paste (Ti-Nanoxide T, Solaronix) was casted onto heat-treated FTO substrates by the doctor-blade technique and then sintered at 450 °C for 30 min. The substrates with thin nanoporous TiO2 layers (∼6 μm) were dipped into a dichloromethane solution of dyes H-1–H-5 (1 × 10⁻⁵ M) and kept overnight. The unadsorbed dye was washed out with anhydrous ethanol. Pt-layered counter-electrodes were prepared using Pt catalyst (Solaronix), screen printed on FTO and then sintered at 400 °C for 30 min. The dye-sensitized TiO2 electrode and platinum coated counter electrodes were sandwiched to each other in a face-to-face manner leaving a space for contacts to connect with an external load. This sandwich type assembly was sealed from all sides by using a hot melt sealant/spacer and the electrolytic solution (an electrolyte composed of 0.6 M dimethylpropylimidazolium iodide (DMPII), 0.05 M I2, 0.1 M LiI and 0.5 M 4-tert-butylpyridine in acetonitrile) was injected through a predrilled hole in the counter electrode. Copper wires were fixed on both the electrodes using silver paste and Araldite to form an electrical contact. For thermal stability tests of N719 and H-2 a high boiling point solvent in electrolyte was used. The composition of electrolyte was 0.05 M iodine, 0.5 M LiI and 0.5 M 4-tert-butypyridine in propylene carbonate (bp 242 °C).

X-Ray crystallography

Intensity data for H-1, H-2 and H-3 were collected at 150(2) K on a Rigaku Xcalibur, EosS2 single-crystal diffractometer using graphite-monochromated Mo-Kα radiation (λ = 0.71073 Å). Unit cell determination, data collection and data reduction were performed using CrysAlisPro software.51 For all structures an empirical absorption correction using spherical harmonics was employed.51 The structures were solved by direct methods (SIR97)52 and refined by a full-matrix least-squares procedure based on F2 (Shelxl-2014).53 All non-hydrogen atoms were refined anisotropically. Hydrogen atoms were placed onto calculated positions and refined using a riding model.
Crystal data for H-1. C19H16FeO2, M = 332.17, monoclinic, space group P21/c, a = 11.7994(4) Å, b = 10.9413(3) Å, c = 11.2628(3) Å, β = 100.824(3)° V = 1428.17(7) Å3, Z = 4, Dc = 1.545 Mg m−3, F(000) = 688, crystal size 0.600 × 0.250 × 0.120 mm, reflections collected 18[thin space (1/6-em)]217, independent reflections 3529 [R(int) = 0.0334], final indices [I > 2σ(I)] R1 = 0.0309, wR2 = 0.0698, R indices (all data) R1 = 0.0388, wR2 = 0.0730, gof 1.062, largest difference peak and hole 0.385 and −0.288 e Å−3. CCDC no. 1480597.
Crystal data for H-2. C19H16FeO2, M = 332.17, monoclinic, space group P21/c, a = 11.1055(4) Å, b = 11.4922(3) Å, c = 11.4191(4) Å, β = 98.713(3)°, V = 1440.56(8) Å3, Z = 4, Dc = 1.532 Mg m−3, F(000) = 688, crystal size 0.400 × 0.300 × 0.200 mm, reflections collected 18[thin space (1/6-em)]403, independent reflections 3540 [R(int) = 0.0406], final indices [I > 2σ(I)] R1 = 0.0366, wR2 = 0.0821, R indices (all data) R1 = 0.0531, wR2 = 0.0894, gof 1.025, largest difference peak and hole 0.534 and −0.325 e Å−3. CCDC no. 1480596.
Crystal data for H-3. C19H16FeO2, M = 332.17, monoclinic, space group P21/c, a = 10.8724(3) Å, b = 11.7198(4) Å, c = 11.7222(4) Å, β = 104.078(3)°, V = 1448.81(8) Å3, Z = 4, Dc = 1.523 Mg m−3, F(000) = 688, crystal size 0.400 × 0.200 × 0.180 mm, reflections collected 12[thin space (1/6-em)]564, independent reflections 3534 [R(int) = 0.0277], final indices [I > 2σ(I)] R1 = 0.0321, wR2 = 0.0669, R indices (all data) R1 = 0.0417, wR2 = 0.0713, gof 1.052, largest difference peak and hole 0.344 and −0.325 e Å−3. CCDC no. 1480595.

Computational details

In order to ascertain the nature of the electronic transitions in the ferrocenyl chalcone compounds density functional theory (DFT) calculations were performed. Optimized molecular geometries were calculated using the B3LYP exchange–correlation functional.54,55 The MDF10 basis set for Fe and 6-31G** basis set for other atoms were used for geometry optimization. The optimized structures of the compounds were used for molecular orbital analyses as well as for the time-dependent density functional theory (TD-DFT) calculations using a polarised continuum model (PCM). The solvent parameters of dichloromethane was employed. All the calculations were performed using the Gaussian 09 programme.56 The TiO2 cluster (TiO2)30 + H-1–H-5 systems were optimized by using the 3-21G* basis set and initial geometry were taken from the relaxed geometry of (TiO2)30 cluster and H-1–H-5.

Author contributions

AK designed the scheme and performed the computation, RY performed the synthesis, GKK performed the crystallography, RC, AKS, SWG and SR performed the measurements. The manuscript was written through contributions of all authors. All authors have given approval to the final version of the manuscript.

Acknowledgements

AK and RC are grateful to the Department of Science and Technology, New Delhi for financial support.

Notes and references

  1. B. O’Regan and M. Grätzel, Nature, 1991, 353, 737–740 CrossRef .
  2. (a) A. Hagfeldt, G. Boschloo, L. C. Sun, L. Kloo and H. Pettersson, Chem. Rev., 2010, 110, 6595–6663 CrossRef CAS PubMed ; (b) B. Bozic-Weber, E. C. Constable and C. E. Housecroft, Coord. Chem. Rev., 2013, 257, 3089 CrossRef CAS .
  3. T. W. Hamann, R. A. Jensen, A. B. F. Martinson, H. Van Ryswyk and J. T. Hupp, Energy Environ. Sci., 2008, 1, 66–78 CAS .
  4. B. O’Regan, K. Walley, M. Juozapavicius, A. Anderson, F. Matar, T. Ghaddar, S. M. Zakeeruddin, C. Klein and J. R. Durrant, J. Am. Chem. Soc., 2009, 131, 3541–3548 CrossRef PubMed .
  5. F. Gao, Y. Wang, D. Shi, J. Zhang, M. Wang, X. Jing, R. Humphry-Baker, P. Wang, S. M. Zakeeruddin and M. Grätzel, J. Am. Chem. Soc., 2008, 130, 10720–10728 CrossRef CAS PubMed .
  6. D. Kuang, S. Ito, B. Wenger, C. Klein, J. E. Moser, R. Humphry-Baker, S. M. Zakeeruddin and M. Grätzel, J. Am. Chem. Soc., 2006, 128, 4146–4154 CrossRef CAS PubMed .
  7. M. K. Nazeeruddin, F. De Angelis, S. Fantacci, A. Selloni, G. Viscardi, P. Liska, S. Ito, B. Takeru and M. Grätzel, J. Am. Chem. Soc., 2005, 127, 16835–16847 CrossRef CAS PubMed .
  8. C. Y. Chen, M. Wang, J. Y. Li, N. Pootrakulchote, L. Alibabaei, C. H. Ngoc-le, J. D. Decoppet, J. H. Tsai, C. Grätzel, C. G. Wu, S. M. Zakeeruddin and M. Grätzel, ACS Nano, 2009, 3, 3103–3109 CrossRef CAS PubMed .
  9. Q. J. Yu, Y. Wang, Z. Yi, N. Zu, J. Zhang, M. Zhang and P. Wang, ACS Nano, 2010, 4, 6032–6038 CrossRef CAS PubMed .
  10. L. Han, A. Islam, H. Chen, C. Malapaka, B. Chiranjeevi, S. Zhang, S. Yang and M. Yanagida, Energy Environ. Sci., 2012, 5, 6057–6060 CAS .
  11. A. Yella, H. W. Lee, H. N. Tsao, C. Yi, A. K. Chandiran, M. K. Nazeeruddin, E. W. Diau, C. Y. Yeh, S. M. Zakeeruddin and M. Grätzel, Science, 2011, 334, 629–634 CrossRef CAS PubMed .
  12. L. L. Li and E. W. G. Diau, Chem. Soc. Rev., 2013, 42, 291–304 RSC .
  13. K. Kakiage, Y. Aoyama, T. Yano, K. Oya, J.-I. Fujisawa and M. Hanaya, Chem. Commun., 2015, 51, 15894–15897 RSC .
  14. Ferrocenes: Ligands, Materials and Biomolecules, ed. P. Stepnicka, John Wiley and Sons Ltd, 2008 Search PubMed .
  15. A. Hildebrandt, T. Ruffer, E. Erasmus, J. C. Swarts and H. Lang, Organometallics, 2010, 29, 4900–4905 CrossRef CAS .
  16. V. N. Nemykin, G. T. Rohde, C. D. Barrett, R. G. Hadt, C. Bizzarri, P. Galloni, B. Floris, I. Nowik, R. H. Herber, A. G. Marrani, R. Zanoni and N. M. Loim, J. Am. Chem. Soc., 2009, 131, 14969–14978 CrossRef CAS PubMed .
  17. A. Auger and J. C. Swarts, Organometallics, 2007, 26, 102–109 CrossRef CAS .
  18. J. Conradie, T. S. Cameron, M. A. S. Aquino, G. J. Lamprecht and J. C. Swarts, Inorg. Chim. Acta, 2005, 358, 2530–2542 CrossRef CAS .
  19. A. Auger, A. J. Muller and J. C. Swarts, Dalton Trans., 2007, 3623–3633 RSC .
  20. A. Kumar, R. Chauhan, K. C. Molloy, G. Kociok-Köhn, L. Bahadur and N. Singh, Chem.–Eur. J., 2010, 16, 4307 CrossRef CAS PubMed .
  21. V. Singh, R. Chauhan, A. N. Gupta, V. Kumar, M. G. B. Drew, L. Bahadur and N. Singh, Dalton Trans., 2014, 43, 4752–4761 RSC .
  22. R. Yadav, M. Trivedi, G. Kociok-Köhn, R. Chauhan, A. Kumar and S. W. Gosavi, Eur. J. Inorg. Chem., 2016, 1013–1021 CrossRef CAS .
  23. R. Chauhan, M. Trivedi, R. Yadav, A. Kumar, D. P. Amalnerkar and S. W. Gosavi, Spectrochim. Acta, Part A, 2015, 150, 652–656 CrossRef CAS PubMed .
  24. S. K. Singh, R. Chauhan, K. Diwan, M. G. B. Drew, L. Bahadur and N. Singh, J. Organomet. Chem., 2013, 745–746, 190–200 CrossRef CAS .
  25. V. Singh, R. Chauhan, A. Kumar, L. Bahadur and N. Singh, Dalton Trans., 2010, 39, 9779–9788 RSC .
  26. R. Chauhan, G. Kociok-Köhn, M. Trivedi, S. Singh, A. Kumar and D. P. Amalanerkar, J. Solid State Electrochem., 2015, 19, 739–747 CrossRef CAS .
  27. R. Chauhan, S. Auvinen, A. S. Aditya, M. Trivedi, R. Prasad, M. Alatalo, D. P. Amalnerkar and A. Kumar, Sol. Energy, 2014, 108, 560–569 CrossRef CAS .
  28. S. K. Singh, R. Chauhan, B. Singh, K. Diwan, G. Kociok-Köhn, L. Bahadur and N. Singh, Dalton Trans., 2012, 41, 1373–1380 RSC .
  29. R. Chauhan, M. Trivedi, L. Bahadur and A. Kumar, Chem.–Asian J., 2011, 6, 1525–1532 CrossRef CAS PubMed .
  30. R. Chauhan, M. Shahid, M. Trivedi, D. P. Amalnerkar and A. Kumar, Eur. J. Inorg. Chem., 2015, 3700–3707 CrossRef CAS .
  31. R. Misra, R. Maragani, K. R. Patel and G. D. Sharma, RSC Adv., 2014, 4, 34904–34911 RSC .
  32. D. Sirbu, C. Turta, A. C. Benniston, F. Abou-Chahine, H. Lemmetyinen, N. V. Tkachenko, C. Wood and E. Gibson, RSC Adv., 2014, 4, 22733–22742 RSC .
  33. M. Cariello, S. Ahn, K.-W. Park, S.-K. Chang, J. Hong and G. Cooke, RSC Adv., 2016, 6, 9132–9138 RSC .
  34. B. Delavaux-Nicot, J. Maynadie, D. Lavabre and S. Fery-Forgues, J. Organomet. Chem., 2007, 692, 874–886 CrossRef CAS .
  35. X. Wu, E. R. T. Tiekink, I. Kostetski, N. Kocherginsky, A. L. C. Tan, S. B. Khoo, P. Wilairat and M. L. Go, Eur. J. Pharm. Sci., 2006, 27, 175–187 CrossRef CAS PubMed .
  36. X. Wu, P. Wilairat and M. L. Go, Bioorg. Med. Chem. Lett., 2002, 12, 2299–2302 CrossRef CAS PubMed .
  37. Z. Ratković, Z. D. Juranić, T. Stanojković, D. Manojlović, R. D. Vukićević, N. Radulović and M. D. Joksović, Bioorg. Chem., 2010, 38, 26–32 CrossRef PubMed .
  38. M. F. R. Fouda, M. M. Abd-Elzaher, R. A. Abdelsamaia and A. A. Labib, Appl. Organomet. Chem., 2007, 21, 613–625 CrossRef CAS .
  39. Y. Jung, K. I. Son, Y. E. Oh and D. Y. Noh, Polyhedron, 2008, 27, 861–867 CrossRef CAS .
  40. E. Erasmus, Inorg. Chim. Acta, 2011, 378, 95–101 CrossRef CAS .
  41. R. A. Cardona, K. Hernández, L. E. Pedró, M. R. Otaño, I. Montes and A. R. Guadalupe, J. Electrochem. Soc., 2010, 157, F104–F110 CrossRef CAS .
  42. Y. S. Sohn, D. N. Hendrickson and H. B. Gray, J. Am. Chem. Soc., 1971, 93, 3603–3612 CrossRef CAS .
  43. (a) G. Janssens, F. Touhari, J. W. Gerritsen, H. V. Kempen, P. Callant, G. Deroover and D. Vandenbroucke, Chem. Phys. Lett., 2001, 344, 1–6 CrossRef CAS ; (b) C. Y. Lin, C. F. Lo, L. Luo, H. P. Lu, C. S. Hung and E. W. G. Diau, J. Phys. Chem., 2009, 113, 755–764 CAS .
  44. G. Boschloo, L. Häggman and A. Hagfeldt, J. Phys. Chem. B, 2006, 110, 13144–13150 CrossRef CAS PubMed .
  45. K. R. J. Thomas, Y.-C. Hsu, J. T. Lin, K.-M. Lee, K.-C. Ho, C.-H. Lai, Y.-M. Cheng and P.-T. Chou, Chem. Mater., 2008, 20, 1830–1840 CrossRef CAS .
  46. S. Ito, N.-L. Cevey-Ha, P. Liska, P. Comte, M. K. Nazeeruddin, P. Pechy, S. M. Zakeeruddin and M. Grätzel, Chem. Commun., 2006, 4004–4006 RSC .
  47. K. E. Naveen, R. Jose, P. S. Archana, C. Vijila, M. M. Yusoff and S. Ramakrishna, Energy Environ. Sci., 2012, 5, 5401–5407 Search PubMed .
  48. J. Bisquert, A. Zaban, M. Greenshtein and I. Mora-Seró, J. Am. Chem. Soc., 2004, 126, 13550–13559 CrossRef CAS PubMed .
  49. K. Fan, W. Zhang, T. Y. Peng, J. N. Chen and F. Yang, J. Phys. Chem. C, 2011, 115, 17213–17219 CAS .
  50. H. Yua, S. Q. Zhang, H. J. Zhao, G. Will and P. Liu, Electrochim. Acta, 2009, 54, 1319–1324 CrossRef .
  51. CrysAlisPro, Agilent Technologies, Version 1.171.37.35, release 13-08-2014 CrysAlis171.NET, compiled Aug 13 2014, 18:06:01 and CrysAlisPro 1.171.38.41 Rigaku OD, 2015.
  52. A. Altomare, M. C. Burla, M. Camalli, G. L. Cascarano, C. Giacovazzo, A. Guagliardi, A. G. G. Moliterni, G. Polidori and R. Spagna, J. Appl. Crystallogr., 1999, 32, 115–119 CrossRef CAS .
  53. G. M. Sheldrick, Acta Crystallogr., Sect. C: Struct. Chem., 2015, 71, 3–8 CrossRef PubMed .
  54. A. D. Becke, J. Chem. Phys., 1993, 98, 5648 CrossRef CAS .
  55. C. T. Lee, W. T. Yang and R. G. Parr, Phys. Rev. B: Condens. Matter Mater. Phys., 1998, 37, 1133 Search PubMed .
  56. M. J. Frisch, G. W. Trucks, H. B. Schlegel, G. E. Scuseria, M. A. Robb, J. R. Cheeseman, J. A. Montgomery, T. Vreven Jr, K. N. Kudin, J. C. Burant, J. M. Millam, S. S. Iyengar, J. Tomasi, V. Barone, B. Mennucci, M. Cossi, G. Scalmani, N. Rega, G. A. Petersson, H. Nakatsuji, M. Hada, M. Ehara, K. Toyota, R. Fukuda, J. Hasegawa, M. Ishida, T. Nakajima, Y. Honda, O. Kitao, H. Nakai, M. Klene, X. Li, J. E. Knox, H. P. Hratchian, J. B. Cross, V. Bakken, C. Adamo, J. Jaramillo, R. Gomperts, R. E. Stratmann, O. Yazyev, A. J. Austin, R. Cammi, C. Pomelli, J. W. Ochterski, P. Y. Ayala, K. Morokuma, G. A. Voth, P. Salvador, J. J. Dannenberg, V. G. Zakrzewski, S. Dapprich, A. D. Daniels, M. C. Strain, O. Farkas, D. K. Malick, A. D. Rabuck, K. Raghavachari, J. B. Foresman, J. V. Ortiz, Q. Cui, A. G. Baboul, S. Clifford, J. Cioslowski, B. B. Stefanov, G. Liu, A. Liashenko, P. Piskorz, I. Komaromi, R. L. Martin, D. J. Fox, T. Keith, M. A. Al-Laham, C. Y. Peng, A. Nanayakkara, M. Challacombe, P. M. W. Gill, B. Johnson, W. Chen, W. M. Wong, C. Gonzalez and J. A. Pople, Gaussian 09, revision B.01, Gaussian, Inc., Wallingford CT, 2009 Search PubMed .

Footnotes

Electronic supplementary information (ESI) available: Adsorption modes of the dyes on TiO2. CCDC 1480595–1480597. For ESI and crystallographic data in CIF or other electronic format see DOI: 10.1039/c6ra23034b
These authors contributed equally.

This journal is © The Royal Society of Chemistry 2016