DOI:
10.1039/C6RA23019A
(Paper)
RSC Adv., 2016,
6, 101048-101060
One-step solvothermal synthesis of Al-promoted Fe3O4 magnetic catalysts for the selective oxidation of benzyl alcohol to benzaldehyde with H2O2 in water†
Received
15th September 2016
, Accepted 18th October 2016
First published on 18th October 2016
Abstract
Aluminium (Al)-promoted Fe3O4 magnetic catalysts were prepared by in situ solvothermal synthesis in ethylene glycol and characterized by XRD, SEM, XPS, BET and VSM techniques. The Al promoter significantly enhanced the catalytic activity of Fe3O4 microspheres in the selective oxidation of benzyl alcohol to benzaldehyde with H2O2 in water (yield: 5.6% vs. 43.7% before and after the addition of 1.42 wt% of Al, respectively). The effects of Al source and content, catalyst loading, H2O2 dosage, reaction temperature and time on the catalytic performance of Al-promoted Fe3O4 were also investigated. The Al-promoted Fe3O4 catalysts were magnetically recoverable and reusable at least five times without loss of catalytic activity and selectivity after being rejuvenated with NaBH4 reduction. Theoretical and experimental investigations confirmed that the Al promoter introduced new Al active sites besides the primary iron (Fe) sites on the surface of Fe3O4 microspheres, facilitated the formation of Al–peroxo (Al–OOH) intermediates and reduced the apparent activation energy of the decomposition of H2O2 from 52.3 kJ mol−1 to 41.1 kJ mol−1. The synergistic effect between Fe and Al sites contributes to a much better catalytic activity of Al-promoted Fe3O4 as compared to pure Fe3O4, γ-Al2O3 or their physical mixtures as catalysts.
1. Introduction
Chlorine-free benzaldehyde (BzH) is in high demand in the perfumery and pharmaceutical industries.1–15 However, the conventional industrial process via hydrolysis of benzal chloride derived from toluene chlorination only produces BzH that contains chlorinated impurities. Therefore, selective oxidation of benzyl alcohol (BzOH) to BzH has attracted considerable attention as an alternative to produce chlorine-free BzH. Up to now, great efforts have been made to explore environmentally benign methods for this conversion.16 Among these, the iron (Fe)-catalyzed selective oxidation of BzOH to BzH with H2O2 in water over magnetic iron oxides such as magnetite (Fe3O4) and maghemite (γ-Fe2O3) (Scheme 1) is more appealing because of its many attractive advantages.13–16 Firstly, magnetic iron oxides are abundantly available, inexpensive, environmentally benign, easy to handle and magnetically separable. Secondly, H2O2 is a green oxidant, which has H2O as its only by-product. Thirdly, water is a green solvent. In the catalytic system of BzOH–H2O2–Fe3O4, H2O2 preferentially reacts with Fe2+ on the surface of Fe3O4 to generate hydroxyl radicals (˙OH) according to a Fenton-like reaction mechanism,17 which then selectively oxidizes BzOH to BzH. However, it remains a great challenge to improve the catalytic activity of conventional Fe3O4 catalysts to activate H2O2 for practical applications.
 |
| | Scheme 1 Selective oxidation of BzOH with H2O2 in water over Fe3O4. | |
The substitution of Fe with other transition metals was generally used to improve catalytic properties of Fe3O4 mainly due to the conjugation of redox pairs of iron species and imported active ions in the ˙OH production cycle.18 In contrast, modification of Fe3O4 by main group metals (e.g., aluminium (Al)) has been much less explored although Al-catalyzed selective oxidation of BzOH to BzH with H2O2 has also been reported in some papers.9,10,19 Since Al and Fe are the first and second richest metal elements in the Earth's crust, respectively, they usually coexist in natural oxide mineral deposits such as magnetite and bauxite. For example, up to 1.8 wt% of Al has been detected in natural magnetite.20,21 It is also well known that up to 4 wt% of Al2O3 (or 2.1 wt% of Al) has been added as promoter to stabilize industrial iron catalysts for ammonia synthesis.22 Therefore, it would be worthwhile to investigate the promotional effect of Al on catalytic properties of Fe3O4 in order to facilitate the practical catalytic application of natural magnetite or some commercial Fe3O4-based catalysts in the title reaction.
In the present work, Al-promoted Fe3O4 catalysts were prepared by in situ solvothermal synthesis in ethylene glycol (MEG). The Al promoter was found to significantly enhance the catalytic activity of Fe3O4 in the title reaction. Theoretical and experimental investigations confirmed that the Al promoter introduced new Al active sites, reduced the activation energy of H2O2 decomposition and facilitated the formation of ˙OH. The synergistic effect between Fe and Al active sites contributes to much better catalytic activity of Al-promoted Fe3O4 catalysts.
2. Experimental
2.1. Direct synthesis of Al-promoted Fe3O4 in MEG
In this work, different Al-promoted Fe3O4 particles were designated as Fe3O4-s-m, where s represents the Al source used (AIP for the saturated solution of aluminium isopropoxide in isopropanol, AC for AlCl3·6H2O, AN for Al(NO3)3·9H2O and AS for Al2(SO4)3·18H2O), and m indicates the Al content in weight percentage. For example, Fe3O4-AIP-1.42% represents Fe3O4 particles that were modified by using AIP as the aluminium source and had the Al content of 1.42 wt%.
A typical procedure to prepare Fe3O4-AIP-1.42% is as follows: FeCl3·6H2O (3.703 g) and NaOAc (3.601 g) were stirred in 9 mL of MEG at 50 °C for 0.5 h. Then 2 mL of AIP solution was added and stirred for another 0.5 h. The whole mixture was heated in a 60 mL Teflon-lined stainless steel autoclave at 198 °C for 24 h, and then quenched to room temperature. Black particles were recovered by magnetic separation, washed with ethanol and water, and air dried. All chemicals are analytical reagents from Sinopharm Chemical Reagent Co., Ltd.
A series of Fe3O4-AIP-m (m: 0.08–5.53 wt%) samples were prepared according to the same procedure except different volumes of AIP solution added (see detailed experimental conditions in Table S1 in ESI†). For comparison, pure Fe3O4 microspheres (Fe3O4-blank) were also prepared without the addition of an aluminium source.
2.2. Catalytic oxidation of BzOH with H2O2
In a typical procedure, BzOH (40 mmol, 4.1 mL), deionized water (8.0 mL), and catalyst (0.200 g) were added to a 50 mL two-neck flask and refluxed at 100 °C. The reaction was initiated by adding 4.0 mL (40 mmol) of H2O2 (30 wt% in water). After 0.5 h, another 4.0 mL (40 mmol) of H2O2 (30 wt% in water) was added (note that unless otherwise mentioned, the total volume of H2O2 was divided into two equal portions and the second portion was added half an hour later after the addition of the first). The reaction continued for another 1 h. Then the catalyst was separated from the mixture with a magnet. The product was extracted by ethyl acetate (10 mL), washed with saturated sodium thiosulfate solution (2 × 10 mL), and then analyzed by gas chromatography equipped with an AE·FFAP capillary column and a FID. The conversion of BzOH and yield of BzH were calculated as follows:
where n0,BzOH and ΔnBzOH are the initial and converted moles of BzOH, respectively, and nBzH is the produced moles of BzH.
2.3. Reactivation of the recovered Fe3O4-AIP-1.42% catalysts
After the reaction, the Fe3O4-AIP-1.42% catalyst was recovered with the assistance of a magnet and washed with ethanol (3 × 10 mL) and deionized water (3 × 10 mL). The recovered Fe3O4-AIP-1.42% was reactivated by reduction with 10 mL of NaBH4 (0.3 M) at 40 °C for 0.5–1 h and washed with deionized water to remove the remaining NaBH4. The catalytic performance of the recovered Fe3O4-AIP-1.42% in the oxidation of BzOH with H2O2 was then tested immediately after the reactivation treatment with NaBH4.
2.4. Characterization and analysis
XRD patterns were collected on Bruker D8 Advance Diffractometer with Cu Kα (0.15406 nm) radiation at 30 kV and 20 mA. SEM images were taken on a JEOL JSM-5510LV Scanning Electron Microscope. Typically the sizes of 100 particles were measured from the SEM images to make particle size distribution histograms. EDX patterns were performed on Horiba EMAX energy-dispersive X-ray spectrometer. XPS analyses were conducted on a Thermo Scientific K-Alpha XPS spectrometer in an ultrahigh vacuum, using a monochromatized Al Kα radiation (hν = 1486.6 eV) as the excitation source. All the binding energy (BE) values were calibrated by the C 1s peak of adventitious carbon at 284.6 eV. The Thermo Avantage v4.51 software was used to calculate the surface atomic ratio. Peak fitting was performed using XPS-PEAK software. Magnetic properties were investigated on a VSM JDAW-2000D vibrating sample magnetometer by sweeping the external field between ±6 kOe at room temperature. The concentration of H2O2 was analyzed by KMnO4 titration that has a detection limit of 1 × 10⁻⁴ M.23 The Fe3+/Fe2+ ratio in Fe3O4 particles and total dissolved iron in the aqueous solution were determined by the 1,10-phenanthroline spectrophotometric method.23–26 The total acid content of the catalyst was measured by standard acid–base titration as follows: 0.4 g catalyst was stirred in 20 mL NaOH standard solution (0.1 M) at 60 °C for 7 h. Then 1 mL supernatant was back-titrated with HCl (0.01 M) after being diluted by 5 mL deionized water.27
3. Results and discussion
3.1. Characterization of Al-promoted Fe3O4
During the investigation of catalytic performances of different Al-promoted Fe3O4 catalysts (see Section 3.2.1.), AIP was found to be the best aluminium source to make Al-promoted Fe3O4 with the highest catalytic activity. Therefore, only the characterization results of a series of Fe3O4-AIP samples were discussed in detail in the following parts. For comparison, Fe3O4-AC, Fe3O4-AN and Fe3O4-AS samples were also characterized by SEM and XRD. The SEM images and corresponding particle size distributions (Fig. S1 in the ESI†) show that spherical Fe3O4 particles with different sizes were synthesized with AlCl3·6H2O or Al(NO3)3·9H2O as the Al precursor (e.g., 0.32 ± 0.06 μm for Fe3O4-AC microspheres and 0.27 ± 0.06 μm for Fe3O4-AN microspheres). However, Fe3O4-AS microspheres synthesized with Al2(SO4)3·18H2O as the Al precursor had bimodal particle size distribution at 0.3 μm and 0.5 μm, respectively. In addition, particles in Fe3O4-AS are more aggregated than those in other Fe3O4 samples. Fe3O4-AC, Fe3O4-AN and Fe3O4-AS samples show similar XRD patterns (Fig. S2†). Besides the diffraction peaks of Fe3O4 (PDF no. 65-3107), five unidentified extra peaks have also been observed in these XRD patterns (as marked by asterisks in Fig. S2†) and indicate the presence of other crystalline phases as impurities in these Fe3O4 samples.
The XRD patterns of both Fe3O4-AIP-1.42% and Fe3O4-AIP-5.53% are similar to that of blank Fe3O4 particles (Fig. 1) and consistent with the standard data of magnetite (PDF no. 65-3107). It confirms that no phase transformation occurs during in situ Al-modification of Fe3O4. No peak related to the crystalline phase of aluminium oxides or (oxo)hydroxides (denoted as AlOx) is found in Fig. 1. It indicates the amorphous structure of AlOx in Fe3O4-AIP-m with the Al content of 1.42–5.53%, which also explains that the signal-to-background ratio of the XRD pattern of Fe3O4-AIP-m (m: 1.42% or 5.53%) gradually decreases as the Al content increases.
 |
| | Fig. 1 XRD patterns of blank and Al-modified Fe3O4. Shown at the bottom is the standard pattern of magnetite (PDF no. 65-3107). | |
The Al content and distribution in Fe3O4-AIP-m were measured by EDX analysis at different areas of the particles. As shown in Fig. 2 and Table 1, the Al element is uniformly distributed in Fe3O4-AIP-1.42%, and similar Al contents (1.25, 1.57, 1.36 and 1.50 wt%, respectively) were obtained by EDX analysis at four different areas. The uniform distribution of the Al element was also confirmed in other Fe3O4-AIP-m samples (see Fig. S3 and Table S2† for EDX analysis of Fe3O4-AIP-5.53%). Besides Fe, O and Al, EDX also detected 5.6 ± 2.6 wt% of C in some areas of Fe3O4-AIP-1.42%. The carbon source may be mainly from ethylene glycol or its derivatives (such as 2,3-diacetyl shown in eqn (1)) since considerable carbon content was even detected in Fe3O4-blank (6.17 ± 1.11%).28 C 1s XPS spectra revealed that carbon existed in the same chemical state in both samples, as manifested by a single peak at ca. 284.6 eV.
| |
 | (1) |
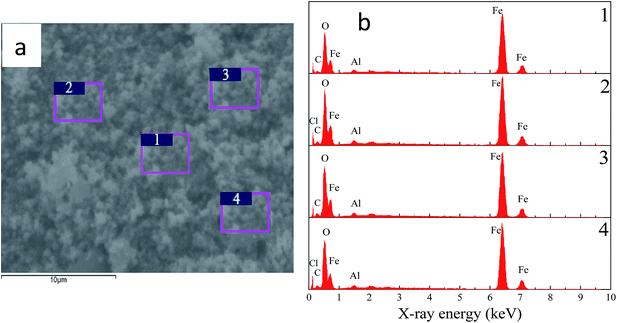 |
| | Fig. 2 EDX analysis of Fe3O4-AIP-1.42%. (a) Detection areas and (b) corresponding EDX spectra. | |
Table 1 EDX analysis of Fe3O4-AIP-1.42%
| Element |
Content (wt%) |
Average content (wt%) |
| Area 1 |
Area 2 |
Area 3 |
Area 4 |
| Fe |
47.96 |
50.28 |
46.47 |
56.41 |
50.28 |
| O |
42.87 |
43.11 |
44.11 |
40.15 |
42.56 |
| C |
7.92 |
4.81 |
8.07 |
1.64 |
5.61 |
| Al |
1.25 |
1.57 |
1.36 |
1.5 |
1.42 |
| Cl |
— |
0.23 |
— |
0.29 |
0.26 |
Some differences in the morphology and size between blank and Al-promoted Fe3O4 particles are observed in SEM images (Fig. 3). Fe3O4-blank particles mainly consist of discrete and uniform microspheres of 0.36 ± 0.08 μm in size (Fig. 3a and b). However, spherical particles in Fe3O4-AIP-m become a bit more aggregated than those in Fe3O4-blank (Fig. 3a, c and e). The particle sizes gradually reduce with the increase of the Al content (0.27 ± 0.06 μm for Fe3O4-AIP-1.42% and 0.17 ± 0.02 μm for Fe3O4-AIP-1.42%). The changes in the size and morphology after Al-modification are related to the presence of the surface AlOx layer on Al-promoted Fe3O4 (see XPS measurements below), which inhibits the particle growth on one hand but induces the aggregation of some particles like alumina adhesives on the other hand. As a result, there is no obvious change in the BET surface areas of Fe3O4 microspheres before and after modification by AlOx (31.0 vs. 31.3 m2 g−1).
 |
| | Fig. 3 SEM images and corresponding particle size distribution histograms. (a and b) For Fe3O4-blank, (c and d) for Fe3O4-AIP-1.42%, (e and f) for Fe3O4-AIP-5.53%. | |
XPS measurements were carried out to characterize the elemental composition and chemical states of the surface layer. XPS survey spectra confirm the presence of Fe, O and C in all three Fe3O4 particles (Fig. 4a). High resolution XPS spectra in the region of Fe 2p core level (Fig. 4b) indicate that the Fe 2p3/2 levels of three Fe3O4 particles have similar BE values of magnetite at ca. 710.8 eV.29,30 The Fe 2p3/2 BE of maghemite (γ-Fe2O3) or hematite (α-Fe2O3) is only 0.4 eV higher than that of magnetite, which may interfere with the assignment of the surface phase as magnetite. However, we do not observe a characteristic shake-up satellite of maghemite or hematite on these spectra, which should otherwise appear at ca. 8.0 eV above the Fe 2p3/2 peak (indicated by the arrow in Fig. 4b). The intensity of the shake-up satellite is originated predominantly from the coupling of the iron core-hole state with the valence band and has turned out to be a highly reliable indicator to distinguish the surface phase on iron oxides.29,30 Thus, the surface phase of the three Fe3O4 catalysts is still similar to their bulk magnetite phase. However, the major peak at ca. 56 eV in the Fe 3p spectra in Fig. 4c indicates that the chemical state of the surface Fe species is predominantly Fe3+ ions.31,32 The combination of Fe 2p and 3p spectra supports that the surface phase of the three Fe3O4 particles is non-stoichiometric magnetite with the large excess of Fe3+ ions.
 |
| | Fig. 4 XPS spectra of Fe3O4 before and after Al-modification. (a) Survey scan, (b) Fe 2p, (c) Fe 3p, (d) Al 2p and (e) O 1s. | |
As expected, no signal is observed for Fe3O4-blank in the energy range of Al 2p core-level (Fig. 4d). Due to very low Al content on the surface of Fe3O4-AIP-1.42%, its Al 2p signal is also too weak to be distinguished from the background. In contrast, a main peak appears in the Al 2p spectrum of Fe3O4-AIP-5.53% (Fig. 4d), which can be fitted into two peaks at 73.8 eV and 74.4 eV, respectively, and confirms the presence of the Al–O and Al–OH bonds in the AlOx surface layer.33 The surface Al/Fe atomic ratio (0.97) of Fe3O4-AIP-5.53% is appreciably higher than its bulk value (0.22 in Table S2†), which indicates that the Al species is significantly enriched on the surface of Fe3O4-AIP-5.53%. In other words, the Fe3O4-AIP-5.53% particles might be encapsulated with the Al species.
The O 1s spectrum (Fig. 4e) of blank Fe3O4 particles is deconvoluted to two components at 530.1 eV and 531.9 eV, respectively. The first peak at 530.1 eV is associated with the lattice oxygen (OL, O2−) of the surface magnetite phase. The second peak at 531.9 eV can be assigned to chemisorbed oxygen (Ochem), such as the surface hydroxyl group (Fe–OH).34–37 Besides the OL and Ochem species, the O 1s spectra of Fe3O4-AIP-1.42% and -5.53% contain a third weak peak at 533.1 eV, which may be associated with oxygen in chemisorbed water29,38 or AIP-derived C–O residues.35 The Ochem/OL ratios are respectively 1.28, 0.72 and 0.53 for Fe3O4-blank, Fe3O4-AIP-1.42% and Fe3O4-AIP-5.53%. It indicates that the amount of chemisorbed oxygen gradually decreases with the increase of the Al content. This may be due to the formation of new bridging Fe–O–Al groups by dehydration of surface hydroxyl groups, which also facilitates the immobilization of AlOx on the surface of Fe3O4 microspheres.
3.2. Catalytic properties of Al-promoted Fe3O4
3.2.1. Effects of the Al source and content. Four different Al sources, which are AIP, AlCl3·6H2O, Al(NO3)3·9H2O and Al2(SO4)3·18H2O, respectively, were employed to synthesize Al-promoted Fe3O4 according to the procedure described in Section 2.1. As presented in Fig. 5, all four Al-promoted Fe3O4 show significantly improved catalytic activities than pure Fe3O4 for the selective oxidation of BzOH to BzH with H2O2 in H2O in terms of the yield of BzH (5.6% vs. 28.2–43.7%). Among the four Al-promoted Fe3O4, Fe3O4-AIP exhibits the best catalytic performance (BzH yield: 43.7%). No conversion of BzOH was measured in the absence of a catalyst under the reaction conditions used in this study. Without the addition of H2O2, only 0.6% of BzOH was converted after refluxing at 100 °C for 1.5 h in the presence of Fe3O4-AIP-1.42%, which confirmed that the conversion of BzOH by reacting with O2 in the air was minimal under the current reaction conditions. The contribution of leached iron ions to the conversion of BzOH should be limited since only 5.7% of BzOH was converted in the presence of pure Fe3O4 catalyst under otherwise identical conditions (Fig. 5). In a separate experiment, 8.0 mL of H2O2 was added in one step in the presence of the Fe3O4-AIP-1.42% catalyst. After running the reaction at 100 °C for 40 min, the Fe3O4-AIP-1.42% solid catalyst was magnetically removed. The liquid phase was allowed to continuously react in the presence of the leached iron ions at 100 °C. After reacting for another 50 min, the BzH yield increased marginally from 10.8% to 14.5%, which further supports that the contribution of the soluble iron ions to the conversion of BzOH should be limited. In other control experiments performed in homogeneous solutions containing 2.2–4.2 mM of Fe3+ under otherwise similar reaction conditions (Caution: Bumping may occur when the H2O2 solution is dropwise added to the Fe3+ solution under refluxing with BzOH at 100 °C), the conversions of BzOH were measured at 26.8–33.9% with lower BzH selectivities (ca. 70%) due to over-oxidation of BzOH by H2O2 in the homogeneous catalytic system, which generates more benzoic acid and benzyl benzoate as major by-products.
 |
| | Fig. 5 Effect of different Al sources on catalytic performances of the resulting Al-promoted Fe3O4. The abbreviations of different Al sources were explained in Section 2.1. Reaction conditions: catalyst (0.200 g), BzOH (40 mmol), H2O2 (80 mmol, 8.0 mL, 30 wt%), water (8.0 mL), 100 °C, 1.5 h. | |
Next, a series of Fe3O4-AIP with varying Al content (0.08–5.53 wt%) were prepared and tested for catalytic activities (Fig. 6). Fig. 6 clearly reveals that the Al content of as low as 0.25 wt% significantly promotes the catalytic performance of Fe3O4 (BzH yield: 29.4% on Fe3O4-AIP-0.25% vs. 5.6% on Fe3O4-blank). However, the yield of BzH increases to a less extent or even decreases when further increasing the Al content (BzH yield: 34.8% on Fe3O4-AIP-5.53%). The optimized Al content is 1.42% (BzH yield: 43.7% on Fe3O4-AIP-1.42%). The effects of the residual carbon on the improved activity of Fe3O4-AIP-1.42% may not be significant since Fe3O4-blank with the compatible carbon content and same chemical state had much lower activity (BzOH conversion: 5.7% vs. 49.7%). As a result, Fe3O4-AIP-1.42% was selected in the following investigation.
 |
| | Fig. 6 Effect of the Al content on catalytic performances of Fe3O4-AIP. Reaction conditions: catalyst (0.200 g), BzOH (40 mmol), H2O2 (80 mmol, 8.0 mL, 30 wt%), water (8.0 mL), 100 °C, 1.5 h. | |
3.2.2. Effects of reaction parameters. Four reaction parameters, including catalyst loading, H2O2 dosage, reaction temperature and time, were investigated to optimize the catalytic performance of Fe3O4-AIP-1.42%. As shown in Fig. 7a, the optimal loading of Fe3O4-AIP-1.42% is 0.200 g under otherwise identical conditions (BzH yield: 43.7%). Lower loading of Fe3O4-AIP-1.42% cannot effectively catalyze the decomposition of H2O2; on the other hand, higher loading of Fe3O4-AIP-1.42% leads to quicker generation of ˙OH via the decomposition of H2O2, which cannot be effectively used for the oxidation of BzOH to BzH. Similarly, the dosage of H2O2 has to be optimized. As shown in Fig. 7b, the BzOH conversion is lower when less amount of H2O2 was added, e.g., 23.6% when the molar ratio of H2O2 to BzOH (denoted as n(H2O2)/n(BzOH)) is 1. The BzOH conversion increased as the n(H2O2)/n(BzOH) value increased but the selectivity to BzH decreased (e.g., conversion and selectivity are 67.9% and 78.3%, respectively, as n(H2O2)/n(BzOH) increases to 3). As a result, the obtained product contains more benzoic acid as a major by-product when n(H2O2)/n(BzOH) increases. Therefore, the optimal molar ratio of H2O2 to BzOH is chosen to be 2.
 |
| | Fig. 7 Effects of reaction parameters on catalytic performance of Fe3O4-AIP-1.42%. (a) Catalyst loading, (b) H2O2 dosage, (c) reaction temperature and (d) time. The amount of catalyst, BzOH and H2O2 in 8.0 mL water and the reaction temperature and time are respectively 0.2 g, 40 mmol, 80 mmol, 100 °C and 1.5 h, if not changed. Benzoic acid was detected as the major by-product. | |
Reaction temperature has a dramatic effect on the catalytic performance of Fe3O4-AIP-1.42%. As shown in Fig. 7c, as the reaction temperature reduces from 100 °C to 60 °C, the conversion of BzOH and yield of BzH decrease dramatically (e.g., only 2.1% yield achieved at 60 °C).
To investigate the effect of reaction time, 8 mL of H2O2 (30 wt%) was added in one step, instead of in two steps as described in Section 2.2. It should be noted that the addition of H2O2 in one step leads to the reduction in the BzOH conversion and BzH yield as compared to the two-step addition (conversion: 38.2% vs. 49.7%; yield: 34.6% vs. 43.7%). The reaction shows a sigmoid curve with time, as shown in Fig. 7d. There is an induction period at the initial stage (ca. 0.5 h) of the reaction. The reaction rate is slow during this period (BzOH conversion is only 6.5% at 0.5 h). The reaction accelerates between 0.5 h and 1 h (BzOH conversion is 37.8% at 1 h). Thereafter, the reaction rate tapers off (BzOH conversion is 38.2% at 1.5 h) due to the lack of H2O2 in the system (the concentration of H2O2 is only 0.029 wt% at 1.5 h, as indirectly titrated by Na2S2O3 standard solution with I2-starch as indicator).
Catalytic performances of different catalysts for the selective oxidation of BzOH to BzH with H2O2 in water or without solvent are compared in Table 2. As shown in entries 1–6, the overall catalytic performance of Fe3O4-AIP-1.42% is comparable to or better than those of other magnetic iron oxides reported in the literature.13,15 However, in terms of the BzH yield, it is still lower than those of other homogeneous (e.g., CuSO4 in entry 13) or heterogeneous catalysts with larger surface areas (e.g., zeolites ZSM-5 and TS-1 in entries 11–12 and supported iron, Cr(salen) and gold catalysts in entries 7–10). The lower activity of Fe3O4-AIP-1.42% may be related to its smaller surface area (31 m2 g−1), which limits the amount of accessible surface active sites.
Table 2 Best performances of BzOH oxidation to BzH with H2O2 in water or without solvent achieved over different catalysts
| Entry |
Catalyst |
Conversion (%) |
Yield (%) |
Selectivity (%) |
Recyclability (cycles) |
Ref. |
| 1 |
Fe3O4-AIP-1.42% |
49.7 |
43.7 |
87.8 |
5 |
This work |
| 2 |
Fe3O4-ECH-D |
36.6 |
34.2 |
93.5 |
5 |
16 |
| 3 |
Fe3O4-L |
17.4–53.4 |
13.3–47.3 |
76–88 |
NA |
15 |
| 4 |
γ-Fe2O3-L |
16.3–45.4 |
12.5–39.5 |
77–88 |
NA |
15 |
| 5 |
γ-Fe2O3 (50 nm) |
33 |
32 |
97 |
5 |
13 |
| 6 |
γ-Fe2O3 (3–5 nm) |
85.7 |
30 |
35 |
NA |
13 |
| 7 |
Fe/PICU |
52.5 |
51.5 |
98 |
8 |
3 |
| 8 |
Cr(salen)–MCM-41(CH3)3 |
65 |
65 |
100 |
NA |
1 |
| 9 |
Au/γ-Al2O3 |
44.5 |
56.1 |
25.0 |
3 |
12 |
| 10 |
Au/TS-1 |
67 |
56 |
84 |
5 |
11 |
| 11 |
TS-1 |
89.6 |
65.9 |
73.5 |
NA |
39 |
| 12 |
ZSM-5 |
53–59 |
45 |
71–86 |
6 |
9 and 10 |
| 13 |
CuSO4 |
98 |
69.6 |
71 |
3 |
2 |
3.2.3. Stability and recyclability of Fe3O4-AIP-1.42%. Fe3O4-AIP-1.42% exhibits favorable magnetic properties. Its magnetization curve at room temperature is shown in Fig. 8. It has large saturated magnetization (92.1 emu g−1) and small remanent magnetization (5.3 emu g−1) and coercivity (35.6 Oe). These magnetic properties are suitable for magnetic separation with a magnet while avoiding aggregation after removal of the applied magnetic field.
 |
| | Fig. 8 Room-temperature magnetization curve of Fe3O4-AIP-1.42%. Inset is the enlargement near the origin. | |
The XRD pattern and SEM image (Fig. S4†) of the magnetically recovered Fe3O4-AIP-1.42% catalyst after the first run reveal no obvious change in the crystal structure and particle morphology after the reaction, and confirm its structural stability under the current reaction conditions. However, the activity of the recovered Fe3O4-AIP-1.42% catalyst obviously decreases (BzH yield: 19.2%). It has been reported that the Fe2+ content of Fe3O4 has a significant impact on its catalytic activity, i.e., the higher the Fe2+ content, the higher the activity.17 The Fe3+/Fe2+ molar ratios in the fresh Fe3O4-AIP-1.42% particles and those recovered after the first run were determined to be 3.10 and 6.87, respectively. It indicates the oxidation of Fe2+ ions during the oxidation of BzOH with H2O2, leading to lower Fe2+ content on the surface of the recovered Fe3O4-AIP-1.42%. The over-presentation of Fe3+ ions on the surface requires more H2O2 and longer reaction time to regenerate enough active Fe2+ species for the oxidation of BzOH with H2O2, both of which may not be fulfilled under our current reaction conditions (see Section 2.2.), which explains low activity of the recovered Fe3O4-AIP-1.42%. Therefore, the recovered Fe3O4-AIP-1.42% was reactivated by reduction with 10 mL of NaBH4 (0.3 M) at 40 °C for 0.5–1 h. The catalytic performance of the recovered Fe3O4-AIP-1.42% after the reactivation was shown in Fig. 9, which supports the good recyclability of Fe3O4-AIP-1.42%. It is noticed in Fig. 9 that the BzH yield was lower at the third cycle. This may be due to the shorter reduction time (usually 0.5–1 h) during the reactivation treatment with NaBH4 of the second recovered Fe3O4-AIP-1.42%, which may not be enough to regenerate the surface Fe2+ ions, or because the re-oxidation of surface Fe2+ ions during the storage and handling after the reactivation treatment with NaBH4 (please note that the catalytic performances of the recovered Fe3O4-AIP-1.42% were usually tested immediately after the reactivation treatment with NaBH4, but the reactivated Fe3O4-AIP-1.42% at the third cycle has been exposed to the air for some time before the catalytic test). However, the stabile activity and selectivity of the recovered Fe3O4-AIP-1.42% were still achieved by careful control of experimental conditions during the reactivation treatment by NaBH4, as shown at the fourth and fifth cycles (BzH yield: ca. 42%). It also can be seen in Table 2 that the recyclability of Fe3O4-AIP-1.42%, which is stable and reusable for at least 5 cycles without obvious reduction in activity and selectivity, is compatible to or better than those of reported catalysts under similar reaction conditions.
 |
| | Fig. 9 Recyclability of Fe3O4-AIP-1.42%. The recovered catalysts were reactivated by NaBH4 reduction before reuse. | |
3.3. Catalytic decomposition of H2O2
It is clear that modification by AlOx significantly improves the catalytic activity of Fe3O4 microspheres. This is probably due to the enhancing effect of modification by AlOx on Fe3O4-catalyzed decomposition of H2O2. To verify this hypothesis, the mixture of 20 mL of H2O2 (6 wt%) and 0.2 g of catalyst was refluxed at 100 °C. At given intervals, aliquots (0.5 mL) were sampled to analyze the concentration of H2O2 by KMnO4 titration. As shown in Fig. 10a, H2O2 was stable after 1.5 h without a catalyst. In contrast, ca. 50% and 90% of the initial amount of H2O2 were decomposed after 0.5 h on Fe3O4-blank and Fe3O4-AIP-1.42%, respectively, which confirms that modification by AlOx enhances the decomposition of H2O2 on Fe3O4.
 |
| | Fig. 10 Catalytic decomposition of H2O2 on Fe3O4-blank and Fe3O4-AIP-1.42%. (a) Plots of Ct/C0 versus time and (b) plots of ln(C0/Ct) versus time. | |
Additional experiments were conducted at 60 °C, 70 °C and 80 °C to determine the apparent activation energy, Ea, of catalytic decomposition of H2O2 on blank and Fe3O4-AIP-1.42% microspheres, and the results were also included in Fig. 10a. The decomposition of H2O2 was fitted to a first-order kinetic model by plotting ln(C0/Ct) versus time (Fig. 10b), and very good linear regression was generally observed (correlation efficient: 0.957–0.999, Table 3). This is in agreement with the first-order reaction kinetics reported earlier for the decomposition of H2O2 on iron oxides.23,40 The first-order rate constant, k1, was thus obtained from the slope of the regression line. As seen in Table 3, k1 increases as the temperature increases. According to the Arrhenius equation, k = A![[thin space (1/6-em)]](https://www.rsc.org/images/entities/char_2009.gif) exp(−Ea/RT), the values of A and Ea are obtained by plotting lnk1 versus 1/T (Fig. 11). As shown in Table 4, very good linear regression of lnk1–1/T was obtained for both blank and Fe3O4-AIP-1.42% microspheres (regression coefficients are 0.995 and 0.999, respectively). The pre-exponential factor, A, for blank Fe3O4 microspheres (3.25 × 10⁷ h−1) is about 10 times larger than that for Fe3O4-AIP-1.42% (2.70 × 10⁶ h−1), which indicates that the collision frequency between H2O2 and the surface of Fe3O4-AIP-1.42% is decreased upon the modification by AlOx. However, the Ea value of the decomposition of H2O2 on Fe3O4-AIP-1.42% (41.1 kJ mol−1) is obviously smaller than that on blank Fe3O4 (52.3 kJ mol−1), which suggests that modification by AlOx introduces new active sites on the surface of Fe3O4-AIP-1.42%. The smaller Ea value of Fe3O4-AIP-1.42% contributes to its higher activity than blank Fe3O4 in spite of the smaller A value of the former. It should be noted that both Ea values are much lower than the bond dissociation energy of H2O2 (213.8 kJ mol−1)41 due to the catalytic effect of Fe3O4.
exp(−Ea/RT), the values of A and Ea are obtained by plotting lnk1 versus 1/T (Fig. 11). As shown in Table 4, very good linear regression of lnk1–1/T was obtained for both blank and Fe3O4-AIP-1.42% microspheres (regression coefficients are 0.995 and 0.999, respectively). The pre-exponential factor, A, for blank Fe3O4 microspheres (3.25 × 10⁷ h−1) is about 10 times larger than that for Fe3O4-AIP-1.42% (2.70 × 10⁶ h−1), which indicates that the collision frequency between H2O2 and the surface of Fe3O4-AIP-1.42% is decreased upon the modification by AlOx. However, the Ea value of the decomposition of H2O2 on Fe3O4-AIP-1.42% (41.1 kJ mol−1) is obviously smaller than that on blank Fe3O4 (52.3 kJ mol−1), which suggests that modification by AlOx introduces new active sites on the surface of Fe3O4-AIP-1.42%. The smaller Ea value of Fe3O4-AIP-1.42% contributes to its higher activity than blank Fe3O4 in spite of the smaller A value of the former. It should be noted that both Ea values are much lower than the bond dissociation energy of H2O2 (213.8 kJ mol−1)41 due to the catalytic effect of Fe3O4.
Table 3 Linear regression of first-order kinetics of the decomposition of H2O2 at 60–100 °C
| Catalyst |
Decomposition temperature (°C) |
y = a + bx (R2) |
k1 (h−1) |
| Fe3O4-AIP-1.42% |
100 |
y = 4.605x − 0.138(0.979) |
4.605 |
| 80 |
y = 2.212x − 0.070 (0.993) |
2.212 |
| 70 |
y = 1.504x − 0.037 (0.995) |
1.504 |
| 60 |
y = 0.926x − 0.010 (0.999) |
0.926 |
| Fe3O4-blank |
100 |
y = 1.463x − 0.054 (0.996) |
1.463 |
| 80 |
y = 0.627x − 0.019 (0.998) |
0.627 |
| 70 |
y = 0.365x − 0.005 (0.999) |
0.365 |
| 60 |
y = 0.190x − 0.003 (0.957) |
0.190 |
 |
| | Fig. 11 Arrhenius plots of H2O2 decomposition on Fe3O4-blank and Fe3O4-AIP-1.42%. | |
Table 4 Linear regression of Arrhenius plots of the decomposition of H2O2 on Fe3O4 catalysts 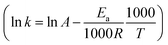
| Catalyst |
y = a + bx (R2) |
A (h−1) |
Ea (kJ mol−1) |
| Fe3O4-AIP-1.42% |
y = 14.791 − 4.945x (0.999) |
2.70 × 10⁶ |
41.1 |
| Fe3O4-blank |
y = 17.297 − 6.296x (0.995) |
3.25 × 10⁷ |
52.3 |
3.4. Discussion about the reaction mechanism
Iron-catalyzed decomposition of H2O2 for in situ generation of ˙OH has been extensively developed as advanced oxidation processes for environmental applications.42,43 The activation of H2O2 on iron is generally accepted via a complex redox reaction sequence (eqn (2) and (3)). It is remarkable that the reaction rate between Fe3+ and H2O2 is at least three orders of magnitude slower than that between Fe2+ and H2O2. Since the Fe 3p and 2p XPS spectra show that iron exists mainly as Fe3+ on the surface of Fe3O4-AIP-1.42%, the initial induction period (ca. 0.5 h) in the oxidation of BzOH with H2O2 (Fig. 7d) is related to the generation of the active Fe2+ species by slow reduction of Fe3+ with H2O2.18| | |
Fe2+ + H2O2 → Fe3+ + ˙OH + OH− (k = 63–76 M−1 s−1)
| (2) |
| | |
Fe3+ + H2O2 → Fe2+ + H+ + HO2˙ (k = 0.001–0.01 M−1 s−1)
| (3) |
Kinetic study revealed that modification by AlOx reduces the Ea value of the decomposition of H2O2 from 52.3 kJ mol−1 to 41.1 kJ mol−1, which implies that the formation of new active sites on the surface of Fe3O4-AIP-1.42%. Al-catalyzed oxidation of BzOH to BzH with H2O2 has been reported in the literature.9,19,44 Unlike the case of iron with both Fe2+ and Fe3+ states, aluminium has no multiple oxidation states. It is not possible to achieve electron transfer reactions between Al3+ and H2O2. The active intermediate in Al-catalyzed oxidation with H2O2 was believed to be Al peroxo complex (Al–OOH).9,10 However, there has been no direct evidence so far to support the formation of active Al–OOH intermediates. Therefore, theoretical calculations were performed according to density functional theory (DFT) at the B3LYP/6-31+G(d,p) level to show the feasibility of the formation of the Al–OOH active intermediate via the interaction of the Al-containing species and H2O2.
To build the initial molecular model for the Al-containing species, the acidity and coordination state were considered. The total acid content of Fe3O4-AIP-1.42% was determined to be 405 μmol g−1 by the acid–base titration, which is about four times that of Fe3O4-blank (110 μmol g−1) and indicates the existence of the Al–OH group on the surface. The Al species usually exist in four- or six-coordinated state. The chemical state of Al in solid particles is usually determined by magic angle spinning nuclear magnetic resonance spectroscopy. However, this technique is not applicable to Al-promoted Fe3O4 microspheres due to their magnetic properties. Therefore, two molecular models, [Al(OH)(H2O)3]2+ (1A) and [Al(OH)(H2O)5]2+ (2A), were respectively adopted to simulate the initial Al-containing species.
In Fig. 12, molecular models of [Al(OH)(H2O)3]2+ (1A), [Al(OH)(H2O)5]2+ (2A), H2O2 (B), [Al(OH)(H2O2)(H2O)3]2+ (1C), [Al(OH)(H2O2)(H2O)4⋯H2O]2+ (2C), [Al(OOH)(H2O)3⋯H2O]2+ (1D) and [Al(OOH)(H2O)5⋯H2O]2+ (2D) were respectively optimized with their energies calculated in their ground states (i.e., spin multiplicity s = 1 and overall charge q = 0 for H2O2 or +2 for the Al-containing species). It is clear from the energy diagrams in Fig. 12 that the interaction between 1A or 2A with H2O2 leads to the formation of the most stable 1D or 2D via intramolecular transformation (possibly involving hydrogen [1,3]-sigmatropic rearrangement) of the intermediate 1C or 2C, respectively (eqn (4) and (5)). The intermediate 1C is a five-coordinated Al species, and its formation from 1A and B is preferred over the formation of 2C from 2A and B by ca. 11 kJ mol−1. The O–O bond lengths in both intermediates 1C and 2C are very close to the initial value in H2O2 (1.457 Å in Table 5). Therefore, H2O2 has not been activated in 1C and 2C due to weak interaction between the Al center and the peroxo group (–![[O with combining low line]](https://www.rsc.org/images/entities/char_004f_0332.gif) OH), as indicated by the long bond lengths of Al–OH (1.985 Å and 2.074 Å, respectively). In contrast, stronger interaction between Al and –OH is expected in 1D as manifested by its shorter bond length (1.741 Å), which stretches the O–O bond length to 1.525 Å in 1D and is beneficial for its dissociation to form ˙OH. In comparison, the increase in the O–O bond length (1.475 Å) is marginal in 2D as the bond length of Al–OH (1.801 Å) is still too long due to the steric hindrance of other five water ligands. It indicates that the four-coordinated configuration of 1A is a better structural model for the Al active sites. This is in agreement with the suggestion in the literature that the Al Lewis acid site predominantly reacts with H2O2 to form the Al–OOH complex.9,10 It is noteworthy that one outer-sphere water ligand in model 1D, 2C or 2D is linked to one inner-sphere water ligand via strong hydrogen bond (111–152 kJ mol−1). DFT calculations show that it is thermodynamically unfavorable to form [Al(OOH)(H2O)3]2+, [Al(OH)(H2O2)(H2O)4]2+ or [Al(OOH)(H2O)5]2+ by dissociation of the outer-sphere water ligand (Fig. S5†). Since both 1D and 2D contain the Al–OOH active species, it is reasonable to assume Al as the second type of active sites on the surface of Al-promoted Fe3O4 catalysts.
OH), as indicated by the long bond lengths of Al–OH (1.985 Å and 2.074 Å, respectively). In contrast, stronger interaction between Al and –OH is expected in 1D as manifested by its shorter bond length (1.741 Å), which stretches the O–O bond length to 1.525 Å in 1D and is beneficial for its dissociation to form ˙OH. In comparison, the increase in the O–O bond length (1.475 Å) is marginal in 2D as the bond length of Al–OH (1.801 Å) is still too long due to the steric hindrance of other five water ligands. It indicates that the four-coordinated configuration of 1A is a better structural model for the Al active sites. This is in agreement with the suggestion in the literature that the Al Lewis acid site predominantly reacts with H2O2 to form the Al–OOH complex.9,10 It is noteworthy that one outer-sphere water ligand in model 1D, 2C or 2D is linked to one inner-sphere water ligand via strong hydrogen bond (111–152 kJ mol−1). DFT calculations show that it is thermodynamically unfavorable to form [Al(OOH)(H2O)3]2+, [Al(OH)(H2O2)(H2O)4]2+ or [Al(OOH)(H2O)5]2+ by dissociation of the outer-sphere water ligand (Fig. S5†). Since both 1D and 2D contain the Al–OOH active species, it is reasonable to assume Al as the second type of active sites on the surface of Al-promoted Fe3O4 catalysts.
| |
 | (4) |
| |
 | (5) |
 |
| | Fig. 12 Energy diagrams calculated at B3LYP/6-31+G(d,p) level by DFT. (a) Formation of [Al(OOH)(H2O)3⋯H2O]2+ (1D) by interaction between [Al(OH)(H2O)3]2+ (1A) and H2O2 (B); (b) formation of [Al(OOH)(H2O)5⋯H2O]2+ (2D) by interaction between [Al(OH)(H2O)5]2+ (2A) and H2O2 (B). | |
Table 5 Typical theoretical structural data in Al–OOH complexes
| Model |
1C |
1D |
2C |
2D |
| O–O bond length in H2O2: 1.457 Å. |
| O–O length (Å)a |
1.452 |
1.525 |
1.454 |
1.475 |
| Al–OH length (Å) |
1.985 |
1.741 |
2.074 |
1.801 |
| H-Bond length (Å) |
— |
2.413 |
2.529 |
2.495 |
| H-Bond energy (kJ mol−1) |
— |
152.02 |
109.87 |
111.10 |
| H-Bond angle (°) |
— |
176.9 |
177.4 |
177.3 |
The significantly improved catalytic activity of Al-promoted Fe3O4 catalysts should be attributed to the synergistic effect between Fe and Al active sites. Very low conversions of BzOH (0.7–5.7%) were obtained by using pure Fe3O4 or γ-Al2O3 as catalysts (entries 2 and 3 in Table 6). The moderate conversions of BzOH over physical mixtures of Fe3O4 and γ-Al2O3 with mass ratio of 1–50 (16.3–18.0% in entries 5–7) are about 3 times the sum (6.4%) of the BzOH conversions over pure Fe3O4 and γ-Al2O3, but still much smaller than that (49.7% in entry 1) achieved over Fe3O4-AIP-1.42%. This indicates the stronger synergistic effect in Fe3O4-AIP-1.42% than in physical mixtures of Fe3O4 and γ-Al2O3 due to in situ modification of Fe3O4 by AlOx. The Fe and Al active sites are in intimate contact in Fe3O4-AIP-1.42% via the bridging Fe–O–Al groups (Fig. 4e), which were believed to lead to the synergistic effect between Al and Fe.45 It was also found that the catalytic activities of Al-promoted Fe3O4 catalysts were dependent on the Al content (e.g., BzH yield: 43.7% over Fe3O4-AIP-1.42% vs. 34.8% over Fe3O4-AIP-5.53% in Fig. 6). The XPS measurements revealed that the Fe3O4-AIP-5.53% particles might be encapsulated with the Al species. Its lower activity could be due to excessive surface Al species, which limits the accessibility of the Fe sites. Therefore, the synergistic effect in Al-promoted Fe3O4 is a delicate balance between both metal sites. It demonstrates that slight changes in the surface composition or structure of catalytic materials can have large impacts on the products and energetics of the chemical reaction.46
Table 6 Catalytic performances of Fe3O4, γ-Al2O3 and their physical mixturesa
| Entry |
Catalyst |
Conversion (%) |
Yield (%) |
Selectivity (%) |
| Reaction conditions: catalyst (0.200 g), BzOH (40 mmol), H2O2 (80 mmol, 8.0 mL, 30 wt%), water (8.0 mL), 100 °C, 1.5 h. For comparison, the catalytic results of Fe3O4-AIP-1.42% were also included. γ-Al2O3 was prepared by calcination of pseudoboehmite in a muffle furnace at 600 °C for 2 h. The calcination temperature was increased from room temperature to 600 °C at a ramp rate of 5 °C min−1. The values in the parentheses indicate the mass ratios of Fe3O4 to γ-Al2O3. |
| 1 |
Fe3O4-AIP-1.42% |
49.7 |
43.7 |
87.8 |
| 2 |
Pure Fe3O4 |
5.7 |
5.6 |
98.8 |
| 3 |
Pure γ-Al2O3b |
0.7 |
0.7 |
100 |
| 4 |
Fe3O4 + γ-Al2O3 (1:10)c |
2.4 |
2.4 |
99.2 |
| 5 |
Fe3O4 + γ-Al2O3 (1:1) |
16.9 |
16.7 |
98.9 |
| 6 |
Fe3O4 + γ-Al2O3 (10:1) |
18.0 |
18.0 |
100 |
| 7 |
Fe3O4 + γ-Al2O3 (50:1) |
16.3 |
16.3 |
100 |
The reaction mechanism of Al-promoted Fe3O4 catalysts was proposed as Scheme 2. The initiate state of the catalyst mainly contains Fe3+ and Al–OH groups. After the induction period (about 0.5 h), the active species, Fe2+ and Al–OOH, are formed via the interaction with H2O2. BzOH interacts with Al–OOH to form an active surface complex with a five-membered ring,10 and H2O2 is decomposed at the adjacent Fe2+ site to generate ˙OH radicals. Surface-bonded BzOH is then selectively oxidized to BzH via simultaneous abstraction of two hydrogen atoms, one from the methylene group (PhC![[H with combining low line]](https://www.rsc.org/images/entities/char_0048_0332.gif) 2OH) by ˙OH radicals and the other from the hydroxyl group (PhCH2O) by Al–OOH. It is in this step that the synergistic effect between Fe and Al active sites may be involved. The catalytic cycle completes after the BzH desorption, which restores the initial state of the catalyst surface.
2OH) by ˙OH radicals and the other from the hydroxyl group (PhCH2O) by Al–OOH. It is in this step that the synergistic effect between Fe and Al active sites may be involved. The catalytic cycle completes after the BzH desorption, which restores the initial state of the catalyst surface.
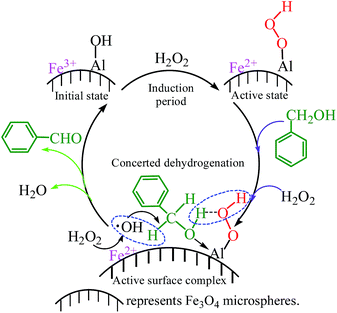 |
| | Scheme 2 The proposed reaction mechanism over Al-promoted Fe3O4 catalysts. | |
4. Conclusion
Al-promoted Fe3O4 magnetic catalysts with significantly enhanced catalytic properties were successfully prepared by in situ solvothermal synthesis in ethylene glycol and applied in the selective oxidation of benzyl alcohol to benzaldehyde with H2O2 in water. Theoretical and experimental investigations confirmed that the Al-modification introduced new Al active sites besides the primary Fe active sites on the surface of Fe3O4 microspheres, which led to the formation of Al–peroxo intermediates and reduced the apparent activation energy of the decomposition of H2O2 from 52.3 kJ mol−1 to 41.1 kJ mol−1. The synergistic effect between two metal sites contributes to much better catalytic activity of Al-promoted Fe3O4 as compared to γ-Al2O3, Fe3O4 or their physical mixtures as catalysts. The findings in this work could facilitate the direct application of natural magnetite as magnetic catalysts, or help the technology transfer of some existing Fe3O4-based catalysts (e.g., industrial iron catalysts for ammonia synthesis) for the selective oxidation of organic compounds with H2O2.
Acknowledgements
This work was supported by National Natural Science Foundation of China (No. 21571146) and Department of Education of Hubei Province (Project T201606 for Science and Technology Innovation Team of Outstanding Young and Middle-aged Scientists). We thank Dr Chuntao Zhang and Dr Congyun Shi from Wuhan University of Science and Technology for their assistance in DFT calculations.
References
- X. Wang, G. Wu, J. Li, N. Zhao, W. Wei and Y. Sun, Catal. Lett., 2007, 119, 87–94 CrossRef CAS.
- J. U. Ahmad, M. T. Räisänen, M. Leskelä and T. Repo, Appl. Catal., A, 2012, 411–412, 180–187 CrossRef CAS.
- Y. Zhang, S. N. Riduan and J. Y. Ying, Chem.–Eur. J., 2009, 15, 1077–1081 CrossRef CAS PubMed.
- C. Ragupathi, J. Judith Vijaya, R. Thinesh Kumar and L. John Kennedy, J. Mol. Struct., 2015, 1079, 182–188 CrossRef CAS.
- V. Mahdavi, H. R. Hasheminasab and S. Abdollahi, J. Chin. Chem. Soc., 2010, 57, 189–198 CrossRef CAS.
- M. J. Beier, T. W. Hansen and J.-D. Grunwaldt, J. Catal., 2009, 266, 320–330 CrossRef CAS.
- J. Luo, F. Peng, H. Wang and H. Yu, Catal. Commun., 2013, 39, 44–49 CrossRef CAS.
- J. Luo, F. Peng, H. Yu and H. Wang, Chem. Eng. J., 2012, 204–206, 98–106 CrossRef CAS.
- S. Narayanan, J. J. Vijaya, S. Sivasanker, L. J. Kennedy and A. Ariharan, J. Porous Mater., 2014, 21, 633–641 CrossRef CAS.
- A. Jia, L.-L. Lou, C. Zhang, Y. Zhang and S. Liu, J. Mol. Catal. A: Chem., 2009, 306, 123–129 CrossRef CAS.
- G. Zhan, J. Huang, M. Du, D. Sun, I. Abdul-Rauf, W. Lin, Y. Hong and Q. Li, Chem. Eng. J., 2012, 187, 232–238 CrossRef CAS.
- N. Long and N. Quan, React. Kinet., Mech. Catal., 2015, 114, 147–155 CrossRef.
- F. Shi, M. K. Tse, M. M. Pohl, A. Bruckner, S. Zhang and M. Beller, Angew. Chem., Int. Ed., 2007, 46, 8866–8868 CrossRef CAS PubMed.
- F. Shi, M. K. Tse, M.-M. Pohl, J. Radnik, A. Brückner, S. Zhang and M. Beller, J. Mol. Catal. A: Chem., 2008, 292, 28–35 CrossRef CAS.
- C. Kamonsatikul, T. Khamnaen, P. Phiriyawirut, S. Charoenchaidet and E. Somsook, Catal. Commun., 2012, 26, 1–5 CrossRef CAS.
- S. Xiao, C. Zhang, R. Chen and F. Chen, New J. Chem., 2015, 39, 4924–4932 RSC.
- L. Gao, J. Zhuang, L. Nie, J. Zhang, Y. Zhang, N. Gu, T. Wang, J. Feng, D. Yang, S. Perrett and X. Yan, Nat. Nanotechnol., 2007, 2, 577–583 CrossRef CAS PubMed.
- S. Rahim Pouran, A. A. Abdul Raman and W. M. A. Wan Daud, J. Cleaner Prod., 2014, 64, 24–35 CrossRef CAS.
- Z. Lei and R. Wang, Catal. Commun., 2008, 9, 740–742 CrossRef CAS.
- L. Zheng, X. Cheng, D. Cao, G. Wang, Z. Wang, D. Xu, C. Xia, L. Shen, Y. Yu and D. Shen, ACS Appl. Mater. Interfaces, 2014, 6, 7014–7019 CAS.
- C. Dupuis and G. Beaudoin, Miner. Deposita, 2011, 46, 319–335 CrossRef CAS.
- M. Appl, in Ullmann's Encyclopedia of Industrial Chemistry, Wiley-VCH Verlag, 2000, p. 156 Search PubMed.
- S.-S. Lin and M. D. Gurol, Environ. Sci. Technol., 1998, 32, 1417–1423 CrossRef CAS.
- Q. Jia, J. Zeng, R. Qiao, L. Jing, L. Peng, F. Gu and M. Gao, J. Am. Chem. Soc., 2011, 133, 19512–19523 CrossRef CAS PubMed.
- M. A. Blesa, H. A. Marinovich, E. C. Baumgartner and A. J. G. Maroto, Inorg. Chem., 1987, 26, 3713–3717 CrossRef CAS.
- W. Du, Y. Xu and Y. Wang, Langmuir, 2007, 24, 175–181 CrossRef PubMed.
- N. Li, Y. Gao, X. Zhang, Z. Yu, L. Shi and Q. Sun, Chin. J. Catal., 2015, 36, 721–727 CrossRef CAS.
- F. Chen, R. Liu, S. Xiao and C. Zhang, Mater. Res. Bull., 2014, 55, 38–42 CrossRef CAS.
- Y. Zhu, L. Tian, Z. Jiang, Y. Pei, S. Xie, M. Qiao and K. Fan, J. Catal., 2011, 281, 106–118 CrossRef CAS.
- C.-J. Jia, L.-D. Sun, F. Luo, X.-D. Han, L. J. Heyderman, Z.-G. Yan, C.-H. Yan, K. Zheng, Z. Zhang, M. Takano, N. Hayashi, M. Eltschka, M. Kläui, U. Rüdiger, T. Kasama, L. Cervera-Gontard, R. E. Dunin-Borkowski, G. Tzvetkov and J. Raabe, J. Am. Chem. Soc., 2008, 130, 16968–16977 CrossRef CAS PubMed.
- T. Yamashita and P. Hayes, Appl. Surf. Sci., 2008, 254, 2441–2449 CrossRef CAS.
- C. S. Kuivila, J. B. Butt and P. C. Stair, Appl. Surf. Sci., 1988, 32, 99–121 CrossRef CAS.
- I. Iatsunskyi, M. Kempiński, M. Jancelewicz, K. Załęski, S. Jurga and V. Smyntyna, Vacuum, 2015, 113, 52–58 CrossRef CAS.
- S. Yang, N. Yan, Y. Guo, D. Wu, H. He, Z. Qu, J. Li, Q. Zhou and J. Jia, Environ. Sci. Technol., 2011, 45, 1540–1546 CrossRef CAS PubMed.
- F. F. H. Aragón, J. D. Ardisson, J. C. R. Aquino, I. Gonzalez, W. A. A. Macedo, J. A. H. Coaquira, J. Mantilla, S. W. da Silva and P. C. Morais, Thin Solid Films, 2016, 607, 50–54 CrossRef.
- Y. Shi, S. Deng, H. Wang, J. Huang, Y. Li, F. Zhang and X. Shu, RSC Adv., 2016, 6, 15999–16009 RSC.
- A. Zhang, W. Zheng, J. Song, S. Hu, Z. Liu and J. Xiang, Chem. Eng. J., 2014, 236, 29–38 CrossRef CAS.
- J. Shang, X. Guo, F. Shi, Y. Ma, F. Zhou and Y. Deng, J. Catal., 2011, 279, 328–336 CrossRef CAS.
- A. Bhaumik and R. Kumar, J. Chem. Soc., Chem. Commun., 1995, 349–350 RSC.
- J. Abbot and D. G. Brown, Int. J. Chem. Kinet., 1990, 22, 963–974 CrossRef CAS.
- J. A. Dean, Lange's Handbook of Chemistry, McGraw-Hill, New York, 15th edn, 1998 Search PubMed.
- A. D. Bokare and W. Choi, J. Hazard. Mater., 2014, 275, 121–135 CrossRef CAS PubMed.
- F. Chen, S. Xie, X. Huang and X. Qiu, J. Hazard. Mater., 2016 DOI:10.1016/j.jhazmat.2016.02.073.
- A. Z. Jia, L. L. Lou, C. Zhang, Y. Zhang and S. Liu, J. Mol. Catal. A: Chem., 2009, 306, 123–129 CrossRef CAS.
- A. Mariana Balu, A. Pineda, K. Yoshida, J. Manuel Campelo, P. L. Gai, R. Luque and A. Angel Romero, Chem. Commun., 2010, 46, 7825–7827 RSC.
- F. Calle-Vallejo, J. Tymoczko, V. Colic, Q. H. Vu, M. D. Pohl, K. Morgenstern, D. Loffreda, P. Sautet, W. Schuhmann and A. S. Bandarenka, Science, 2015, 350, 185–189 CrossRef CAS PubMed.
Footnote |
| † Electronic supplementary information (ESI) available: Experimental details of Fe3O4-AIP-m; EDX analysis of Fe3O4-AIP-5.53%; SEM and XRD of Fe3O4-s synthesized with different Al sources; comprehensive energy diagrams calculated at B3LYP/6-31+G(d,p) level by DFT. See DOI: 10.1039/c6ra23019a |
|
| This journal is © The Royal Society of Chemistry 2016 |
Click here to see how this site uses Cookies. View our privacy policy here. 


