A thermal behavior and kinetics study of the catalytic pyrolysis of lignin

Quan Buab, Hanwu Lei*b, Moriko Qianb and Gayatri Yadavallib
aJiangsu University, School of Agricultural Equipment Engineering, 301 Xuefu Road, Zhenjiang, 212013, Jiangsu Province, P. R. China
bWashington State University, Bioproducts, Science, Engineering and Laboratory, Department of Biological Systems Engineering, Richland, WA 99354-1671, USA. E-mail: hlei@wsu.edu; Fax: +1-509-372-7690; Tel: +1-509-372-7628

Received 14th September 2016 , Accepted 14th October 2016

First published on 18th October 2016


Abstract

The aim of the present study is to convert lignin into bio-based phenols by catalytic pyrolysis using activated carbon (AC) as a catalyst. The thermal decomposition behavior of lignin pyrolysis was investigated using a thermogravimetric analyzer (TGA). The heating rate played a significant role in lignin thermal degradation, the mass loss of lignin in pyrolysis increased with the increase of heating rate. The reaction kinetics of lignin pyrolysis was determined and compared using microwave and conventional heating, a second-order reaction mechanism fitted well for lignin pyrolysis, and the results revealed that the activation energy for catalytic microwave pyrolysis of lignin was 7.32 kJ mol−1, which was remarkably lower than that for conventional pyrolysis of lignin (59.75 kJ mol−1). The reaction mechanism of this process was analyzed.

1. Introduction

Lignin is one of the most important constituents in lignocellulosic biomass, and it is the second most abundant natural resource after cellulose.1 A large amount of lignin is produced as by-products derived from conventional pulp and paper industries and lignocellulosics-to-ethanol processes. However, most lignin is generated as waste that is burned directly as a low-grade fuel without complete utilization;2 industrial applications using lignin are still in the developmental research stage.

The energy crisis has increased the cost of petroleum-based chemicals such as phenols and aromatics. So far, more than 90% of the phenols used in the United States are synthesized from fossil fuel, such an example is cumene synthesis from aromatics. It is therefore a matter of urgency to seek alternatives for petro-based chemicals such as monomeric aromatic compounds.

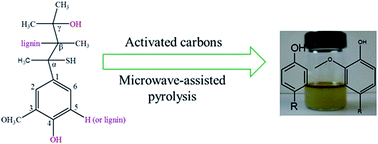
Lignin is a copolymer composed of three different precursors including p-coumaryl, coniferyl, and sinapyl alcohols. The major linkages in lignin include β-O-4, α-O-4, β-5, β-1, 4-O-5, 5-5 and β–β.3 Research indicates that lignin pyrolysis yields guaiacols and phenols through the cleavage of C–C linkages and ether (mainly α-O-4 or β-O-4 bonds) bonds.1,4 The abundance of lignin sources and its structure characteristics suggest that there is a great potential to make bio-based monomeric aromatic compounds by lignin decomposition.

Therefore, over the past years, increasing attention was directed to partial substitution of monomeric aromatic compounds from renewable sources by thermochemical conversion technology such as pyrolysis, liquefaction,5–7 and selective hydrogenolysis/hydrodeoxygenation.8–12 However, most researches focused on transformation of model compounds of lignin including monomeric compound (e.g. methoxyphenols) and dimeric compounds (e.g. phenethyl-phenyl ether, diphenylpropane, aryl ethers, and dibenzyl ether), but little research investigated bio-based phenols production from catalytic pyrolysis of lignin and the kinetics study of this process.13 Knowledge on the thermal decomposition kinetics of lignin is very critical to further understand the underlying processes and provides valuable information for rational design and scaling up of pyrolysis reactors.14 The molecular structure characteristics of lignin suggest that it is the most heat-resistant component in the three major components of lignocellulosic biomass, and it is typically decomposed at higher temperature than cellulose and hemicellulose decomposition.1 Kinetic parameters, such as activation energy, pre-exponential constant and reaction order, play significant roles in defining the thermal decomposition of lignin. Thermogravimetric analysis (TGA) has been frequently used to obtain kinetic parameters of lignin pyrolysis and evaluate the thermal behavior of lignin pyrolysis.14–17 Therefore, it is critical to gain more understanding of the reaction kinetics of lignin pyrolysis for green phenols production.

Microwave-assisted pyrolysis (MAP) is one of the many ways of converting biomass into high value products such as biofuels and green chemicals. There has a lot of advantages for MAP in comparison with pyrolysis by conventional heating, such as, no size reduction, wet biomass can be used directly without drying, higher quality of products, energy saving operation due to the exothermic reactions which occur during pyrolysis process and sustain the pyrolysis reactions in the absence of external heat sources.18,19 Another key advantage of the microwave heating process over conventional heating method is the nature of fast internal heating by microwave irradiation. Therefore, MAP has been widely applied for the conversion of wood, microalgae and sewage sludge into biofuels and value-added chemicals,20–22 and the kinetics study of biomass microwave pyrolysis disclosed that the reaction activation energy for microwave-assisted heating was remarkable lower than that for conventional pyrolysis, which should have a close relationship with the microwave internal heating where the heating of the reaction occurred from the inside to surface resulting in samples heated uniformly, and leading to temperature gradients reductions in samples;23 therefore, less heating loss in samples via conduction which promotes chemicals reactions.24

However, so far, only a few studies on MAP of lignin for value-added chemicals and fuels were reported,25 and there has no research on the kinetic study of lignin pyrolysis via microwave heating according to the reported literatures. Hence, further study to reveal the kinetics study of this process is required to better understand the reaction mechanism of MAP of lignin for production of value-added chemicals and fuels.

Therefore, the aim of this study is to estimate the thermal behavior of lignin degradation by TGA, calculate the kinetic parameters, and compare the differences of catalytic pyrolysis of lignin between microwave-assisted heating and conventional heating, which will shed further light on the reaction mechanism of lignin decomposition for value-added chemicals such as phenols. And the reaction mechanism of lignin degradation in this process was estimated.

2. Materials and methods

2.1 Materials

Alkali lignin (CAS number 8068-05-1) was purchased from Sigma-Aldrich Corporation (St. Louis, MO, USA). GAC 830 PLUS, an activated carbon with high purity produced by steam activation of selected grades of coal, was purchased from Norit Americas Inc. (Marshall, TX, USA).

2.2 Microwave-assisted pyrolysis of lignin

The microwave pyrolysis system consisted of the following components: a 1000 W, 2.45 GHz microwave cavity, an infrared temperature sensor for temperature measurement, a 500 mL quartz flask inside the microwave oven into which the lignin was loaded, and a product cooling and collection system where the condensable liquid (bio-oil) was collected. The temperature of cooling water in the condensers was about 5 °C. The microwave reactor was manufactured by Sineo Microwave Chemistry Technology Company (Shanghai, China). A constant microwave power setting (700 W) was used. The reaction temperature of lignin was monitored by an infrared sensor through a closed end quartz tube which penetrated to the centre of the reaction flask. After reaching the desired reaction temperature, the microwave reactor equipped with automatic temperature/power control used a minimum power (e.g., 0–100 W) to maintain the desired reaction temperatures. The system was purged with nitrogen at a flow rate of 1000 mL min−1 for 15 min prior to the pyrolysis reaction to maintain an oxygen-free environment inside the reactor.

2.3 FTIR spectroscopy analysis

The FTIR spectra of detected samples were obtained with an IRPrestige 21 spectrometer in the attenuated total reflection (ATR) mode (Shimadzu, Ge crystal; software: IRSolution) in a frequency range of 700 to 4200 cm−1. The spectra of the samples were analyzed by software Omnic 8.0, and the absorbances of the samples' functional groups were compared.

2.4 Thermogravimetric analysis

The thermal degradation behavior of lignin was observed with a thermogravimetric analyzer (TGA/SATA851e, Mettler Toledo). A known amount of lignin sample (about 6–8 mg) was loaded into alumina crucibles for analysis, and the lignin was heated from 25 to 600 °C at different heating rates of 10, 20, 30, and 40 °C min−1 under a nitrogen flow of 20 mL min−1.

2.5 Lignin decomposition kinetics

The Arrhenius rate expression is a fundamental rate law that is applied for virtually every kinetic model proposed:26,27
 
k(T) = A[thin space (1/6-em)]exp(−Ea/RT) (1)
where E is the activation energy, A is the frequency factor, R is the gas constant, T is the reaction temperature, and k(T) is the temperature-dependent reaction rate constant.

According to the Arrhenius correlation, the conversion ratio can be written as:

 
dα/dt = A[thin space (1/6-em)]exp(−E/RT)f(α) (2)
where α is the conversion ratio, f(α) represents the function related with conversion ratio α, which can be simplified as:
f(α) = (1 − α)n, n is the reaction order.

Therefore, the conversion ratio can be written as:

 
dα/dt = A[thin space (1/6-em)]exp(−E/RT)(1 − α)n (3)
where E is the activation energy (J mol−1), A is the frequency factor (s−1), R is the gas constant (8.314 (J mol−1 K−1), and T is the reaction temperature (K).

3. Results and discussion

The effects of reaction conditions on product yield and chemical compositions of bio-oils from microwave-assisted pyrolysis of lignin were reported in our previous report;13 the results indicated that phenols (up to 45% in the bio-oil) rich bio-oils were obtained from catalytic lignin pyrolysis using AC as a catalyst, the main chemical compounds in the bio-oil were phenols, guaiacols, hydrocarbons and esters which were constituted 69–86% of the bio-oil, and the optimum condition for phenols rich bio-oil from lignin pyrolysis was determined at the reaction temperature of 450 °C and a ratio of catalyst to lignin of 4.41. In order to further understand the reaction mechanism of phenols rich bio-oil production from lignin decomposition in this process, in this study, we mainly dedicated to analyze the reaction kinetics of lignin pyrolysis based on the results of catalytic pyrolysis of lignin using AC as a catalyst.

3.1 Thermal decomposition behavior of lignin

Thermogravimetry analysis reveals the relationship between the weight changes of a sample and related temperatures, which is critical for further understanding the reaction mechanism of thermal decomposition for a sample. TG curves indicate the mass loss of the sample vs. the temperature change of thermal degradation, and DTG reveals the corresponding rate of mass loss of TG curves.28

It can be seen from Fig. 1 that the thermal decomposition of lignin occurred in a wide temperature range from about 150 to 600 °C. Three stages of the degradation curve can be distinguished. The first stage (20 to 150 °C) corresponds to moisture evaporation. The weight loss of this stage was about 7.4 wt% of lignin. The second stage (150 to 500 °C) was the major weight loss where the main pyrolysis occurred by devolatilization, and most organic components were decomposed at this stage. The third stage (over 500 °C) entailed continuous devolatilization with charring. The DTG curves show that the height of the DTG peaks increased with the increase of heating rate, and the DTG curves shifted to a higher temperature zone with the increase of heating rates, which was also observed from the DTG peaks position. This illustrates that the heating rate played a significant role in lignin thermal degradation. High heating rates led to high conversion of a sample due to a higher thermal energy supply to overcome the temperature gradient.


image file: c6ra22967k-f1.tif
Fig. 1 (a) and (b) show the TG and DTG curves of the lignin, obtained at heating rates of 10, 20, 30 and 40 °C min−1, respectively.

In order to investigate the influence of the addition of catalyst on thermal degradation of lignin, catalyst (GAC 830 PLUS) was mixed with lignin in the ratio of 1[thin space (1/6-em)]:[thin space (1/6-em)]1. Similar thermal change and weight loss of raw lignin and lignin mixed with catalyst was observed as shown in Fig. 2. However, it was observed that the peaks of DTG curves shifted slightly to the right in the presence of catalyst, suggesting that addition of catalysts tends to slightly increase the temperature of the thermal degradation process. The use of activated carbon catalyst inhibited the char formation by promoting the degradation of high molecular compounds to small molecular compounds instead of chars formation. The same trend was observed when zeolites were applied as catalysts for pyrolysis of lignin by Luo et al.29


image file: c6ra22967k-f2.tif
Fig. 2 (a) TG curves of raw lignin pyrolysis with AC (1[thin space (1/6-em)]:[thin space (1/6-em)]1) and (b) DTG curves of raw lignin pyrolysis with AC (1[thin space (1/6-em)]:[thin space (1/6-em)]1).

3.2 Reaction kinetics of lignin pyrolysis

The kinetics of thermal decomposition of lignin can be predicated on a one-step global kinetic model:
 
Lignin/lignin with catalyst → bio-oil + syngas + biochar (4)

Isoconversional methods were used widely for describing kinetics of degradation of biomass. The principle assumption of isoconversional methods is that the change of temperature and heating rate does not change the reaction mechanism. The principle of these methods is that the kinetic constants are only the function of temperature at a determined conversion.15,30 The Coats–Redfern method is one of the most widely used methods of non-isothermal kinetic analysis which uses a single heating rate, therefore, the Coats–Redfern method was used to analyze reaction kinetics of lignin pyrolysis.

For a constant heating rate β (β = dT/dt), the following equation can be obtained from eqn (3):

 
image file: c6ra22967k-t1.tif(5)

Eqn (5) can be expressed as follows after re-arranging and integrating:

 
image file: c6ra22967k-t2.tif(6)

After integrating 1/(1 − α)n and e(−E/RT) into eqn (6):

 
image file: c6ra22967k-t3.tif(7)

The logarithmic expression of eqn (7) is:

 
ln([1 − (1 − α)1−n]/[T2(1 − n)]) = ln(AR/βE(1 − 2RT/E)) − E/RT (8)

Assuming 1 − 2RT/E ≈ 1, eqn (8) becomes:

 
ln([−ln(1 − α)1−n]/[T2(1 − n)]) = ln(AR/βE) − E/RT, n ≠ 1 (9)

When n = 1, eqn (9) becomes:

 
ln([−ln(1 − α)]/T2) = ln(AR/βE) − E/RT, n = 1 (10)

Therefore, a plot of ln([1 − (1 − α)1−n]/[T2(1 − n)]) vs. 1/T when n ≠ 1, ln([−ln(1 − α)]/T2) vs. 1/T when n = 1 should result in a straight line with slope = E/R and intercept = ln(AR/βT).

The thermal decomposition behavior of lignin showed that the decomposition temperature of lignin covers a very wide range from 200–500 °C, and the reaction conditions such as reaction temperature had influence on the products of pyrolysis (bio-oil, gas, biochar) through reaction kinetics. Therefore, the reaction kinetics analysis of lignin pyrolysis is very significant for further understanding of the reaction mechanism of lignin decomposition.

Linear models were obtained by plotting ln(f(T, α)) vs. 1/T for both raw lignin pyrolysis and catalytic lignin pyrolysis by TGA as shown in Fig. 3 and 4, respectively. Results indicated that the data fitted the obtained linear models well. The kinetic parameters (including apparent activation energy (E) and pre-exponential factor according to different reaction orders) for raw lignin pyrolysis and catalytic lignin pyrolysis using AC as a catalyst were estimated and are summarized as shown in Tables 1 and 2.


image file: c6ra22967k-f3.tif
Fig. 3 Plot of ln(f(T, α)) vs. 1/T for raw lignin pyrolysis by TGA.

image file: c6ra22967k-f4.tif
Fig. 4 Plot of ln(f(T, α)) vs. 1/T for catalytic lignin pyrolysis by TGA.
Table 1 Kinetic parameters for raw lignin pyrolysis
Reaction order (n) E (kJ mol−1) ln[thin space (1/6-em)]A (min−1) R2
1 47.35 1.31 0.985
2 61.49 4.72 0.997
3 78.08 8.62 0.996


Table 2 Kinetic parameters for catalytic lignin pyrolysis
Reaction order (n) E (kJ mol−1) ln[thin space (1/6-em)]A (min−1) R2
1 45.96 1.03 0.984
2 59.75 4.37 0.997
3 75.92 8.21 0.995


It can be seen from Tables 1 and 2 that a second-order reaction mechanism fits well for both raw lignin pyrolysis and catalytic lignin pyrolysis with R2 = 0.997, and 0.997, respectively. The apparent activation energy (E) was 61.49 and 59.75 kJ mol−1, and the pre-exponential factor (ln[thin space (1/6-em)]A) was 4.03 and 3.68 min−1, for raw lignin and catalytic lignin pyrolysis, respectively. It was observed from these two tables that the activation energy for catalytic lignin pyrolysis for all different reaction orders was slightly lower than the values of raw lignin pyrolysis; this might be illustrated by the effect of addition of AC catalyst which improved the reaction rate by overcoming high activation energy. Therefore, the second-order, one step global model described lignin pyrolysis well in this study.

Linear models were obtained by plotting ln(f(T, α)) vs. 1/T for catalytic lignin pyrolysis by microwave-assisted heating as shown in Fig. 5. It was observed that the data fitted the obtained linear models well. The kinetic parameters (including apparent activation energy (E) and pre-exponential factor according to different reaction orders) for microwave pyrolysis of lignin using AC as a catalyst were estimated and are summarized as shown in Table 3. It can be seen from Table 3 that a second-order reaction mechanism fits well for catalytic lignin pyrolysis by microwave-assisted heating with R2 = 0.9956. The apparent activation energy (E) was 7.32 kJ mol−1, and the pre-exponential factor (ln[thin space (1/6-em)]A) was −9.73 min−1, suggesting that there might appear a lower energy barrier intermediate between catalyst and the lignin during microwave-assisted pyrolysis of lignin. Similar trend for the low activation energy (5.8 kJ mol−1) of catalytic lignin hydrogenolysis using Ru as a catalyst was reported by Zhang et al. (2014).12


image file: c6ra22967k-f5.tif
Fig. 5 Plot of ln(f(T, α)) vs. 1/T for catalytic microwave pyrolysis of lignin.
Table 3 Kinetic parameters for catalytic microwave pyrolysis of lignin
Reaction order (n) E (kJ mol−1) ln[thin space (1/6-em)]A (min−1) R2
1 1.04 −11.61 0.9084
2 7.32 −9.73 0.9956
3 15.04 −7.21 0.9889


It is obvious that the activation energy for catalytic microwave pyrolysis of lignin was much lower than those obtained by conventional lignin pyrolysis using TGA. Similar results were reported by other literatures.23,31,32 This may be attributed to the microwave internal heating where heating occurs from the inside to surface resulting in uniformly heated samples, leading to a reduction in temperature gradient in the samples.23 Less heating loss in samples via conduction promotes chemicals reactions.33,34 Therefore, the second-order, one step global model described lignin pyrolysis well in this study.

3.3 Mechanism analysis of catalytic microwave pyrolysis of lignin

The temperature range of lignin pyrolysis varies from 200–500 °C.35 In general, there are two steps involving lignin decomposition due to the thermal stability difference of various functional groups of lignin. Firstly, at a low temperature of about 200 °C, the cleavage of the most important linkage such as β-O-4 ether (∼60% in lignin) and unstable C–C bonds occurred.36 As a result, lignin decomposed to intermediates which are mainly composed of polyaromatics. In the second step, at higher temperatures of about 400 °C, the polyaromatics further decomposed to volatile including condensable composition (bio-oil) and non-condensable composition (syngas) and char through breaking stronger bonds such as hydrodealkylation by the rupture of side chain groups. Which is in good agreements with the kinetics analysis results where a second-order reaction mechanism with R2 = 0.940 was obtained as shown in Table 3.

Fig. 5 shows the FTIR spectra of raw lignin derived bio-oil and bio-oil from catalytic lignin pyrolysis. The FTIR spectra for lignin derived bio-oil displayed that characteristics of the vibrational modes were detected at 3500–3000 cm−1 (–OH stretching), 1700–1650 cm−1 (aromatic substitute stretching), ∼1600 cm−1 & ∼1475 cm−1 (aromatic C[double bond, length as m-dash]C stretching), and ∼1250 cm−1 & ∼1120 cm−1 (C–O–C stretching, diaryl). It was found that the main difference between raw bio-oil and catalyzed bio-oils were from 1600–1120 cm−1. The intensified ∼1250 cm−1 & ∼1120 cm−1 (C–O–C stretching, diaryl) was observed in raw lignin bio-oil but was not found in catalyzed lignin bio-oil; this can be illustrated by the effect of demethoxylation or demethylation on guaiacols in bio-oil after catalytic pyrolysis in this process. The FT-IR results were in good agreements with our previous reported results that the surface carbonyl density might affect the kinetics of a variety of reduction–oxidation processes at carbon surface as shown in Fig. 6. The carbonyl groups which were not found in raw activated carbon were detected on activated carbon after carbon catalysis as reported in our previous study, the increase of carbonyl groups might be explained by the reduction–oxidation of bio-oils.13 Mechanistically, carboxylic anhydride on the activated carbon was reacted with the superheated water entered activated carbon during microwave pyrolysis, and the generated carboxylic acids would become proton donors and acid catalyst. The new formed O–H bond absorbs some electron density distributed on oxygen which might be available for donation to the carbonyl carbon, as a result, the carbonyl carbon becomes stronger electrophile through protonation of the carbonyl, which makes it react faster with the nucleophiles such as the methoxides in bio-oil. Therefore, methoxide homolysis for guaiacols conversions was catalyzed by carbon catalyst (Fig. 7).13


image file: c6ra22967k-f6.tif
Fig. 6 FTIR spectra of lignin-derived bio-oil samples.

image file: c6ra22967k-f7.tif
Fig. 7 A proposed reaction mechanism for phenolic rich bio-oil reduction.

In this study, granular activated carbon (Norit GAC830 PLUS) was added as a catalyst which also functioned as a good microwave absorber as GAC could absorb microwave energy quickly.37 As the heating medium and absorption of microwave energy, there was a hot-spot effect in the heating medium which generated more heat. Therefore, hydrogen donates were produced as a result of a series of reactions such as the water gas shift reaction, and steam reforming reaction occurring at high temperature which were led by hot-spot effects during the microwave heating process. Subsequently, various reactions such as hydrogenolysis, dehydration, demethylation and demethoxylation occurred during lignin pyrolysis in the presence of hydrogen donates. As a result, the polyaromatics of lignin were eventually converted into small molecular products such as phenols and guaiacols.

4. Conclusions

The thermal behaviour of lignin pyrolysis by TGA and reaction kinetics of catalytic pyrolysis of lignin both by TGA and microwave-assisted heating using AC as a catalyst were investigated. The thermal behaviour analysis by TGA revealed that the use of activated carbon catalyst inhibited the char formation by promoting the degradation of high molecular compounds to small molecular compounds instead of chars formation.

The reaction kinetics study for lignin pyrolysis showed that a second-order reaction mechanism fitted well for catalytic pyrolysis of lignin for both conventional pyrolysis by TGA and microwave-assisted pyrolysis. However, the activation energy for catalytic microwave pyrolysis was significantly lower than that by TGA, which should have close relationship with the microwave internal heating. The results of the presented study suggested that catalytic pyrolysis through microwave heating could be used to generate monomeric aromatic compounds such as guaiacoles, phenols, and aromatics from lignin degradation.

Acknowledgements

This study was partially supported by the Agriculture and Food Research Initiative of National Institute of Food and Agriculture, United States Department of Agriculture (Award Number: 2015-67021-22911; Award Number: 2016-67021-24533; Award Number: 2016-33610-25904), Chinese Scholarship Council, National Science Foundation of China (Award Number: 31500494), Natural Science Foundation of Jiangsu Province of China (Award Number: BK20140972), Opening Fund of Key Laboratory of Biomass Energy and Materials in Jiangsu Province (Award Number: JSBEM2014011), Department of Biological Systems Engineering at Washington State University, School of Agricultural Equipment Engineering at Jiangsu University, and the Priority Academic Program of the Development of Jiangsu Higher Education Institutions (PAPD). We thank Dr Aftab Ahamed for helping us run GCMS measurements.

References

  1. D. Mohan, C. U. Pittman and P. H. Steele, Energy Fuels, 2006, 20, 848–889 CrossRef CAS.
  2. G. W. Huber, S. Iborra and A. Corma, Chem. Rev., 2006, 106, 4044–4098 CrossRef CAS PubMed.
  3. J. E. Holladay, J. J. Bozell, J. F. White and D. Johnson, Top Value-added Chemicals from Biomass, United States Department of Energy, 2007, vol. 2, http://www1.eere.energy.gov/bioenergy/pdfs/pnnl-16983.pdf Search PubMed.
  4. C. A. Chen, H. Pakdel and C. Roy, Bioresour. Technol., 2001, 79, 277–299 CrossRef.
  5. M. Wang, M. Leitch and C. Xu, Eur. Polym. J., 2009, 45, 3380–3388 CrossRef CAS.
  6. S. Cheng, I. Dcruz, M. Wang and M. Leitch, Energy Fuels, 2010, 24, 4659–4667 CrossRef CAS.
  7. J. Long, Y. Xu, T. Wang, Z. Yuan, R. Shu, Q. Zhang and L. Ma, Appl. Energy, 2015, 141, 70–79 CrossRef CAS.
  8. H. Konnerth, J. Zhang, D. Ma, M. H. G. Prechtl and N. Yan, Chem. Eng. Sci., 2015, 123, 155–163 CrossRef CAS.
  9. M. Zaheer and R. Kempe, ACS Catal., 2015, 5, 1675–1684 CrossRef CAS.
  10. Y. Wang, S. De and N. Yan, Chem. Commmun., 2016, 52, 6210–6224 RSC.
  11. X. Chen, B. Zhang, Y. Wang and N. Yan, Chimia, 2015, 69, 120–124 CrossRef CAS PubMed.
  12. J. Zhang, J. Teo, X. Chen, H. Asakura, T. Tanaka, K. Teramura and N. Yan, ACS Catal., 2014, 4, 1574–1583 CrossRef CAS.
  13. Q. Bu, H. Lei, L. Wang, Y. Wei, L. Zhu, X. Zhang, Y. Liu and G. Yadavalli, Bioresour. Technol., 2014, 162, 142–147 CrossRef CAS PubMed.
  14. G. Jiang, D. J. Nowakowski and A. V. Bridgwater, Thermochim. Acta, 2009, 498, 61–66 CrossRef.
  15. B. Jankovic, Bioresour. Technol., 2001, 102, 9763–9771 CrossRef PubMed.
  16. K. Ross, A. Leung, D. Godfrey and G. Mazza, World Appl. Sci. J., 2012, 16, 160–178 CAS.
  17. Q. Yang and S. Wu, Cellul. Chem. Technol., 2009, 43, 133–139 CAS.
  18. X. Wang, W. Morrison, Z. Du, Y. Wan, X. Lin, P. Chen and R. Ruan, Appl. Energy, 2012, 99, 386–392 CrossRef.
  19. T. J. Appleton, R. I. Colder, S. W. Kingman, I. S. Lowndes and A. G. Read, Appl. Energy, 2005, 81, 85–113 CrossRef CAS.
  20. Q. Bu, H. Lei, S. Ren, L. Wang, Q. Zhang, J. Tang and R. Ruan, Bioresour. Technol., 2012, 108, 274–279 CrossRef CAS PubMed.
  21. J. A. Mendez, A. Dominguez, M. Inguanzo and J. J. Pis, J. Anal. Appl. Pyrolysis, 2014, 71, 657–667 CrossRef.
  22. Z. Hu, X. Ma and C. Chen, Bioresour. Technol., 2012, 107, 487–493 CrossRef CAS PubMed.
  23. J. Sun, W. Wang, Z. Liu, Q. Ma, C. Zhao and C. Ma, Energies, 2012, 5, 3295–3306 CrossRef CAS.
  24. J. Ceamanos, J. F. Mastral, A. Millera and M. E. Aldea, J. Anal. Appl. Pyrolysis, 2002, 65, 93–110 CrossRef CAS.
  25. R. W. Chan and B. B. Krieger, J. Appl. Polym. Sci., 1981, 26, 1533–1553 CrossRef CAS.
  26. J. E. White, W. J. Catallo and B. J. Legendre, J. Anal. Appl. Pyrolysis, 2011, 91, 1–33 CrossRef CAS.
  27. X. Zhang, M. Xu, R. Sun and L. Sun, J. Eng. Gas Turbines Power, 2006, 128, 493–496 CrossRef CAS.
  28. N. E. E. Mansouri, Q. Yuan and F. Huang, BioResource, 2011, 6, 2492–2503 Search PubMed.
  29. Z. Luo, S. Wang and X. Guo, J. Anal. Appl. Pyrolysis, 2012, 95, 112–117 CrossRef CAS.
  30. d’ A. B. Fernadez, L. Rueda, P. M. Stefani, K. Caba, I. Mondragon and A. Eceiza, Thermochim. Acta, 2007, 459, 94–103 CrossRef.
  31. S. Ren, H. Lei, L. Wang, Q. Bu, S. Chen, J. Wu and R. Ruan, J. Anal. Appl. Pyrolysis, 2012, 94, 163–169 CrossRef CAS.
  32. R. Zhou, H. Lei and J. Julson, J. Anal. Appl. Pyrolysis, 2013, 101, 172–176 CrossRef CAS.
  33. J. Ceamanos, J. F. Mastral, A. Millera and M. E. Aldea, J. Anal. Appl. Pyrolysis, 2002, 65, 93–110 CrossRef CAS.
  34. P. Lahijani, Z. A. Zainal, A. R. Mohamed and M. Mohammadi, Bioresour. Technol., 2014, 158, 193–200 CrossRef CAS PubMed.
  35. M. Brebu and C. Vasile, Celloluse Chemistry and Technology, 2010, 44, 353–363 CAS.
  36. M. P. Pandey and C. S. Kim, Chem. Eng. Technol., 2010, 34, 29–41 CrossRef.
  37. D. A. Jones, T. P. Lelyveld, S. D. Mavrofidis, S. W. Kingman and N. J. Miles, Resour., Conserv. Recycl., 2002, 34, 75–90 CrossRef.

This journal is © The Royal Society of Chemistry 2016