DOI:
10.1039/C6RA22836D
(Paper)
RSC Adv., 2016,
6, 110583-110591
pH-tuned diverse structures and properties: two Anderson-type polyoxometalate-based metal–organic complexes for selective photocatalysis and adsorption of organic dyes†
Received
13th September 2016
, Accepted 15th November 2016
First published on 15th November 2016
Abstract
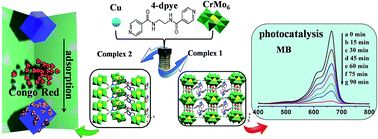
Two novel Anderson-type polyoxometalates (POMs)-based metal–organic complexes, namely, Cu5(μ2-OH)2(4-dpye)2[CrMo6(OH)5O19]2(H2O)10 (1), {Cu(4-Hdpye)[CrMo6(OH)6O18](H2O)2}·2H2O (2) (4-dpye = N,N′-bis(4-pyridinecarboxamide)-1,2-ethane), were hydrothermally synthesized in different pH ranges and structurally characterized by single-crystal X-ray diffraction, IR spectra, powder X-ray diffraction (PXRD) and thermogravimetric analyses (TGA). Complex 1 shows a 3D (3,4)-connected framework constructed by the 2D {Cu5(μ2-OH)2[CrMo6(OH)5O19]2} inorganic layer and bidentate 4-dpye bridging ligands. Complex 2 exhibits a 2D polymeric structure based on the 2D {Cu[CrMo6(OH)6O18](H2O)2} layer and monodentate 4-Hdpye ligands. The complexes 1 and 2 prove that the pH value plays an important role not only in the synthesis and structures but also for the properties of the title complexes. Their electrochemical behaviour and electrocatalytic activities towards the reduction of bromate and hydrogen peroxide have been reported. In addition, the selective photocatalytic properties and adsorption of organic dyes for 1 and 2 have been investigated. Complex 1 possesses good photocatalytic activity towards the degradation of organic dyes Congo Red (CR) and methylene blue (MB), while complex 2 has high adsorption capacity of MB/CR at room temperature. All MB/CR molecules adsorbed on 2 can be completely released in NaCl-containing DMF solution.
Introduction
Polyoxometalates (POMs), as a type of metal oxide cluster, have attracted extensive attention because of their affluent structures1 and potential applications in the field of catalysis, sorption, magnetism, photochemistry and so on.2 Recently, POM-based inorganic–organic hybrids constructed from inorganic POM building blocks and various organic ligands or transition metal complexes, have been shown to bring novel structural motifs and functionalities into one entity.3 From the structural point of view, the POM anions in these hybrids can be either connected as guests/templates/counter ions through noncovalent interactions,4 or coordinated to metal atoms as inorganic ligands by covalent bonds.5 Thus, the POM-supported hybrid materials can combine the advantages of inorganic POMs and the functionalities of organic components/transition metal complexes, which make them attractive for many new potential applications ranging from gas storage, chemical separation and catalysis to ion exchange reactions.6
As a kind of important member of the POM family, the Anderson-type polyoxoanions have attracted great attention in the construction of POM-based inorganic–organic hybrids, though they are still in their incipient stage.7 Das's group and Wang's group employed the Anderson-type polyoxoanions [Al(OH)6Mo6O18]3−/[Cr(OH)6Mo6O18]3−/[IMo6O24]5− and transition/rare-earth metal ions constructing a series of metal organic complexes (MOCs) with extended or open-frameworks.8 Wei's group synthesized two Anderson-type POM-based organic–inorganic hybrids by direct modification of the parent Anderson cluster [CrMo6O18(OH)6]3− with the tripodal ligands CH3C(CH2OH)3 and CH3C(CH2OH)2(COOH).9 Many Anderson-type POM-based MOCs show good photocatalysis activity towards the decomposition of organic dyes.10 However, to the best of our knowledge, there are no reports on the B-type Anderson-type [CrMo6(OH)6O18]3−(CrMo6)-based MOCs which has high adsorption capacity of organic dyes in dark at room temperature.
As is well known, the specific properties of POM-based MOCs were largely determined by their structures and the choice of a suitable organic ligand is also essential for the construction of POM-based MOCs. Nowadays, flexible organic molecules containing two symmetrical coordination groups are becoming more popular, such as bis(pyridyl)-,11 bis(imidazole)-,12 bis(triazole)-,13 and bis(tetrazole)14-based derivatives ligands, which have been used to construct a variety of POM-based complexes.15 As a sort of N/O-donor ligands, the flexible bis-pyridyl-bis-amide have attracted our attention based on their structural characters and a series of new POM-based MOCs have been constructed with some bis-pyridyl-bis-amide ligands.16 However, the Anderson-type POM-based MOCs constructed from bis-pyridyl-bis-amide ligands have been reported rarely.
Taking all these into account, in this work, Na3[CrMo6(OH)6O18]·8H2O was selected as the inorganic ligand, N,N′-bis(4-pyridinecarboxamide)-1,2-ethane (4-dpye) (Scheme 1) was employed as the organic ligand to assemble with CuII ions, aiming at constructing novel architectures within an appropriate pH range. Fortunately, two Anderson-type POM-based MOCs Cu5(μ2-OH)2(4-dpye)2[CrMo6(OH)5O19]2(H2O)10 (1), and {Cu(4-Hdpye)[CrMo6(OH)6O18](H2O)2}·2H2O (2) were constructed in one pot, with the pH range of 2.5–4.0. The electrochemical properties, adsorption and photocatalytic properties of organic dyes for the title complexes were also studied. Their structural diversities show that the pH value of the reaction system played a key role in the structural self-assembled process as well as the properties of the title complexes.
 |
| Scheme 1 The ligand used in this paper. | |
Experimental
Materials and characterization
All reagents and solvents for syntheses were purchased from commercial sources and used as received without further purification. The selected 4-dpye ligand17 and Na3[CrMo6(OH)6O18]·8H2O were prepared according to the reported procedures.18 FT-IR spectra (KBr pellets) were taken on a Scimitar 2000 Near FT-IR Spectrometer. Thermogravimetric analyses (TGA) were performed on a Pyris Diamond TG instrument under a flowing N2 atmosphere with a heating rate of 10 °C min−1. Powder X-ray diffraction (PXRD) patterns were measured on an Ultima IV with D/teX Ultra diffractometer at 40 kV, 40 mA with Cu Kα (λ = 1.5406 Å) radiation. The elemental analyses (C, H, and N) were measured on a Perkin Elmer 2400 CHN elemental analyzer. A CHI 440 electrochemical workstation was used for the electrochemical experiments. UV-vis absorption spectra were obtained using a SP-1901 UV-vis spectrophotometer.
Synthesis of Cu5(μ2-OH)2(4-dpye)2[CrMo6(OH)5O19]2(H2O)10 (1)
A mixture of CuCl2·2H2O (0.50 mmol), 4-dpye (0.10 mmol) Na3[CrMo6(OH)6O18]·8H2O (0.24 mmol), and H2O (10 mL) was stirred for 30 min at the room temperature. The pH value was then adjusted to about 4.0 using 1.0 M HCl. The suspension was transferred to a Teflon lined autoclave (25 mL) and kept at 120 °C for 4 days. After slowly cooled to room temperature, blue block crystals of complex 1 were filtered off, washed with distilled water, and dried in a desiccator at room temperature to give a yield of 30% based on Mo. Anal. calcd (found%) for 1: C, 10.82 (10.69); H, 1.86 (1.62); N, 3.61 (3.53). IR (KBr pellet, cm−1): 3256 (s), 1658 (s), 1543 (m), 1442 (m), 1301 (w), 1072 (w), 957 (m), 914 (s), 652 (m).
Synthesis of {Cu(4-Hdpye)[CrMo6(OH)6O18](H2O)2}·2H2O (2)
Complex 2 was prepared in the same way as 1 except that pH value was then adjusted to about 2.5 using 1.0 M HCl. Blue strip crystals of complex 2 were filtered off, washed with distilled water, and dried in a desiccator at room temperature to give a yield of 52% based on Mo. Anal. calcd (found%) for 2: C, 11.79 (11.67); H, 2.03 (2.14); N, 3.93 (3.79). IR (KBr pellet, cm−1): 3358 (s), 1639 (s), 1550 (s), 1493 (m), 1321 (m), 1244 (m), 1027 (w), 914 (s), 646 (m).
Preparation of complex 1 bulk-modified CPE
The complex 1 bulk-modified carbon paste electrode (1–CPE) was fabricated by mixing 0.11 g graphite powder and 0.01 g complex 1 in an agate mortar for approximately 30 min to achieve an uniform mixture; then 0.10 mL paraffin oil was added and stirred with a glass rod.19 The homogenized mixture was packed into a 3 mm inner diameter glass tube and the tube surface was wiped with weighing paper. The electrical contact was established with the copper wire through back of the electrode. The bare CPE was prepared by similar process without complex 1.
X-ray crystallographic study
Crystallographic data for the title complexes were collected on a Bruker Smart APEX II diffractometer with Kα (λ = 0.71069 Å) by θ and ω scan mode at 296 K. All the structures were solved by direct methods using the SHELXS program of the SHELXTL package and refined by full-matrix least-squares methods with SHELXL.20 The H atoms on the C atoms were fixed in calculated positions. Further details for crystallographic data and structures are listed in Table 1. The selected bond distances and bond angles are summarized in Table S1.† Crystallographic data for the structures reported in this paper have been deposited in the Cambridge Crystallographic Data Center with CCDC number of 1490699 and 1490698 for 1-2, respectively.
Table 1 Crystal data and structure refinement for complexes 1-2
R1 = Σ||Fo| − |Fc||/Σ|Fo|. wR2 = Σ[w(Fo2 − Fc2)2]/Σ[w(Fo2)2]1/2. |
Complex |
1 |
2 |
Empirical formula |
C28H58Mo12N8O64Cr2Cu5 |
C14H29Mo6N4O30CrCu |
Formula weight |
3103.80 |
1424.59 |
Crystal system |
Triclinic |
Monoclinic |
Space group |
P![[1 with combining macron]](https://www.rsc.org/images/entities/char_0031_0304.gif) |
P21 |
a (Å) |
12.1850(5) |
6.8740(5) |
b (Å) |
12.6930(5) |
20.8140(14) |
c (Å) |
14.1440(6) |
12.7500(8) |
α (°) |
71.3780(10) |
90 |
β (°) |
85.0200(10) |
93.7000(10) |
γ (°) |
62.0560(10) |
90 |
V (Å3) |
1826.17(13) |
1820.4(2) |
Z |
1 |
2 |
Dc (g cm−3) |
2.822 |
2.599 |
μ (mm−1) |
3.814 |
2.965 |
F (000) |
1481 |
1360 |
Reflection collected |
13 590 |
12 911 |
Unique reflections |
9071 |
8736 |
Parameters |
541 |
505 |
Rint |
0.0160 |
0.0254 |
GOF |
1.002 |
1.001 |
R1[I > 2σ(I)]a |
0.0258 |
0.0402 |
wR2b (all data) |
0.0649 |
0.1017 |
Results and discussion
The hydrothermal technique has been proven to be an effective method to construct POM-based metal–organic hybrid complexes. However, reports on obtaining two or more types of crystals in one pot are still very scarce.21 Thus, we introduced 4-dpye in the Cu–CrMo6 system by tuning the pH range of 2.5–4.0 expecting that different crystals would be obtained in one pot. Fortunately, two crystals of complexes 1 and 2 were simultaneously obtained in one pot (Scheme 2). When the pH is close to 4.0, complex 1 is in majority; when the pH is close to 2.5, a plenty of crystals 2 are obtained. However, when the pH is lower than 2.5 or above 4.0, we couldn't obtain suitable crystals for single crystal X-ray diffraction. Owing to the distinct colour and shape, complexes 1 and 2 can be separated mechanically by using a microscope. Obviously, using an appropriate pH range seems to be rational to obtain two or more types of crystals in one pot. This work may provide informative examples for efficient usage of the hydrothermal technique to construct multiple crystals.
 |
| Scheme 2 Schematic view of the efficient usage of the hydrothermal technique to construct two kinds of crystals in one pot. | |
As discussed above, the title complexes represent the novel examples of MOCs constructed from flexible bis-pyridyl-bis-amide ligand and CrMo6 polyoxoanions, in which the proper pH, the Anderson-type anions, and the N-donor ligand with different coordination modes, exhibiting important effect on the whole structures (Table 2).
Table 2 The coordination modes of the CrMo6 anions, 4-dpye ligand and CuII ions
|
Complex 1 |
Complex 2 |
CuII ions |
 |
 |
The organic ligands |
 |
 |
The CrMo6 anions |
 |
 |
Description of crystal structures
The [CrMo6(OH)6O18]3−(CrMo6) anions acting as inorganic building blocks adopt different coordination modes in complexes 1 and 2, which show B-type Anderson structure made up of seven edge-sharing octahedra. Six of them are {MoO6} octahedra arranged hexagonally around the central {Cr(OH)6} octahedron. The Cr–O bond lengths are in the range of 1.951(6)–1.995(6) Å, while the O–Cr–O angles vary from 84.2(3) to 179.9(2)°. According to the coordination environments, there are four types of oxygen atoms existing in the CrMo6 unit: terminal oxygen Ot, terminal oxygen Ot′ linked to Cu ions, double-bridging oxygen Oa and central oxygen Ob. Thus, the Mo–O bond lengths fall into four types: Mo–Ot, 1.699(7)–1.704(6) Å; Mo–Ot′, 1.712(6)–1.719(6) Å; Mo–Oa, 1.895(6)–1.917(6) Å; and Mo–Ob, 2.288(6)–2.306(6) Å.
The valence sum calculations22 show that all the Cu ions in the title complexes are +II oxidation state. In 2, 4-dpye was protonated, then complex 2 is formulated as {Cu(4-Hdpye)[CrMo6(OH)6O18](H2O)2}·2H2O.
Crystal structure of Cu5(μ2-OH)2(4-dpye)2[CrMo6(OH)5O19]2(H2O)10 (1)
Single-crystal X-ray diffraction analysis reveals that complex 1 is a 3D structure. The asymmetric unit of 1 is composed of three crystallographically independent CuII ions, two 4-dpye ligands, two μ2-OH groups, two coordinated CrMo6 anions and four coordinated water molecules. As shown in Fig. 1a, all the CuII ions are six-coordinated in octahedral coordination geometries, but their coordination environments are different. Cu1 is coordinated by two pyridine nitrogen atoms from two individual 4-dpye ligands with Cu–N bond distances of 1.969(3) Å, two O atoms from two CrMo6 anions and two oxygen atoms from coordinated waters with Cu–O bond distances of 2.016(3)–2.415(2) Å. Cu2 is coordinated by two O atoms from two CrMo6 anions, two O atoms from two μ2-OH groups and two O atoms from coordinated water molecules with Cu–O bond distances of 1.915(3)–2.5458(3) Å. Cu3 is coordinated by two O atoms from two CrMo6 anions, two O atoms from two μ2-OH groups, one O atom from coordinated water molecule and one pyridyl nitrogen atom from one 4-dpye ligand with Cu–O bond distances of 1.991(3)–2.4623(3) Å and Cu–N bond distance of 2.011(3) Å.
 |
| Fig. 1 (a) The coordination environment of the CuII ions in 1. The hydrogen atoms are omitted for clarity. Symmetry code: #1: 2 − x, −1 − y, −z. (b) A view of the 2D Cu–CrMo6 inorganic layer in complex 1. (c) Representation of the {6·82}{64·8·10} topological network of 1. | |
As shown in Fig. 1b and S1,† two μ2-OH groups connect two adjacent CuII ions (Cu2 and Cu3) to form a {Cu2(OH)2} dinuclear unit. Then the CrMo6 polyoxoanion cluster provides two adjacent terminal oxygen atoms (O2, O3) and two other centrosymmetric oxygen atoms (O4 and O15) on the same equator surface to connect four CuII ions from two adjacent {Cu2(OH)2} dinuclear units, which leads to the formation of a 1D Cu2–CrMo6 inorganic chain in 1. Interestingly, each CuII ion (Cu1) linked two CrMo6 clusters from the adjacent 1D Cu2–CrMo6 inorganic chains to form a 2D inorganic layer.
In addition, each 4-dpye molecule serves as a μ2-bridging ligand (via ligation of pyridyl nitrogen atoms) to link two CuII ions (Cu1 and Cu3) belonging to the neighboring 2D inorganic layers, constructing a 3D inorganic–organic hybrid framework (Fig. S2†). It is noted that the CrMo6 anions exhibit two types of coordination modes: one provides four oxygen atoms to link two {Cu2(OH)2} dinuclear units; the other provides six oxygen atoms to coordinate with two {Cu2(OH)2} dinuclear units and two Cu1 ions. In the two neighboring 2D layers CrMo6 units of type 1 (hexadentate) are located directly above CrMo6 units of type 2 (tetradentate). If considering the hexadentate CrMo6 anions as the four-connected nodes, the {Cu2(OH)2} dinuclear units as three-connected nodes and the 4-dpye ligands as linear linkers, the resulting structure of 1 is a 3,4-connected net with the Schläfli symbol of {6·82}{64·8·10} (Fig. 1c).
Crystal structure of {Cu(4-Hdpye)[CrMo6(OH)6O18](H2O)2}·2H2O (2)
Single-crystal X-ray diffraction analysis shows that complex 2 is 2D CrMo6-based metal–organic network. There is one crystallographically independent CuII ion, one 4-Hdpye ligand, one CrMo6 anion, two coordinated water molecules and two lattice water molecules in the symmetric unit of 2. The Cu1 ion is six-coordinated by one N atom from one 4-dpye ligand, three O atoms from three CrMo6 polyoxoanions, and two O atoms from two coordinated water molecules, showing a distorted octahedral geometry (Fig. 2a). The bond distances and angles around CuII ion are 1.971(7) Å for Cu–N, 1.934(6)–2.5983(6) Å for Cu–O and 90.6(3)–1177.6(3)° for N–Cu–O and 81.0(2)–172.5(3)° for O–Cu–O, respectively.
 |
| Fig. 2 (a) The coordination environment of the CuII ion in 2. The hydrogen atoms and lattice water molecules are omitted for clarity. Symmetry code: #1: 1 − x, −1 − y, −2 − z. (b) A view of the 2D Cu–CrMo6 inorganic layer in complex 2. (c) The 2D Cu–CrMo6 metal–organic network with flexible bis-pyridyl-bis-amide ligands in 2. | |
For complex 2, the adjacent CrMo6 polyoxoanions are linked by CuII ions to form a 2D inorganic layer, as shown in Fig. 2b. In the layer, each CrMo6 polyoxoanion is coordinated with three CuII ions, and each CuII ion is coordinated by three CrMo6 polyoxoanions. On the other hand, the protonated 4-Hdpye ligands adopt a monodentate coordination mode coordinating to CuII ions in the 2D layer (Fig. 2c).
IR spectra
The IR spectra of the title complexes are shown in Fig. S3.† The characteristic bands at 570, 652, 914 cm−1 for 1 and 563, 646, 914 cm−1 for 2 are attributed to the ν(Mo–Ot), ν(Mo–Ot′), ν(Mo–Oa) and ν(Mo–Ob), respectively.23 The bands observed in the region of 1301, 1442, 1543, 1658 cm−1 for 1, 1321, 1493, 1550, 1639 cm−1 for 2 are due to the 4-dpye ligand.24 The bands around 3400 cm−1 can be attributed to the water molecules.
Powder X-ray diffraction and thermal stability analysis
The powder X-ray diffraction (PXRD) patterns represent that the synthesized complexes match with the simulated ones except for some intensity differences (Fig. S4†), proving the purity of the crystalline phase. The intensity differences can be owed to the different orientation of the crystals in the powder samples.25 Thermogravimetric analyses (TGA) of the title complexes were performed in flowing N2 atmosphere with a heating rate of 10 °C min−1 from the room temperature to 800 °C (Fig. S5†). The TGA curve of complex 1 shows two distinct weight loss steps. The first weight loss step from room temperature to 196 °C corresponds to the loss of water molecules 5.67% (calcd: 5.80%). The second weight loss at 210–430 °C is ascribed to the decomposition of organic ligands 4-dpye and the CrMo6 anions 18.63% (calcd: 18.58%). For complex 2, the TGA curve shows an initial loss of 5.83% (calcd 5.05%) below 229 °C, representing the loss of water molecules. The second weight loss occurs in the temperature range of 242–500 °C, corresponding to the loss of 4-dpye ligands (calcd 20.9%, obsd 19.77%).
Electrochemical properties
In order to investigate the electrochemical properties, the title complexes bulk-modified CPEs are the optimal choice, owing to their insolubility in classical solvents. Because the electrochemical behaviors of the title complexes are similar except for some slight potential shift, complex 1 was taken as an example. The electrochemical behaviors of 1–CPE in 0.1 M H2SO4 + 0.5 M Na2SO4 aqueous solution at different scan rates are presented in Fig. 3. 1–CPE displays two pairs of reversible redox peaks in the potential range of 500 to −100 mV, and the mean peak potentials E1/2 = (Epa + Epc)/2 are 176 mV (I–I′) and 54 mV (II–II′), which belong to two consecutive two-electron redox processes of Mo centers of CrMo6 polyoxoanions in complex 1.26 All the cathodic peak potentials shift toward the negative direction gradually, while the corresponding anodic peak potentials shift to the positive direction with the increasing of the scan rates. The peak currents are proportional to the scan rates up to 500 mV s−1, showing that the redox process of 1–CPE is surface-controlled.
 |
| Fig. 3 Cyclic voltammograms of the 1–CPE in 0.1 M H2SO4 + 0.5 M Na2SO4 aqueous solution at different scan rates (from inner to outer: 40, 80, 120, 160, 200, 250, 300, 350, 400, 450, 500 mV s−1). Insert: the dependence of cathodic peak and anodic peak currents on scan rates of 1–CPE. | |
It is well known that POMs usually show active electrocatalytic properties in the reduction process of nitrite, peroxide, and other substances in aqueous solution.27 In this paper, we investigated the electrocatalytic activities of 1–CPE toward the reduction of hydrogen peroxide and bromate in 0.1 M H2SO4 + 0.5 M Na2SO4 aqueous solution. As shown in Fig. 4, with the addition of hydrogen peroxide and bromate, the reduction peak currents of 1–CPE increase gradually and the corresponding oxidation peak currents gradually decrease. On the other side, no obvious voltammetric response is observed at the bare CPE in the presence of hydrogen peroxide and bromate in the same potential range, suggesting that the reduction is electrocatalyzed by the reduced species of the CrMo6 anions in 1. The results indicate that 1–CPE shows good electrocatalytic activities toward the reduction of hydrogen peroxide and bromate.
 |
| Fig. 4 Cyclic voltammograms of 1–CPE in 0.1 M H2SO4 + 0.5 M Na2SO4 aqueous solution containing 0.0–12.0 mM H2O2/KBrO3. Scan rate: 40 mV s−1. | |
Optical band gaps
To evaluate the semiconductor behaviors and photocatalysis activities of complexes 1-2, the diffuse reflection spectra of complexes 1-2 were carried out in the crystalline state at room temperature (see Fig. 5, as well as Fig. S6 in the ESI†). The band gaps (Eg) of complexes 1-2 were obtained from the Kubelka–Munk (K–M) function F vs. E,28 which are estimated to be 2.83 eV for 1 and 2.99 eV for 2, respectively. The band gap values indicate that complexes 1-2 may respond to UV irradiation and have the potential capacity for photocatalytic reactions.29
 |
| Fig. 5 Diffuse reflection spectra of Kubelka–Munk (K–M) function versus energy (eV) of complexes 1-2. | |
Photocatalytic activity of 1
Several classical POM complexes have been shown to act as efficient photocatalysts towards the degradation of some organic dyes under UV irradiation.30 Herein, we selected methylene blue (MB), Congo Red (CR) and rhodamine B (RhB) as model pollutants in aqueous media to evaluate the photocatalytic effectiveness of the title complexes under UV irradiation. Firstly, we investigated the photocatalytic performance of complex 1 for the degradation of MB/CR/RhB with UV light irradiation from a 125 W Hg lamp. The photocatalytic performance is investigated through a typical process: 50 mg of the sample was dispersed in the MB/CR/RhB solution and stirred in the dark for 30 min to ensure the equilibrium of the working solution. The solution was then exposed to UV irradiation from an Hg lamp and kept under continuous stirring, and the supernatant of the MB/CR/RhB solution was taken out every 15 min for analyses. As shown in Fig. 6a and b, the absorption peaks of MB and CR decreased obviously with increasing reaction time for complex 1. Changes in C/C0 of MB/CR solutions versus reaction time were plotted in Fig. S7.† The calculation results show that the conversion rates of MB and CR are 95.3% and 77.4% under UV irradiation for 1, respectively. However, as shown in Fig. 6c, the UV-vis spectroscopic results show that the removal of RhB dyes is almost negligible for 1, which indicates that 1 shows good photocatalysis selectivity for the MB and CR.
 |
| Fig. 6 Absorption spectra of the MB/CR/RhB solution during the decomposition reaction under UV irradiation at the presence of complex 1. | |
Photocatalysis and adsorption of 2
In recent decades, much attention has been paid to applying POMs and related composites in photocatalytic degradation of organic dyes. However, some complexes exhibit poor degradability due to their structural limits. Thus, from the recycling point of view, it is more attractive and challenging to explore the capture ability to separate different organic dyes using POM composites. In this work, we also investigated the photocatalytic performance of complex 2 for the degradation of MB/CR/RhB with UV light irradiation from a 125 W Hg lamp. As shown in Fig. 7a and b, the absorption peaks of MB and CR decreased obviously with increasing reaction time for complex 2. The calculation results show that the conversion rates of MB and CR are 96.9% and 98.9% under UV irradiation for 2, respectively. It is very exciting that after the photodegradation experiments of MB/CR under UV irradiation, the colour of the final powder solid of complex 2 recycled by filtration has became blue and red (Fig. S9†), respectively, indicates that complex 2 can effectively adsorb MB/CR molecules. However, for complex 1, after photocatalysis the colours of the final powder solid were same as that of as-synthesized crystals of 1, indicating that complex 1 has no adsorption ability for organic dyes. These different results may be due to their different structures between complex 1 and 2. The digital images and UV-vis spectroscopic results show that the removal of RhB is almost negligible for 2 and the colour of the solid obtained by filtration was same as the colour of as-synthesized crystals of 2, indicating that complex 2 has no photocatalysis degradation ability for RhB dye, as shown in Fig. 7c.
 |
| Fig. 7 Absorption spectra of the MB/CR/RhB solution during the decomposition reaction under UV irradiation and adsorption in darkness at the presence of complex 2. | |
To fully evaluate the adsorption ability of MB and CR on complex 2, 50 mg of 2 was dispensed into 100 mL MB/CR solution with the concentrations of 10 mg L−1 for MB and 100 mg L−1 for CR under stirring in the dark at room temperature, and the concentrations of MB/CR solution at a given time interval were monitored with the UV-vis spectrum until the concentration was not changed. The dye adsorption amount qt (mg g−1) was calculated by: qt = (C0 − Ct)V/W. Where, C0 and Ct (mg L−1) are the liquid phase concentration of dyes at the beginning and after a given time t (min), respectively. V (L) is the volume of the solution, and W (g) is the mass of the sample used. The adsorption abilities of complex 2 toward these dyes were determined by UV-vis spectroscopy. As shown in Fig. 7d and e, after 72 h and 5 h, 2 reaches the maximum uptake of 18.6 mg g−1 and 199 mg g−1 for MB/CR in dark, respectively (Fig. S8†). No adsorption of RhB was observed after 72 h in dark (Fig. 7f). The adsorption selectivity of 2 towards organic dyes may be related to structures of both 2 and dye molecules.
To confirm the adsorption mechanism, dye-releasing experiments were performed in pure DMF and NaCl-containing DMF solution, respectively. As shown in Fig. 8, the colorless solution gradually changes to blue or red, and the UV-vis absorption intensity of MB/CR increases along with the releasing time in NaCl-containing DMF solution. At the same time, the color of the crystals comes back to the original blue (Fig. S10†). The above results indicate that the dye molecules can release from complex 2 in the presence of Na+ cations. In contrast, the dye molecules are difficult to be released in pure DMF as shown in Fig. S11.†
 |
| Fig. 8 UV-vis absorption curves of MB (a) and CR (b) releasing from complex 2 in NaCl-containing DMF solution. | |
Conclusions
In this work, two novel POM-based MOCs with different networks constructed from a bis-pyridyl-bis-amide ligand and CrMo6 polyoxoanions have been hydrothermally synthesized in one pot within the pH range of 2.5–4.0. Complex 1 possesses good photocatalysis activity and selectivity for the degradation of organic dyes MB and CR, while complex 2 shows not only good photocatalysis activity and selectivity for the degradation of organic dyes MB and CR, but also excellent adsorption selectivity for CR, which confirm that the properties of target complexes are largely determined by their structures. In addition, the title complexes exhibit electrochemical properties and may be potential candidates as multifunctional materials. Further work for preparing novel POM-based MOCs constructed from other bis-pyridyl-bis-amide ligands and POMs with novel topological networks and interesting properties is in progress.
Acknowledgements
We thank the National Natural Science Foundation of China (No. 21471021, 21501013, 21401010) and Program for Distinguished Professor of Liaoning Province (No. 2015399) for support.
Notes and references
-
(a) J. Zhou, J. W. Zhao, Q. Wei, J. Zhang and G. Y. Yang, J. Am. Chem. Soc., 2014, 136, 5065 CrossRef CAS PubMed;
(b) X. B. Han, Z. M. Zhang, T. Zhang, Y. G. Li, W. B. Lin, W. S. You, Z. M. Su and E. B. Wang, J. Am. Chem. Soc., 2014, 136, 5359 CrossRef CAS PubMed;
(c) A. V. Anyushin, A. I. Smolentsev, D. A. Mainichev, C. Vicent, A. L. Gushchin, M. N. Sokolov and V. P. Fedin, Chem. Commun., 2014, 50, 9083 RSC;
(d) T. Ueda, M. Ohnishi, M. Shiro, J. I. Nambu, T. Yonemura, J. F. Boas and A. M. Bond, Inorg. Chem., 2014, 53, 4891 CrossRef CAS PubMed.
-
(a) K. Suzuki, F. Tang, Y. Kikukawa, K. Yamaguchi and N. Mizuno, Angew. Chem., Int. Ed., 2014, 126, 1 CrossRef;
(b) B. S. Bassil, M. Ibrahim, R. Al-Oweini, M. Asano, Z. X. Wang, J. V. Tol, N. S. Dalal, K. Y. Choi, R. N. Biboum, B. Keita, L. Nadjo and U. Kortz, Angew. Chem., Int. Ed., 2011, 50, 1 CrossRef PubMed;
(c) Y. L. Zhong, W. Ng, J. X. Yang and K. P. Loh, J. Am. Chem. Soc., 2009, 131, 18293 CrossRef CAS PubMed.
-
(a) Y. Zhu, P. Yin, F. P. Xiao, D. Li, E. Bitterlich, Z. C. Xiao, J. Zhang, J. Hao, T. B. Liu, Y. Wang and Y. G. Wei, J. Am. Chem. Soc., 2013, 135, 17155 CrossRef CAS PubMed;
(b) Z. M. Zhang, S. Yao, Y. G. Li, H. H. Wu, Y. H. Wang, M. Rouzieres, R. Clerac, Z. M. Su and E. B. Wang, Chem. Commun., 2013, 49, 2515 RSC;
(c) L. Yang, P. T. Ma, Z. Zhou, J. P. Wang and J. Y. Niu, Inorg. Chem., 2013, 52, 8285 CrossRef CAS PubMed;
(d) P. J. Hagrman, D. Hagrman and J. Zubieta, Angew. Chem., Int. Ed., 1999, 38, 2638 CrossRef;
(e) D. Y. Du, J. S. Qin, S. L. Li, Z. M. Su and Y. Q. Lan, Chem. Soc. Rev., 2014, 43, 4615 RSC.
-
(a) F. J. Ma, S. X. Liu, C. Y. Sun, D. D. Liang, G. J. Ren, F. Wei, Y. G. Ya and Z. M. Su, J. Am. Chem. Soc., 2011, 133, 4178 CrossRef CAS PubMed;
(b) X. F. Kuang, X. Y. Wu, R. M. Yu, J. P. Donahue, J. S. Huang and C. Z. Lu, Nat. Chem., 2010, 2, 461 CrossRef CAS PubMed.
-
(a) S. T. Zheng, J. Zhang, X. X. Li, W. H. Fang and G. Y. Yang, J. Am. Chem. Soc., 2010, 132, 15102 CrossRef CAS PubMed;
(b) H. Y. An, E. B. Wang, D. R. Xiao, Y. G. Li, Z. M. Su and L. Xu, Angew. Chem., Int. Ed., 2006, 45, 904 CrossRef CAS PubMed.
-
(a) H. D. Zhang, P. Deria, O. K. Farha, J. T. Hupp and R. Q. Snurr, Energy Environ. Sci., 2015, 8, 1501 RSC;
(b) F. Y. Yi, W. Zhu, S. Dang, J. P. Li, D. Wu, Y. H. Li and Z. M. Sun, Chem. Commun., 2015, 51, 3336 RSC;
(c) X. J. Dui, W. B. Yang, X. Y. Wu, X. F. Kuang, J. Z. Liao, R. M. Yu and C. Z. Lu, Dalton Trans., 2015, 44, 9496 RSC;
(d) J. Lu, J. X. Lin, X. L. Zhao and R. Cao, Chem. Commun., 2012, 48, 669 RSC.
-
(a) H. T. Evans, J. Am. Chem. Soc., 1948, 70, 1291 CrossRef CAS;
(b) H. T. Evans, Acta Crystallogr., Sect. B: Struct. Crystallogr. Cryst. Chem., 1974, 30, 2095 CrossRef;
(c) J. S. Anderson, Nature, 1937, 140, 850 CrossRef CAS;
(d) C. Allain, S. Favette, L. M. Chamoreau, J. Vaissermann, L. Ruhlmann and B. Hasenknopf, Eur. J. Inorg. Chem., 2008, 3433 CrossRef CAS.
-
(a) V. Shivaiah, M. Nagaraju and S. K. Das, Inorg. Chem., 2003, 42, 6604 CrossRef CAS PubMed;
(b) H. Y. An, Y. G. Li, E. B. Wang, D. R. Xiao, C. Y. Sun and L. Xu, Inorg. Chem., 2005, 44, 6062 CrossRef CAS PubMed;
(c) H. Y. An, D. R. Xiao, E. B. Wang, Y. G. Li, X. L. Wang and L. Xu, Eur. J. Inorg. Chem., 2005, 2005, 854 CrossRef.
- J. W. Zhang, Y. C. Huang, J. Zhang, S. She, J. Hao and Y. Q. Wei, Dalton Trans., 2014, 43, 2722 RSC.
- Y. Hu, H. Y. An, X. Liu, J. Q. Yin, H. L. Wang, H. Zhang and L. Wang, Dalton Trans., 2014, 43, 2488 RSC.
-
(a) B. K. Tripuramallu and S. K. Das, Cryst. Growth Des., 2013, 13, 2426 CrossRef CAS;
(b) J. H. Liao, J. S. Juang and Y. C. Lai, Cryst. Growth Des., 2006, 6, 354 CrossRef CAS;
(c) J. X. Meng, Y. Lu, Y. G. Li, H. Fu and E. B. Wang, Cryst. Growth Des., 2009, 9, 4116 CrossRef CAS.
-
(a) Y. Q. Lan, S. L. Li, X. L. Wang, K. Z. Shao, D. Y. Du, H. Y. Zang and Z. M. Su, Inorg. Chem., 2008, 47, 8179 CrossRef CAS PubMed;
(b) H. Fu, Y. G. Li, Y. Lu, W. L. Chen, Q. Wu, J. X. Meng, X. L. Wang, Z. M. Zhang and E. B. Wang, Cryst. Growth Des., 2011, 11, 458 CrossRef CAS;
(c) P. P. Zhang, J. Peng, H. J. Pang, J. Q. Sha, M. Zhu, D. D. Wang, M. G. Liu and Z. M. Su, Cryst. Growth Des., 2011, 11, 2736 CrossRef CAS.
-
(a) J. Q. Sha, M. T. Li, J. W. Sun, Y. N. Zhang, P. F. Yan and G. M. Li, Dalton Trans., 2013, 42, 7803 RSC;
(b) A. X. Tian, J. Ying, J. Peng, J. Q. Sha, H. J. Pang, P. P. Zhang, Y. Chen, M. Zhu and Z. M. Su, Cryst. Growth Des., 2008, 8, 3717 CrossRef CAS.
-
(a) M. G. Liu, P. P. Zhang, J. Peng, H. X. Meng, X. Wang, M. Zhu, D. D. Wang, C. L. Meng and K. Alimaje, Cryst. Growth Des., 2012, 12, 1273 CrossRef CAS;
(b) X. L. Wang, H. L. Hu, G. C. Liu, H. Y. Lin and A. X. Tian, Chem. Commun., 2010, 46, 6485 RSC.
- H. Zhang, K. Yu, J. H. Lv, L. H. Gong and C. M. Wang, Inorg. Chem., 2015, 54, 6744 CrossRef CAS PubMed.
- X. L. Wang, Z. H. Chang, H. Y. Lin, A. X. Tian, G. C. Liu and J. W. Zhang, Dalton Trans., 2014, 43, 12272 RSC.
- H. W. Hou, Y. L. Song, H. Xu, Y. L. Wei, Y. T. Fan, Y. Zhu, L. K. Li and C. X. Du, Macromolecules, 2003, 36, 999 CrossRef CAS.
- K. Nomiya, T. Takahashi and T. Shirai, Polyhedron, 1987, 6, 213 CrossRef CAS.
- X. L. Wang, Z. H. Kang, E. B. Wang and C. W. Hu, Mater. Lett., 2002, 56, 393 CrossRef CAS.
- G. M. Sheldrick, Acta Crystallogr., Sect. A: Found. Crystallogr., 2008, 64, 112 CrossRef CAS PubMed.
- A. X. Tian, Y. L. Ning, J. Ying, J. W. Zhang, X. Hou, T. J. Li and X. L. Wang, Dalton Trans., 2015, 44, 10499 RSC.
- I. D. Brown and D. Altermatt, Acta Crystallogr., Sect. B: Struct. Sci., 1985, 41, 244 CrossRef.
- M. Yu, B. Gao and D. D. Liang, J. Cluster Sci., 2014, 25, 377 CrossRef CAS.
- E. Hakan, Y. Z. Okan and A. Mursel, Cryst. Growth Des., 2015, 15, 3201 Search PubMed.
- A. X. Tian, J. Ying, J. Peng, J. Q. Sha, H. J. Pang, P. P. Zhang, Y. Chen, M. Zhu and Z. M. Su, Cryst. Growth Des., 2008, 8, 3717 CAS.
-
(a) X. D. Du, C. H. Li, Y. Zhang, S. Liu, Y. Ma and X. Z. You, CrystEngComm, 2011, 13, 2350 RSC;
(b) X. L. Wang, E. B. Wang, Y. Lan and C. W. Hu, Electroanalysis, 2002, 14, 1116 CrossRef CAS;
(c) S. M. Wang, W. L. Chen and E. B. Wang, J. Cluster Sci., 2010, 21, 133 CrossRef CAS;
(d) W. L. Zhou, J. Liang, C. Qin, K. Z. Shao, F. M. Wang and Z. M. Su, CrystEngComm, 2014, 16, 7410 RSC.
- A. Dolbecq, P. Mialane, B. Keita and L. Nadjo, J. Mater. Chem., 2012, 22, 24509 RSC.
- J. I. Pankove, Optical Processes in Semiconductors, Prentice-Hall, Inc., Englewood Cliffs, NJ, 1971, p. 34 Search PubMed.
-
(a) T. Wen, D. X. Zhang and J. Zhang, Inorg. Chem., 2013, 52, 12 CrossRef CAS PubMed;
(b) M. C. Das, H. Xu, Z. Y. Wang, G. Srinivas, W. Zhou, Y. F. Yue, V. N. Nesterov, G. D. Qian and B. L. Chen, Chem. Commun., 2011, 47, 11715 RSC;
(c) W. Q. Kan, B. Liu, J. Yang, Y. Y. Liu and J. F. Ma, Cryst. Growth Des., 2012, 12, 2288 CrossRef CAS.
- E. D. Koutsouroubi, A. K. Xylouri and G. S. Armatas, Chem.
Commun., 2015, 51, 4481 RSC.
Footnote |
† Electronic supplementary information (ESI) available: IR Spectra, TG, and additional figures. CCDC 1490699 and 1490698. For ESI and crystallographic data in CIF or other electronic format see DOI: 10.1039/c6ra22836d |
|
This journal is © The Royal Society of Chemistry 2016 |
Click here to see how this site uses Cookies. View our privacy policy here.