Study on Fe–Co alloy role over RANEY® Fe–Co bimetallic catalysts in Fischer–Tropsch synthesis
Yongbiao Zhaiab,
Yingying Xueab,
Zheng Chenab,
Min Chenac,
Buhuan Wangab and
Jiangang Chen*a
aState Key Laboratory of Coal Conversion, Institute of Coal Chemistry, Chinese Academy of Sciences, Taiyuan, 030001, P. R. China. E-mail: Chenjg@sxicc.ac.cn
bUniversity of Chinese Academy of Sciences, Beijing, 100049, P. R. China
cCollege of Environmental Engineering, Shanghai University, Shanghai, 200444, P. R. China
First published on 10th October 2016
Abstract
To further understand the role of Fe–Co alloys in Fischer–Tropsch synthesis, a series of RANEY® Fe–Co mono/bimetallic catalysts were prepared through alkali leaching solidified Fe–Co–Al alloy. There are three advantages about these catalysts: (i) RANEY® structure can provide certain surface area for catalytic reaction; (ii) these catalysts avoid the influence of the metal–support interaction due to the absence of support; (iii) the composition of active phase can be determined easily. The FT results showed that not all the Fe–Co alloy could enhance the C5+ selectivity, only when the ratio of Fe/Co is 3![[thin space (1/6-em)]](https://www.rsc.org/images/entities/char_2009.gif) :
:![[thin space (1/6-em)]](https://www.rsc.org/images/entities/char_2009.gif) 7 can C5+ selectivity be promoted effectively. Besides, we also found that Fe–Co alloy did not show intended synergy effects on the FT activity, instead, Co-dominant catalysts exhibited a higher CO conversion.
7 can C5+ selectivity be promoted effectively. Besides, we also found that Fe–Co alloy did not show intended synergy effects on the FT activity, instead, Co-dominant catalysts exhibited a higher CO conversion.
1. Introduction
Fischer–Tropsch (FT) synthesis is a heterogeneous catalytic process that converts syngas (CO and H2) into a wide variety of hydrocarbons.1,2 Syngas can be produced from fossil and renewable feedstocks, such as natural gas, coal and biomass. Generally, the hydrocarbon products of FT synthesis contain value-added chemicals (C2![[double bond, length as m-dash]](https://www.rsc.org/images/entities/char_e001.gif) –C4
–C4![[double bond, length as m-dash]](https://www.rsc.org/images/entities/char_e001.gif) ) and clean liquid fuels (gasoline and diesel).3–5 They could be considered as a real alternative to traditional fuels from crude oil. Therefore, FT synthesis has received much renewed interest in recent years. In previous studies on the catalysts for FT synthesis, bimetallic catalysts have been investigated in detail but the obtained results were rather confusing.6 Ma et al. reported an enhanced activity for bimetallic catalysts compared to monometallic catalysts,7 while Duvenhage reported an opposite trend.8 Besides, the contradictory results on the selectivity were also reported in some literature reports.9,10
) and clean liquid fuels (gasoline and diesel).3–5 They could be considered as a real alternative to traditional fuels from crude oil. Therefore, FT synthesis has received much renewed interest in recent years. In previous studies on the catalysts for FT synthesis, bimetallic catalysts have been investigated in detail but the obtained results were rather confusing.6 Ma et al. reported an enhanced activity for bimetallic catalysts compared to monometallic catalysts,7 while Duvenhage reported an opposite trend.8 Besides, the contradictory results on the selectivity were also reported in some literature reports.9,10
Iron and cobalt are the typical active metals used in FT synthesis. Co-Based catalysts show high catalytic activity and are suitable for the production of long-chain paraffins.11 The comparatively less expensive Fe-based catalysts exhibit high selectivity toward lower olefins and catalyze the water gas shift (WGS) reaction, which can be used to adjust H2/CO ratio in syngas and make the FT synthesis more flexible to different types of feedstocks.12 We therefore focus on bimetallic Fe–Co catalysts in this work. In most studies on bimetallic systems, Fe–Co active phase was dispersed on the surface of supports through a variety of methods.13–16 Supported catalysts displayed high specific surface area and enhanced dispersion of active phase. However, numerous researches on supported catalysts met limited success because of the presence of strong metal–support interaction that prevented the reduction of oxide precursor.17,18 Ma et al. had observed that the performance of Fe–Co catalysts depended on the type of support materials used.7 Support materials such as SiO2, TiO2 and MgO have been shown to react with Fe or Co to give Co2SiO4, Co2TiO4 and FeO–MgO during catalysts preparation, thermal treatment or catalytic reaction. Unfortunately, these mixed compounds are not active in FT synthesis.19 In this case, carbonaceous materials are widely used as a promising support, but there are still some uncertainties. It is difficult to determine the active phase because Fe, Co or Fe–Co alloy may be coexistent in the catalysts.20–22
To avoid these shortcomings, RANEY® Fe–Co catalysts were prepared in this work through alkali leaching of a rapid quenched (Fe1−xCox)50Al50 alloy. Firstly, RANEY® structure can provide a large surface area for catalytic reaction;23,24 secondly, these catalysts effectively prevent the effect of metal–support interaction due to the absence of support; thirdly, the Fe–Co alloy can be formed easily during the high-temperature melting stage. Besides, the rapid quenching could produce refined and uniform microstructures, which lead to improvements in catalytic performance. Fan et al. had shown that Fe–Mn catalysts leached from rapid quenched Fe–Mn–Al alloy displayed superior activity, selectivity to alkenes and longer hydrocarbons.25
2. Experimental section
2.1 Catalyst preparation
The ternary (Fe1−xCox)50Al50 alloys were prepared by vacuum induction technique. The prescribed amounts of metallic Fe, Co and Al powders were melted and held at 1400 °C in a vacuum induction furnace for 1 h to ensure the homogeneity of melt. The molten material was then quenched in water. Subsequently, the brittle alloy were ground and sieved, and the 60–80 mesh fractions were used throughout the study.The bimetallic Fe–Co catalysts were prepared by adding Fe–Co–Al alloy into the NaOH solution (6.0 mol L−1) at 70 °C for alkali leaching. The black powders were washed thoroughly with distilled water and absolute ethanol. The as-prepared catalysts were stored in ethanol before characterization and catalytic testing.
2.2 Characterization
X-ray diffractometer was employed to analyze the XRD profiles of as-prepared mono/bimetallic RANEY® Fe1−xCox (R-Fe1−xCox) catalysts. The XRD patterns were obtained on a DX-2700 diffractometer using Cu Kα radiation (λ = 0.1538 nm) and the scanning range was 30–90°. The compositions of all the catalysts were determined by inductively coupled plasma optical emission spectrometer (ICP-OES). The BET surface area (SBET), pore volume (Vpore), and average pore size (Dpore) were tested via N2 physical adsorption at −196 °C using a Micromeritics ASAP 2420 instrument. All the samples were degassed under vacuum before measurement. The morphology of catalysts was investigated by scanning electron microscope (SEM, JSM-6701F, Japan).2.3 Catalytic testing
The performance of FTS was evaluated on a fixed-bed equipped with a stainless steel tubular reactor. Prior to the FTS reaction, the as-prepared catalysts were heated at 100 °C for 2 h under flowing H2 (GHSV = 2000 h−1, P = 2 bar) to remove ethanol, which isolate the catalysts and air during catalyst loading. After that, the catalysts were cooled down to room temperature, a flow of syngas was fed into the catalysts and the temperature was increased to 240 °C for as-prepared catalysts. During the testing, the pressure of syngas was maintained at 20 bar.The reaction products passed through a 130 °C hot trap and a 5 °C cold trap at working pressure, and then the gaseous products were analyzed on-line by gas chromatography (GC 920). A carbon molecular sieve column connected with a thermal conductivity detector was used to separate and quantify H2, N2, CH4, CO and CO2, whereas C1–C8 hydrocarbons were separated in a capillary Porapack-Q column and detected in a flame ionization detector.
3. Results and discussion
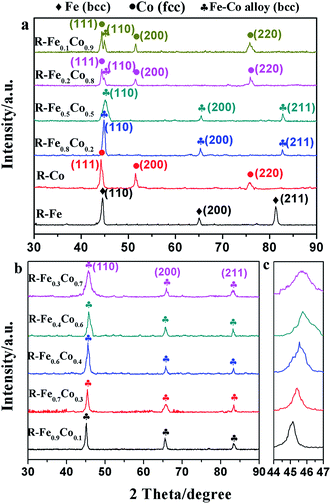
The XRD patterns of mono/bimetallic R-Fe1−xCox catalysts are shown in Fig. 1. For the monometallic R-Fe catalyst, the peaks of 44.7, 65.1 and 82.3° may correspond to metallic iron [PDF no. 06-0696]. In the case of monometallic R-Co sample, the diffraction peaks at 2θ value of 44.2, 51.5 and 75.9° can be corresponding to metallic cobalt [PDF no. 15-0806]. For the bimetallic RANEY® catalysts (x range from 0.1 to 0.7), metallic Co diffraction peaks disappeared completely and Fe diffraction peaks shifted to the higher angle zone (2θ = 45.2, 65.7 and 83.2°), which implied that Co was homogeneously dispersed and Fe–Co alloys were formed [PDF no. 50-0795]. However, in the patterns of R-Fe0.2Co0.8 and R-Fe0.1Co0.9 catalysts not only the diffraction peaks of Co appeared at 2θ value of 44.2, 51.5 and 75.9°, but also the characteristic diffractions of Fe–Co alloy phase appeared at 45.2°. According to the Fe–Co binary phase diagram,26 the solid solubility of Co in Fe is about 70 atom%, thus metallic Co can be separate out from the melt with decreasing temperature when the Co content is greater than 70 atom%. The similar results can be seen in other literatures.27 | ||
| Fig. 1 (a and b) XRD patterns of the mono/bimetallic RANEY® Fe1−xCox catalysts. (c) Amplified XRD patterns of the RANEY® Fe1−xCox catalysts near 2θ = 45°. | ||
Fig. 1c shows amplified XRD patterns of the R-Fe1−xCox catalysts (x range from 0.1 to 0.07) near 2θ = 45°, in which an obvious shift toward higher angle zone can be found with the increase of Co content. This can be attributed to the difference in atomic radius between Fe and Co, since the atomic radius of Co is smaller than that of Fe.
The bulk compositional and textural properties of as-prepared mono/bimetallic R-Fe1−xCox catalysts are summarized in Table 1. After alkali leaching, the Al content decreased drastically from 50% to no more than 4.5%, which agrees to the disappearance of Fe–Co–Al phase in Fig. 1. Although these catalysts were prepared by the same experimental method, the content of Co significantly influenced the surface area and crystallite size. As inferred from Table 1, the surface area rises from 29.6 m2 g−1 to 57.5 m2 g−1 when the Co content increases from 0 to 90%, while the mean crystallite size decreases from 16.9 nm to 12.6 nm. This trend has also been reported elsewhere.6 For example, the studies on FeCo catalysts reported a decrease in particle size for bimetallic catalysts compare to the monometallic catalysts, and particle size decreased with the increase of Co content.
| Catalyst | Ala wt% | SBET (m2 g−1) | Vpore (cm3 g−1) | Dpore (nm) | dFe–Cob (nm) |
|---|---|---|---|---|---|
| a Bulk composition determined by ICP-OES analysis.b Mean crystallite size calculated from the XRD of Fe(110), Co(111) and Fe–Co(110) using the Scherrer equation. | |||||
| R-Fe | 3.9 | 29.6 | 0.121 | 19.9 | 16.9 |
| R-Fe0.8Co0.2 | 3.7 | 37.1 | 0.149 | 16.4 | 16.1 |
| R-Fe0.5Co0.5 | 4.4 | 46.7 | 0.196 | 12.7 | 14.8 |
| R-Fe0.3Co0.7 | 4.0 | 51.8 | 0.209 | 12.1 | 13.5 |
| R-Fe0.2Co0.8 | 3.7 | 55.3 | 0.214 | 11.8 | 13.1 |
| R-Fe0.1Co0.9 | 3.3 | 57.5 | 0.253 | 11.5 | 12.6 |
| R-Co | 4.1 | 31.4 | 0.155 | 19.8 | 15.6 |
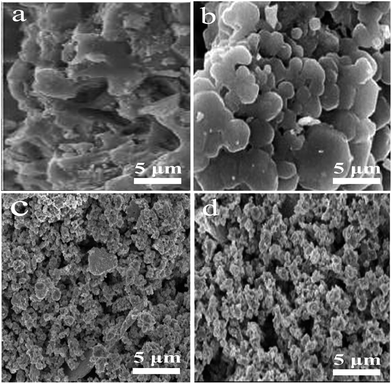
The catalysts were also characterized by SEM, and the typically SEM micrographs were presented in Fig. 2. Compared to the spongy morphology of RANEY® Fe and Co (Fig. 2a and b) characteristic, we note that the average particle size of bimetallic R-Fe0.2Co0.8 and Fe0.1Co0.9 (Fig. 2c and d) decreases obviously with the increase of Co content. This trend is consistent with the results of average crystallite size in Table 1.
 | ||
| Fig. 2 Representative SEM micrographs of RANEY® Fe (a), RANEY® Co (b), RANEY® Fe0.2Co0.8 (c) and RANEY® Fe0.1Co0.9 (d). | ||
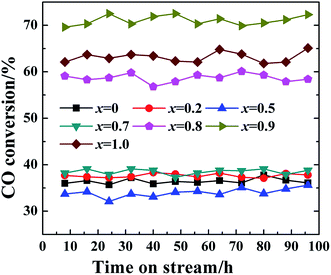
The catalytic performance of mono/bimetallic R-Fe1−xCox catalysts were evaluated by using a fixed-bed reactor at 240 °C and 20 bar (GHSV = 2000 h−1, H2/CO = 2). The CO conversion of the catalysts as a function of time on stream is presented in Fig. 3. It was observed that all the catalysts investigated in this study were stable within 100 h. For the monometallic catalysts, R-Co has a higher CO conversion than that of R-Fe under the same reaction conditions. This result was consistent with available literature data. For the bimetallic catalysts, the addition of Co (x ≤ 0.7) to Fe-based catalysts did not yield any drastic effect on CO conversion compared to the monometallic R-Fe catalyst. This result suggests that Fe–Co alloy does not possess any additive properties compared to the pure Fe catalysts. This observation is agreement with conclusions drawn from other literature studies.16,20 Notably, Co-rich samples (x ≥ 0.8) significantly improved the CO conversion, and the R-Fe0.1Co0.9 sample had the highest conversion (72.5%) among all the catalysts. According to the foregoing discussions, Co could be separated out from supersaturated Fe0.1Co0.9 melt (Fe0.1Co0.9 → 2/3Co + 1/3Fe0.3Co0.7), thus we can assume that the structure of supersaturated Fe0.1Co0.9 may similar to the Fe0.3Co0.7-supported Co catalyst. Besides, the average crystallite size of precipitated-Co is smaller than that of monometallic R-Co and the surface area is larger than monometallic R-Co (Table 1). These combined factors result in the highest CO conversion of R-Fe0.1Co0.9.28 The similar results has also been demonstrated elsewhere.9
 | ||
| Fig. 3 CO conversion as a function of time in FT synthesis for the mono/bimetallic RANEY® Fe1−xCox catalysts (T = 240 °C, P = 20 bar, GHSV = 2000 h−1, H2/CO = 2). | ||
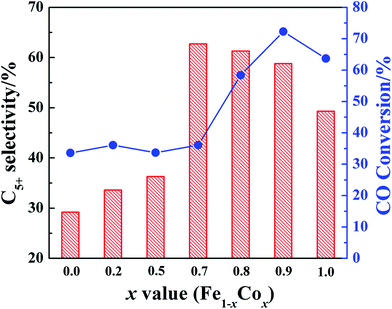
The steady-state CO conversions and product selectivity of mono/bimetallic R-Fe1−xCox catalysts are summarized in Table 2. C5+ selectivity and CO conversion are shown in Fig. 4. As expected, monometallic R-Fe exhibited comparatively lower selectivity to C5+ hydrocarbons than that of R-Co catalyst. Monometallic Co catalysts can be typically evaluated in the temperature range of 220 °C to 240 °C to achieve a high selectivity to long-chain paraffins. But the Fe catalysts need alkali metal promoters to enhance the long-chain hydrocarbons selectivity. For the bimetallic R-Fe1−xCox catalysts, the selectivity of C5+ hydrocarbons increased slightly with the increase of Co content when the value of x is smaller than 0.7. Surprisingly, the selectivity of C5+ hydrocarbons rises sharply to 62.7% from 33.3% when the value of x is 0.7, and the relatively high selectivity (55–62%) is maintained when the value of x is greater than 0.7. These results indicated that not all the Fe–Co alloy can enhance the C5+ selectivity effectively. In fact, the ratio of Fe/Co is very critical in Fe–Co alloy. On the basis of our results, Fe0.3Co0.7 is the most crucial phase to enhance the selectivity of C5+ hydrocarbons. Coville and co-worker also reported that Co2Fe alloy may be the main component to improve the selectivity of long-chain paraffins.29 Combining CO conversion and C5+ selectivity, R-Fe0.2Co0.8 and R-Fe0.1Co0.9 displayed the best catalytic performance, because their C5+ selectivity was about 60% and CO conversion remained at a high level (58.4% and 72.5%).
| Catalyst | CO conversion (%) | Hydrocarbon selectivity (%) | CO2 selectivity (%) | ||
|---|---|---|---|---|---|
| CH4 | C2–C4 | C5+ | |||
| R-Fe | 33.6 | 25.7 | 44.8 | 29.2 | 16.7 |
| R-Fe0.8Co0.2 | 36.1 | 21.3 | 48.1 | 30.6 | 14.3 |
| R-Fe0.5Co0.5 | 33.7 | 20.2 | 43.5 | 33.3 | 12.9 |
| R-Fe0.3Co0.7 | 38.8 | 12.8 | 24.5 | 62.7 | 12.3 |
| R-Fe0.2Co0.8 | 58.4 | 14.7 | 24.0 | 61.3 | 8.5 |
| R-Fe0.1Co0.9 | 72.5 | 17.1 | 24.1 | 58.8 | 5.4 |
| R-Co | 63.7 | 13.9 | 36.8 | 49.3 | 3.8 |
 | ||
| Fig. 4 The steady-state CO conversion (line) and C5+ selectivity (column) on the mono/bimetallic RANEY® Fe1−xCox catalysts (T = 240 °C, P = 20 bar, GHSV = 2000 h−1, H2/CO = 2). | ||
4. Conclusion
A series of mono/bimetallic R-Fe1−xCox catalysts have been prepared successfully by alkali leaching solidified Fe–Co–Al alloy. Powder XRD patterns showed that Co and Fe0.3Co0.7 alloy were coexistent in the bimetallic R-Fe1−xCox (x ≥ 0.8), because Co could be separated out from supersaturated melt, which was encouraged by the solid solubility of Co in Fe (70 atom%). Furthermore, the FT results show that Fe–Co alloy did not exhibit any synergy effect on CO conversion. At the same time, we find that not all the Fe–Co alloy can enhance the C5+ selectivity. Only when the ratio of Fe/Co is 3![[thin space (1/6-em)]](https://www.rsc.org/images/entities/char_2009.gif) :
:![[thin space (1/6-em)]](https://www.rsc.org/images/entities/char_2009.gif) 7 can C5+ selectivity be promoted. As a result, supersaturated R-Fe0.2Co0.8 and R-Fe0.1Co0.9 displayed excellent FT activity as well as C5+ selectivity.
7 can C5+ selectivity be promoted. As a result, supersaturated R-Fe0.2Co0.8 and R-Fe0.1Co0.9 displayed excellent FT activity as well as C5+ selectivity.
Acknowledgements
We gratefully acknowledge the financial support from the National Natural Science Foundation of China (Grant No. 21503256 and 21373254) and the autonomous research project of SKLCC (Grant No. 2013BWZ004).References
- H. Jahangiri, J. Bennett, P. Mahjoubi, K. Wilson and S. Gu, Catal. Sci. Technol., 2014, 4, 2210–2229 CAS.
- O. O. James, B. Chowdhury, M. A. Mesubi and S. Maity, RSC Adv., 2012, 2, 7347–7366 RSC.
- E. Jin, Y. Zhang, L. He, H. G. Harris, B. Teng and M. Fan, Appl. Catal., A, 2014, 476, 158–174 CrossRef CAS.
- Q. Zhang, J. Kang and Y. Wang, ChemCatChem, 2010, 2, 1030–1058 CrossRef CAS.
- P. Mohanty, K. K. Pant, S. N. Naik, J. Parikh, A. Hornung and J. N. Sahu, Renewable Sustainable Energy Rev., 2014, 38, 131–153 CrossRef CAS.
- V. R. Calderone, N. R. Shiju, D. C. Ferré and G. Rothenberg, Green Chem., 2011, 13, 1950–1959 RSC.
- X. Ma, Q. Sun, F. Cao, W. Ying and D. Fang, J. Nat. Gas Chem., 2006, 15, 335–339 CrossRef CAS.
- D. Duvenhage and N. Coville, Appl. Catal., A, 1997, 153, 43–67 CrossRef CAS.
- A. Tavasoli, M. Trepanier, R. M. M. Abbaslou, A. K. Dalai and N. Abatzoglou, Fuel Process. Technol., 2009, 90, 1486–1494 CrossRef CAS.
- S. Logdberg, D. Tristantini, O. Borg, L. Ilver, B. Gevert, S. Jaras, E. A. Blekkan and A. Holmen, Appl. Catal., B, 2009, 89, 167–182 CrossRef.
- X. Peng, K. Cheng, J. Kang, B. Gu, X. Yu, Q. Zhang and Y. Wang, Angew. Chem., 2015, 54, 4553–4556 CrossRef CAS PubMed.
- H. M. Torres Galvis, J. H. Bitter, C. B. Khare, M. Ruitenbeek, A. I. Dugulan and K. P. de Jong, Science, 2012, 335, 835–838 CrossRef CAS PubMed.
- J. Li, G. Jacobs, T. Das, Y. Zhang and B. Davis, Appl. Catal., A, 2002, 236, 67–76 CrossRef CAS.
- T. Mochizuki, T. Hara, N. Koizumi and M. Yamada, Appl. Catal., A, 2007, 317, 97–104 CrossRef CAS.
- M. Boudart, A. Delbouille, J. A. Dumesic, S. Khammouma and H. Topsoe, J. Catal., 1975, 37, 486–502 CrossRef CAS.
- L. F. F. P. G. Bragança, M. Ojeda, J. L. G. Fierro and M. I. P. da Silva, Appl. Catal., A, 2012, 423–424, 146–153 CrossRef.
- M. Qing, Y. Yang, B. Wu, J. Xu, C. Zhang, P. Gao and Y. Li, J. Catal., 2011, 279, 111–122 CrossRef CAS.
- H. Wan, B. Wu, H. Xiang and Y. Li, ACS Catal., 2012, 2, 1877–1883 CrossRef CAS.
- B. Jongsomjit, J. Panpranot and J. G. Goodwin, J. Catal., 2001, 204, 98–109 CrossRef CAS.
- J. A. Díaz, A. Romero, A. M. García-Minguillán, A. Giroir-Fendler and J. L. Valverde, Fuel Process. Technol., 2015, 138, 455–462 CrossRef.
- A. Griboval-Constant, A. Butel, V. V. Ordomsky, P. A. Chernavskii and A. Y. Khodakov, Appl. Catal., A, 2014, 481, 116–126 CrossRef CAS.
- J. A. Díaz, H. Akhavan, A. Romero, A. M. Garcia-Minguillan, R. Romero, A. Giroir-Fendler and J. L. Valverde, Fuel Process. Technol., 2014, 128, 417–424 CrossRef.
- Y. Lu, B. Cao, F. Yu, J. Liu, Z. Bao and J. Gao, ChemCatChem, 2014, 6, 473–478 CrossRef CAS.
- Y. J. Lu, Z. X. Zhang and J. L. Zhou, J. Nat. Gas Chem., 1999, 8, 82–89 CAS.
- J. G. Fan, B. N. Zong, X. X. Zhang, X. K. Meng, X. H. Mu, G. B. Yu, M. H. Qiao and K. N. Fan, Ind. Eng. Chem. Res., 2008, 47, 5918–5923 CrossRef CAS.
- B. D. Cullity and C. D. Graham, Introduction to Magnetic Materials, IEEE Press, 2nd edn, 2009 Search PubMed.
- A. N. Popova, Y. A. Zaharov and V. M. Pugachev, Mater. Lett., 2012, 74, 173–174 CrossRef CAS.
- A. Y. Khodakov, W. Chu and P. Fongarland, Chem. Rev., 2007, 107, 1692–1744 CrossRef CAS PubMed.
- M. W. Dlamini, D. O. Kumi, T. N. Phaahlamohlaka, A. S. Lyadov, D. G. Billing, L. L. Jewell and N. J. Coville, ChemCatChem, 2015, 7, 3000–3011 CrossRef CAS.
| This journal is © The Royal Society of Chemistry 2016 |
