
Pilot-scale open fermentation of food waste to produce lactic acid without inoculum addition†
Juan Wanga,
Ming Gaoa,
Qunhui Wang*ab,
Wenyu Zhangc and
Yoshihito Shiraid
aDepartment of Environmental Engineering, University of Science and Technology Beijing, No. 30, Xueyuan Street, Haidian District, Beijing 100083, China. E-mail: wangqh59@sina.com; Fax: +86-10-62332778; Tel: +86-10-62332778
bBeijing Key Laboratory of Resource-oriented Treatment of Industrial Pollutants, University of Science and Technology Beijing, Beijing 100083, China
cBeijing Municipal Research Institute of Environmental Protection, Beijing, 100037, China
dDepartment of Biological Functions and Engineering, Kyushu Institute of Technology, Kitakyushu 808-0196, Japan
First published on 24th October 2016
Abstract
Lactic acid (LA) production through non-sterilized open fermentation of food waste without inoculum addition was investigated. Results from laboratory-scale experiments indicated that the optimal solid–liquid ratio was 1![[thin space (1/6-em)]](https://www.rsc.org/images/entities/char_2009.gif) :1 (water content 91.7%). Addition of α-amylase could significantly accelerate the hydrolysis of food waste and consequently increase LA productivity. During the pilot-scale fermentation, the highest LA concentration (21.5 g L−1) was achieved at 48 h. After 48 h, the LA concentration decreased and the byproducts (mainly acetic acid and propionic acid) concentration increased, which was likely caused by the increased cell density of microorganisms other than lactic acid bacteria. After 48 h of fermentation, the total sugar and suspended solids concentration decreased by 65.7% and 61.8%, respectively, suggesting that the LA fermentation was beneficial to achieve the harmless reduction of food waste. The results from this study demonstrated the feasibility of LA production from food waste fermentation without sterilization and extra inoculum addition.
:1 (water content 91.7%). Addition of α-amylase could significantly accelerate the hydrolysis of food waste and consequently increase LA productivity. During the pilot-scale fermentation, the highest LA concentration (21.5 g L−1) was achieved at 48 h. After 48 h, the LA concentration decreased and the byproducts (mainly acetic acid and propionic acid) concentration increased, which was likely caused by the increased cell density of microorganisms other than lactic acid bacteria. After 48 h of fermentation, the total sugar and suspended solids concentration decreased by 65.7% and 61.8%, respectively, suggesting that the LA fermentation was beneficial to achieve the harmless reduction of food waste. The results from this study demonstrated the feasibility of LA production from food waste fermentation without sterilization and extra inoculum addition.
Introduction
Food waste is municipal solid waste discharged from households, restaurants and dining halls. According to the Food and Agriculture Organization of the United Nations, about 1.3 billion tons or one-third of all edible food produced for human consumption is discarded globally each year without any further utilization.1 Food waste accounts for roughly 50–70% of municipal solid waste in almost all Chinese large cities,2 and most of it is randomly mixed with other solid waste and ultimately incinerated or landfilled.3 However, the disposal of food waste by these traditional methods may result in increased cost and serious environmental problems, such as water pollution, greenhouse gas emission, and soil degradation due to its high moisture and organic content.Food waste consists mainly of starch, protein, fat, cellulose, and inorganic salts,4 which can be considered as a valuable resource to produce fuels, materials, and chemicals.5 Presently, researches have been performed utilizing food waste as a raw material to produce valuable and marketable products, including bioethanol,6,7 biobutanol,8,9 biohydrogen,10,11 lactic acid (LA),12–14 etc. LA is one of the useful compounds with wide applications in the field of food, cosmetic, pharmaceutical and chemical industries,15 especially for the synthesis of polylactic acid (PLA). PLA is a promising biodegradable, biocompatible, and environmentally friendly alternative to plastics derived from petrochemicals.16 The demand for PLA is ever-increasing in recent years. However, the high production cost of LA has become a barrier for PLA to compete with petrochemical-derived plastics.17 Therefore, food waste, regarded as an accessible, valuable, and renewable materials, have great potential to be used for the production of LA to replace the traditional feedstock such as sugar and starch-based materials.
In most cases, LA fermentation is performed under sterile conditions and with the addition of specific lactic acid bacteria (LAB) species such as Lactobacillus casei and Lactobacillus plantarum.18–20 However, non-sterile open fermentation has many advantages compared with conventional sterile and closed fermentation. For example, non-sterilized open fermentation requires no equipment and energy for sterilization. More importantly, this technique could be conducted on-site at local food waste storage sites instead of transported to centralized processing plants.21 Many researches have been conducted on non-sterilized open fermentation to produce LA with the inoculation of a specific LAB strain.17,22–24 Only few reports have studied the LA production using the indigenous microorganisms existing in the raw material.
In this study, a pilot-scale study on LA production from synthetic food waste by non-sterilized open fermentation without inoculum addition was carried out. To the best of our knowledge, this is the first report on a pilot-scale study on open fermentation of food waste with indigenous microorganisms to produce LA.
Experimental
Materials
In order to obtain reproducible results using materials from different preparations, synthetic food waste was used in the current study following the standard designed by the Building Research Institute in Japan (Table 1).25 The food waste was disintegrated to small particles and stored at −20 °C before use. The food waste contained 45.3% starch, 15.8% protein, 60.8% total sugar based on dry matter. The total solids (TS) and suspended solids (SS) concentration of the synthetic food waste were 18.6% and 15.8%, respectively. The volatile solids (VS)/TS was 93.7%, indicating that the solids in food waste was mostly composed of organic matters and could become an appropriate substrate for LA fermentation.| Substrate | Wet weight (%) | |
|---|---|---|
| Vegetables (36%) | Carrot | 18 |
| Chinese cabbage | 18 | |
| Fruits (30%) | Banana skin | 10 |
| Apple skin and nuclear | 10 | |
| Grape skin | 10 | |
| Fish and meats (20%) | Chicken bone | 8 |
| Fish bone | 10 | |
| Eggshell | 2 | |
| Other (14%) | Rice | 10 |
| Tea leaves | 4 | |
| Total | 100 | |
The α-amylase was purchased from Sigma-Aldrich Co. LLC, with an activity of 50000 U g−1.
Fermentation process
Laboratory-scale fermentation: two sets of laboratory-scale experiments were performed to determine the effect of solid–liquid ratio and α-amylase on LA production. The synthetic food waste (based on wet weight) was mixed with water at different ratios (1:0, 1:1, 1:3, 1:6, and 1:10) to optimize the solid–liquid ratio. 25 U per (g dry matter) of α-amylase was added to explore its influence on LA production. Simultaneous saccharification and fermentation (SSF) of 500 g mixed food waste was performed at 35 °C without pH adjustment, sterilization and LAB inoculation.
Pilot-scale fermentation: 20 kg synthetic food waste and 20 kg water was added to a 90 L fermenter (MSJ-U2W, B. E. Marubishi Co., Ltd., Japan). α-Amylase was added at 25 U per (g dry matter) to the fermentation medium. SSF of the food waste was performed at 35 °C without sterilization and LAB inoculation. The pH was adjusted to 7.0 at each 12 h with 25% aqueous ammonia (stir only when adjusting pH).
Analytical methods
The total sugar and soluble sugar were determined by the phenol sulphuric acid method.26 Dissolved sugar (DS), TS, VS, and SS were measured using standard methods.27 The pH was measured by pH meter (pHS-3C, Shanghai Leici Device Works, Shanghai, China).The concentration of organic acids (lactic, succinic, formic, acetic, propionic and butyric acid) were analyzed using high-performance liquid chromatography (HPLC) (LC-20AT, Shimadzu, Japan) equipped a Shodex SH1011 column (8.0 × 300 mm, Showa Denko K.K., Japan) and a refractive index detector (RID-10A, Shimadzu, Japan). HPLC analysis was performed at the column temperature of 50 °C with 0.5 mM H2SO4 as mobile phase at a flow rate of 1.0 mL min−1 and an injection volume of 20 μL.
The LAB, Clostridium spp., and the total viable cells were counted using bromo cresol-purple plate count agar, Clostridium spp. count agar, and standard method agar, respectively.28 All agar media were purchased from Nissui Pharmaceutical Co., Tokyo, Japan.
Results and discussion
Effect of solid–liquid ratio on non-sterilized LA fermentation
Before solid–liquid ratio optimization, the optimal pH and temperature was found based on laboratory-scale experiment. As shown in Fig. S1 and S2,† the optimal pH and temperature for LA production was 7.0 and 35 °C. As a result, the following experiments were all conducted at 35 °C with an initial pH of 7.0. The LA concentration and yield at different solid–liquid ratios were shown in Fig. 1. The highest LA concentration (43.1 g L−1) was obtained at the solid–liquid ratio of 1:0 after fermentation for 168 h. However, the LA yield at 1:0 (0.25 g g−1 VS) was much lower than that at 1:1 (0.32 g g−1 VS). The low LA yield at 1:0 was likely caused by limited heat and mass transfer at high solid–liquid ratios. While at excessive low solid–liquid ratios, large fermenter is needed and the produced LA concentration is very low, resulting in LA separation difficulties and disposal problem of the wastewater after separation. In order to produce more LA from the same amount of food waste, the optimal solid–liquid ratio was chosen to be 1:1, which corresponding to a water content of 91.7%. Yan et al.29 found that the optimal solid–liquid ratio for the enzymatic hydrolysis of food waste was 1:0.75 (water content 89.8%), which was close to that found in the current study.
 | ||
| Fig. 1 LA concentration (a) and LA yield (b) from food waste at different solid–liquid ratios. | ||
Effect of α-amylase on non-sterilized LA fermentation
In general, addition of α-amylase to the fermentation medium may accelerate the hydrolysis of starch, and thus increases the LA productivity. As shown in Fig. 2, the highest LA concentration of 24.8 g L−1 was achieved at 72 h with α-amylase addition, which was 48 h earlier than that without α-amylase addition. It seems that the highest LA concentration was close whether the α-amylase was added or not. However, the LA productivity for fermentation with α-amylase addition was 0.34 g (L−1 h−1), which was 70% higher than that without. This could be because that the starch cannot be directly used by LAB to produce LA. The starch needed to be hydrolyzed to fermentable sugars before utilization. The α-amylase had promoted the hydrolysis of starch, resulting in much higher soluble sugar concentrations during fermentation (Fig. 2). | ||
| Fig. 2 Effect of α-amylase on LA and soluble sugar concentration. | ||
Pilot-scale non-sterilized fermentation of food waste
The pilot-scale fermentation was performed and repeated five times. The average values were shown in this paper. The production of LA and other organic acids during the fermentation was shown in Fig. 3. The LA concentration reached its maximum (21.5 g L−1) after 48 h of fermentation and decreased thereafter. The concentrations of formic, butyric and succinic acids kept below 1.5 g L−1 during the whole process, while the concentrations of acetic acid and propionic acid were below 2.0 g L−1 before 72 h. The obviously high LA concentration and low byproduct concentrations during the first 48 h indicated that the LAB was the dominant microorganisms in the fermentation medium. After that, the decrease of LA concentration might be caused by inhibition of LAB due to the LA accumulation and the consumption of LA by other microorganisms existing in the fermentation medium. Interestingly, the concentrations of acetic acid and propionic acid increased to 4.2 g L−1 and 5.7 g L−1 from 72 h to 84 h, respectively, while the concentration of LA have a highest decrement at the same period. Due to the lack of sterilization in this study, the microorganisms that can utilize LA as carbon source such as Propionibacterium spp.30 might exist in the medium, causing decreased LA concentration and increased propionic acid and acetic acid concentration. Rodrigues et al.31 also reported that LA can be used by lactic-acid acidogenic microorganisms to produce propionic acid, acetic acids and hydrogen. | ||
| Fig. 3 Changes of organic acids during pilot-scale food waste fermentation. | ||
The pH is an important factor that determines the growth and metabolism of LAB and other microorganisms that exists in the fermentation medium. In this study, the pH was adjusted to 7.0 at each 12 h with 25% ammonia. As shown in Fig. 4, the fast accumulation of LA resulted in a rapid decrease of pH during the first 48 h. Even though the pH was adjusted to 7.0 every 12 h, it then fell quickly to below 5.0 during the first 36 h. Under such low pH, the volatile fatty acids (VFAs, including acetic, propionic, formic, butyric, succinic acids, etc.) could hardly be produced because the optimal pH for VFAs production was approximately 6.0.32 After 48 h, the pH remained relatively stable at 6.0–7.0, which was the optimal pH for most microorganisms including Propionibacterium spp.34 and Clostridium spp, and was also favorable for VFAs production. The proper environmental condition and abundant substrate might accelerate the growth of these microorganisms, leading to the consumption of LA and production of other byproducts.
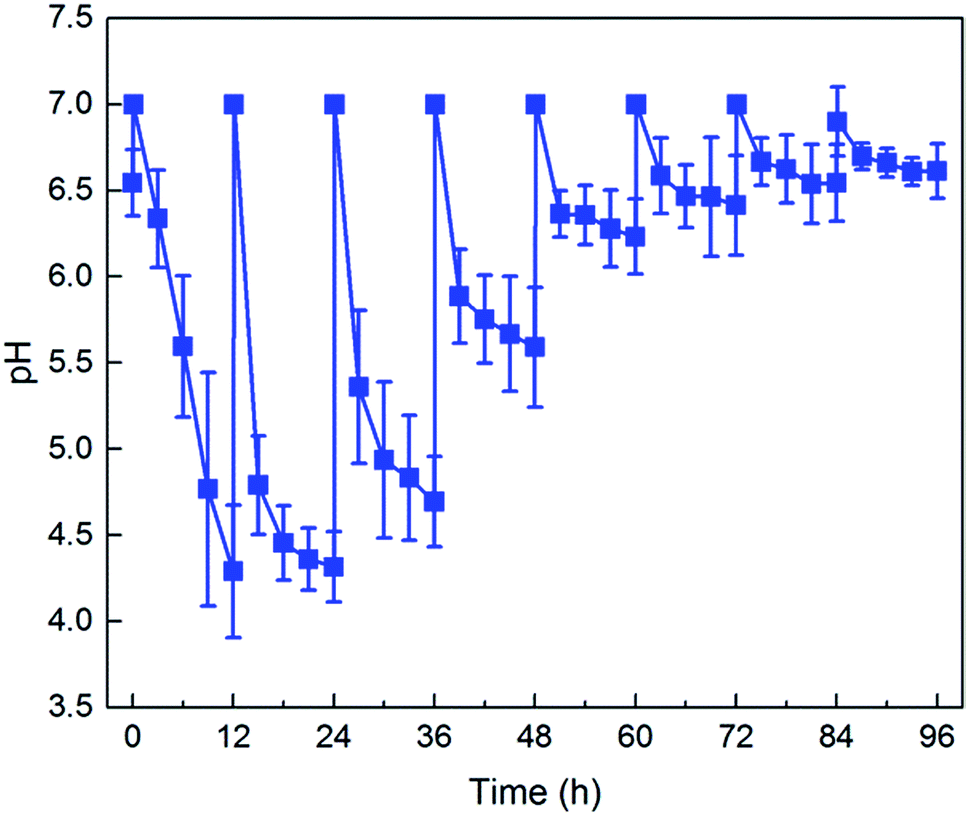 | ||
| Fig. 4 Changes of pH during the pilot-scale food waste fermentation. | ||
The LA production was not only affected by the variation of pH, but also by the microbial population in the fermentation medium. In the current study, LAB, Clostridium spp. and the total viable bacteria were counted using serial dilution plate counting method. As shown in Fig. 5, the LAB increased from 107 colony forming units (cfu) g−1 to 109 cfu g−1 after 48 h fermentation and was always the dominant bacteria in the medium. This was in consistent with the rapid increase in LA concentration during the first 48 h (Fig. 3). Clostridium spp., with the optimal pH above 5.0,33,34 was suppressed at this stage, especially during the first 24 h. The pH kept relatively stable at 6.0–7.0 after 48 h, which was beneficial for the growth of Clostridium spp., resulting in increased cell density. Clostridium spp. can produce organic acids, such as acetic acid, propionic acid, and butyric acids. The increased Clostridium spp. population was likely one of the reasons for increased acetic acid and propionic acid concentration after 72 h fermentation (Fig. 3).
 | ||
| Fig. 5 Changes of viable bacteria counts during the pilot-scale food waste fermentation. | ||
The changes in total and soluble sugar concentration during the fermentation were shown in Fig. 6. The soluble sugar concentration reached its maximum (16.8 g L−1) at 12 h and then decreased gradually, and was below 1.0 g L−1 after 42 h. During the SSF of food waste, the saccharification rate and the sugar consumption rate were different at different fermentation period. During the first 12 h, the saccharification rate was higher than the sugar consumption rate due to the low LAB cell density, resulting in soluble sugar accumulation. As the bacteria population increased after 12 h, the sugar consumption rate also increased and therefore the soluble sugar concentration decreased. The total sugar decreased from 50.4 g L−1 to 17.8 g L−1 after 48 h fermentation, while the LA increased to 21.5 g L−1. The LA yield of this fermentation was 0.66 g g−1 total sugar, indicating the existence of both homo-fermentative and hetero-fermentative LAB in the fermentation broth.
 | ||
| Fig. 6 Changes of sugar concentration during the pilot-scale open fermentation of food waste. | ||
Fig. 7 showed the changes in TS, SS, and VS during the fermentation. The SS concentration decreased rapidly from 7.9% to 3.0% during the first 48 h, due to the fast hydrolysis of the solids into soluble compounds. The reduction of SS was favorable since it reduced the cost for further disposal of the residual food waste. The TS and VS showed the same decreasing tendency, because organic solids accounted for over 90% of the TS. The LA yield based on VS consumption was 0.44 g g−1 VS, which was close to the results by Tang et al.,14 who also studied the fermentation of food waste with indigenous microbiota (0.48 g g−1 VS).
 | ||
| Fig. 7 Changes of TS, SS and VS concentration during the pilot-scale food waste fermentation. | ||
Conclusions
LA production from synthetic food waste through non-sterilized open fermentation without extra inoculum addition was investigated in this study. The laboratory-scale experiments showed that the optimal solid–liquid ratio was 1:1 (water content 91.7%) and addition of α-amylase 25 U per (g dry matter) could significantly accelerate the hydrolysis of food waste and resulted in increased LA productivity. During the pilot-scale fermentation, the LA concentration reached its maximum (21.5 g L−1) at 48 h and decreased thereafter. The decrease in LA concentration and increase in byproduct concentration were likely caused by the increased cell density of microorganisms other than LAB. After 48 h of fermentation, the total sugar and SS concentration decreased by 65.7% and 61.8%, respectively, indicating that LA fermentation was beneficial to achieve the harmlessness and reduction of food waste. Based on this study, it is feasible to produce LA from food waste fermentation without sterilization and inoculum addition.
Acknowledgements
This work was supported by the National Natural Science Foundation of China (Grant No. 51578063).References
- J. Gustavsson, C. Cederberg, U. Sonesson, R. Van Otterdijk and A. Meybeck, Food and Agriculture Organization of the United Nations, Rom, 2011 Search PubMed.
- J. Tai, W. Q. Zhang, Y. Che and D. Feng, Waste Manage., 2011, 31, 1673–1682 CrossRef PubMed.
- X. Hu, M. Zhang, J. Yu and G. Zhang, Acta Ecol. Sin., 2012, 32, 4575–4584 CrossRef.
- J. L. Niu, L. Z. Liang and B. G. Zheng, Adv. Mater. Res., 2012, 518–523, 3573–3576 CrossRef.
- C. S. K. Lin, Energy Environ. Sci., 2013, 6, 426–464 CAS.
- H. Ma, J. Yang, Y. Jia, Q. Wang, T. Yukihiro and S. Kenji, Bioresour. Technol., 2016, 209, 254–258 CrossRef CAS PubMed.
- H. Ma, J. Yang, Y. Jia, Q. Wang, X. Ma and S. Kenji, Bioresour. Technol., 2016, 218, 463–468 CrossRef CAS PubMed.
- H. Huang, V. Singh and N. Qureshi, Biotechnol. Biofuels, 2015, 8, 1–12 CrossRef PubMed.
- V. Ujor, A. K. Bharathidasan, K. Cornish and T. C. Ezeji, Appl. Energy, 2014, 136, 590–598 CrossRef CAS.
- T. Laothanachareon, S. Kanchanasuta, W. Mhuanthong, C. Phalakornkule, N. Pisutpaisal and V. Champreda, J. Environ. Manage., 2014, 144, 143–151 CrossRef CAS PubMed.
- N. H. M. Yasin, T. Mumtaz, M. A. Hassan and N. A. Rahman, J. Environ. Manage., 2013, 130, 375–385 CrossRef CAS PubMed.
- L. Xiang, Y. Chen, Z. Shu, C. Hong, Z. Xiong, J. Luo and Y. Liu, Water Res., 2015, 70, 148–157 CrossRef PubMed.
- T. H. Kwan, Y. Hu and C. S. Lin, Bioresour. Technol., 2016, 217, 129–136 CrossRef CAS PubMed.
- J. Tang, X. Wang, Y. Hu, Y. Zhang and Y. Li, Waste Manage., 2016, 52, 278–285 CrossRef CAS PubMed.
- P. Laopaiboon, A. Thani, V. Leelavatcharamas and L. Laopaiboon, Bioresour. Technol., 2010, 101, 1036–1043 CrossRef CAS PubMed.
- A. R. Mohamed Ali, Y. Tashiro and K. Sonomoto, J. Biotechnol., 2010, 156, 286–301 Search PubMed.
- M. A. Abdelrahman, Y. Tashiro, T. Zendo and K. Sonomoto, RSC Adv., 2013, 3, 8437–8445 RSC.
- J. Wang, Q. Wang, Z. Xu, W. Zhang and J. Xiang, J. Microbiol. Biotechnol., 2014, 25, 26–32 CrossRef PubMed.
- S. Ding and T. Tan, Process Biochem., 2006, 411, 1451–1454 CrossRef.
- S. D. S. Sabo, M. Vitolo and J. M. D. González, Food Res. Int., 2014, 64, 527–536 CrossRef.
- Q. Wang, H. Ma, W. Xu, L. Gong, W. Zhang and D. Zou, Biochem. Eng. J., 2008, 39, 604–610 CrossRef CAS.
- K. Sakai and Y. Ezaki, J. Biosci. Bioeng., 2006, 101, 457–463 CrossRef CAS PubMed.
- Y. Wang, D. Cai, M. He, Z. Wang, P. Qin and T. Tan, Bioresour. Technol., 2015, 198, 664–672 CrossRef CAS PubMed.
- Y. Wang, M. Wang, D. Cai, B. Wang, Z. Wang, P. Qin and T. Tan, RSC Adv., 2016, 6, 35771–35777 RSC.
- Q. H. Wang, J. Narita, K. Kakimoto, Y. Shirai and H. I. Ogawa, Proc. Annu. Conf. Jpn. Soc. Waste Manage. Experts, 2000, 11, 325–327 Search PubMed . (in Japanese).
- M. Dubois, K. A. Gilles, J. K. Hamilton, P. Rebers and F. Smith, Anal. Chem., 1956, 28, 350–356 CrossRef CAS.
- W. E. Federation, Standard methods for the examination of water and wastewater, American Public Health Association (APHA), Washington, DC, USA, 2005 Search PubMed.
- Japan Food Hygiene Association, Standard methods of analysis in food safety regulation, Japan Food Hygiene Association, Tokyo, Japan, 1990, (in Japanese) Search PubMed.
- S. B. Yan, J. M. Yao, L. M. Yao, Z. J. Zhi, X. S. Chen and J. Y. Wu, Braz. Arch. Biol. Technol., 2012, 55, 183–192 CrossRef CAS.
- H. C. Moon, M. Wakisaka, Y. Shirai and M. Taniguchi, Apcche, 2004, vol. 2004, p. 362 Search PubMed.
- J. A. D. Rodrigues, A. G. Pinto, S. M. Ratusznei, M. Zaiat and R. Gedraite, Braz. J. Chem. Eng., 2004, 21, 423–434 CrossRef CAS.
- J. Jiang, Y. Zhang, K. Li, W. Quan, C. Gong and M. Li, Bioresour. Technol., 2013, 143, 525–530 CrossRef CAS PubMed.
- C. Li and H. H. P. Fang, Crit. Rev. Environ. Sci. Technol., 2007, 37, 1–39 CrossRef CAS.
- J. Wang and W. Wei, Int. J. Hydrogen Energy, 2009, 34, 799–811 CrossRef CAS.
Footnote |
| † Electronic supplementary information (ESI) available. See DOI: 10.1039/c6ra22760k |
| This journal is © The Royal Society of Chemistry 2016 |