Enhanced conversion and stability of biosynthetic selenium nanoparticles using fetal bovine serum

Chao Song, Xiao Li, Shuguang Wang* and Qiwei Meng
Shandong Provincial Key Laboratory of Water Pollution Control and Resource Reuse, School of Environmental Science and Engineering, Shandong University, Jinan 250100, China. E-mail: wsg@sdu.edu.cn; Fax: +86 531 88364513; Tel: +86 531 88365919

Received 12th September 2016 , Accepted 17th October 2016

First published on 19th October 2016


Abstract

Compared with chemical methods, biosynthesis provides a mild and green synthesis pathway for selenium nanoparticles, and biosynthetic selenium nanoparticles (BioSeNPs) exhibit more uniformity with high electron density. However, there are still many challenges in the synthesis and storage of BioSeNPs. This study aimed to optimize BioSeNPs synthesis using fetal bovine serum (FBS) as part of the culture medium to enhance the conversion efficiency and stability of BioSeNPs. LB medium without FBS addition was also used to synthesize BioSeNPs as a control. Red selenium nanoparticles in the hexagonal phase were synthesized through the reduction of selenite by Bacillus amyloliquefaciens. High conversion efficiency, up to 98.5%, was obtained with 20% FBS addition, while the conversion efficiency was only 73.6% in LB medium. This might be attributed to the variety of proteins and growth factors in FBS. FTIR and XPS analyses showed that many functional groups, such as hydroxyl, amide and carbonyl, were detected on the surface of the BioSeNPs, and more C[double bond, length as m-dash]O bonds and proteins were found in FBS-BioSeNPs, resulting in strong electrostatic repulsion between the nanoparticles, which is against aggregation. These results were in agreement with zeta potential analysis that FBS could improve the stability of BioSeNPs.

1. Introduction

Selenium (Se) is one of the essential trace elements required for proper functioning of the human body and some environmental cycles.1 It plays a fundamental role in several metabolic pathways, for example Se can be incorporated into some proteins to form selenoproteins, which function as redox centers to reduce hydrogen peroxide and protect most organisms, including humans.2,3 However, there is a narrow concentration range of Se between the required and toxic levels,4 for instance low selenium intake in humans (<40 μg per day) leads to dietary deficiency, but it is acutely toxic at high daily doses (>400 μg per day).5 Organic selenium, especially selenomethionine, is the main chemical form of selenium in food stuffs and is considered as the most appropriate form in nutritional supplements due to low toxicity and high bioavailability.6,7 However, it has been reported that organic selenium could be incorporated into proteins instead of methionine, leading to bioaccumulation of selenium in the body to toxic levels.8 Therefore, it is urgent to develop more safe and reliable selenium sources.

Due to its poor solubility in water, elemental selenium (Se0) is generally considered to be biologically inert,9 but nanosized Se particles (SeNPs) exhibit novel properties different from other types of Se. For particle sizes in the nanometer range, SeNPs could directly enter cells and scavenge various free radicals in situ,10 indicating the high bioavailability and low toxicity of SeNPs.5,11 Therefore, SeNPs might be a promising potential substitute for organic selenium. The synthesis of SeNPs can be achieved through chemical and biological methods.12,13 For chemical methods, stringent synthesis conditions are often necessary, such as high temperature, high pressure and catalysts.14 In contrast, a large number of bacteria in the environment could reduce Se oxyanions to red colored SeNPs through mild and green biotic pathways.15 Besides, biosynthetic selenium nanoparticles (BioSeNPs) are more uniform with higher electron density and stability than chemosynthetic selenium nanoparticles.16 However, there are still many challenges in the synthesis and storage of BioSeNPs. The conversion efficiency of SeNPs by conventional biological synthesis is about 60–80%, much lower than that of the chemical synthesis.16,17 In addition, stabilization against aggregation is also a key limitation to the application of nanoparticles. Therefore, it is an important subject to improve the conversion and stability of BioSeNPs.

Fetal bovine serum (FBS) is the most widely used serum-supplement for cell culture, and the main component of FBS is bovine serum albumin, which comprises about 50–60% of the total serum protein.18 Besides, FBS also contains many growth factors and a very low level of antibodies, which are beneficial for microbial growth.19 It has been reported that the presence of proteins could stabilize nanoparticles against aggregation.20,21 Kittler et al.22 investigated the influences of bovine serum albumin and fetal calf serum on silver nanoparticles and found that the two proteins could enhance the dispersibility of nanoparticles and prevent their agglomeration. Wiogo et al.18 developed a facile method to stabilize iron oxide nanoparticles via surface modification with FBS and found that the nanoparticles showed increased stability against aggregation in the presence of FBS. Therefore, we speculated that FBS could improve the conversion and stability of BioSeNPs when added as part of the culture medium, by the ability of FBS to promote microbial growth and to stabilize the nanoparticles.

The main objectives of this work are to evaluate the influences of FBS on the conversion, properties and stability of BioSeNPs. In this study, FBS was mixed with LB medium for BioSeNPs synthesis by Bacillus amyloliquefaciens. The properties of the BioSeNPs were determined with a combined use of scanning electron microscopy (SEM), transmission electron microscopy (TEM), energy disperse spectroscopy (EDS) and X-ray diffraction (XRD). Fourier-transform infrared spectroscopy (FT-IR) and X-ray photoelectron spectra (XPS) were applied to investigate the functional groups on the surface of the BioSeNPs. The content of Se(IV) was measured using ICP-MS to calculate the conversion efficiency, and zeta potential was analyzed to evaluate the stability of the obtained nanoparticles.

2. Materials and methods

2.1 Pure strain and cultivation

In this study, Bacillus amyloliquefaciens (CICC®10035) was employed to synthesize BioSeNPs, and the test strain was obtained from the China Center of Industrial Culture Collection (CICC). For activation of Bacillus amyloliquefaciens, the bacteria were aerobically cultivated in Luria–Bertani medium (peptone 10 g L−1, yeast extract 5 g L−1 and NaCl 10 g L−1), and the culture flasks were incubated at 37 °C in an incubator shaker (160 rpm) for 24 h to obtain the activated Bacillus amyloliquefaciens solution.

2.2 BioSeNPs synthesis

To synthesize BioSeNPs, the activated Bacillus amyloliquefaciens were inoculated into 100 mL of sterilized LB medium with 3 mM sodium selenite, and the incubation was by the same method mentioned above. The culture solution was collected at 24 h and centrifuged at 8000 rpm for 10 min. The precipitate was washed with distilled water thrice and then lyophilized to obtain BioSeNPs which were named as LB-BioSeNPs. To evaluate the effects of FBS on BioSeNPs production, FBS at different doses was mixed with LB medium, and the final amounts of FBS (v%) were 5%, 10%, 15%, 20%, 30% and 50%. The mixtures were used as the growth medium to synthesize FBS-BioSeNPs.

In control experiments, BSA, the most abundant protein in FBS,21 was added to the culture medium to determine the role of FBS in BioSeNPs synthesis. For the FBS used in this study, the total protein content was about 42 mg mL−1, of which BSA constituted about 20 mg mL−1. Therefore 20% FBS contained about 4 mg mL−1 BSA, and BioSeNPs were synthesized in LB medium with 4 mg mL−1 BSA. In blank experiments, Bacillus amyloliquefaciens autoclaved at 121 °C for 30 min was inoculated in the same conditions as described above.

2.3 Conversion efficiency

For conversion efficiency calculations, the cultured suspension after 24 h of the reaction was collected and treated with an ultrasonic cell disruption system for 10 min to release sodium selenite absorbed by the bacteria into the liquid phase.23 The treated samples were then centrifuged at 12[thin space (1/6-em)]000 rpm for 15 min, and the supernatant was collected for further analysis.

The concentrations of Se(IV) in the supernatant were measured using ICP-MS (Thermo, IRIS Advantage OPTIMA 7000DV). The conversion efficiency was calculated using the equation as follows:

 
Conversion efficiency = (C0C)/C0 (1)
where C0 is the initial concentration of Se(IV) added into the culture, and C is the Se(IV) concentration in the supernatant collected with the methods described above.

2.4 Characterization of BioSeNPs

SEM and TEM analysis. The morphology and surface structure of the BioSeNPs was observed using a scanning electron microscope (SEM, HITACHI S-570) and transmission electron microscope (TEM, Philips Holland Yecnai-20). For SEM, the samples were observed on a glass substrate and the accelerating voltage was set at 5.0 kV.24 TEM images were performed with an accelerating voltage at 200 kV. The elemental composition of the BioSeNPs was analyzed with energy dispersive X-ray spectroscopy (EDS, Oxford INCA X sight, OIMS). The average diameter of the nanoparticles was measured with a laser particle size analysis system (Mastersizer 2000, Malvern, UK).
XRD analysis. X-ray diffraction (XRD) patterns were recorded on an X-ray diffractometer (D8 Advance, Bruker AXS) using Cu Kα (λ = 0.15406 nm) radiation. The X-ray generator was operated at 40 kV and 40 mA in the 2θ range from 10° to 70°.
FTIR spectroscopy analysis. The samples were prepared by pressing mixtures of 1 mg of freeze-dried BioSeNPs and 100 mg of KBr (chromatographic grade). FTIR spectra were recorded under vacuum conditions using an FTIR spectrometer (Aratar, Thermo-Nico-Let, USA). Each spectrum was collected from 4000 to 400 cm−1 at 256 scans, and the ordinate was expressed as transmittance.
XPS analysis. The surface chemistry of the LB-BioSeNPs and FBS-BioSeNPs was investigated using X-ray photoelectron spectroscopy (Thermo ESCALAB 250, USA) with a monochromatic Al Kα X-ray source (1486.6 eV of photon energy). The reduced power of the X-ray source was set at 150 W with a beam spot of 500 μm. The wide scans were performed at a range of 0–1100 eV with a pass energy of 70 eV. The narrow scans of C 1s and O 1s were scanned over 278–294 eV and 524–529 eV with pass energy of 30 eV. The neutral C 1s signal at 284.6 eV was used as a reference to compensate for the surface charging effects.25 The XPS spectra were analyzed using XPSPEAK41 Software.
Zeta potential analysis. The freeze-dried BioSeNPs were suspended with 1 mM NaCl solution, and the solution pH was adjusted from 2 to 9 using 0.01 M HCl or 0.01 M NaOH before the measurement. The zeta potential was measured with a laser electrophoresis zeta potential analyzer (Zetasizer III, Malvern, UK), and each sample was measured at least 5 times to ensure the validity.

3. Results and discussion

3.1 The biosynthesis of elemental Se

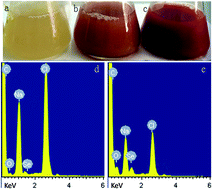
After activated Bacillus amyloliquefaciens were added into the culture, a time-dependent color change was observed (Fig. 1a–c). The solution was clear light-yellow initially and changed to a red color after 24 h of incubation. Since Se nanoparticles usually make the solution red due to the excitation of their surface plasmon vibrations, the red color was considered as the convenient spectroscopic signature of elemental Se particle formation.24 In the blank experiment, Bacillus amyloliquefaciens were autoclaved at 121 °C for 30 min before inoculation, and no obvious color change was observed, indicating that no elemental Se particles were synthesized. This could be explained by the bacteria losing their activity and function under high temperature, suggesting that the bacteria played a key role in the reduction of selenite. Therefore, Bacillus amyloliquefaciens could reduce selenite to elemental Se in this study.
image file: c6ra22747c-f1.tif
Fig. 1 The color change of BioSeNPs formed by activated Bacillus amyloliquefaciens: (a) – 0 h, (b) – 12 h, (c) – 24 h; EDS spectra of LB-BioSeNPs (d) and FBS-BioSeNPs (e).

3.2 Morphology and structure of BioSeNPs

As shown in Fig. S1 and S2, the elemental Se synthesized by Bacillus amyloliquefaciens was primarily spherical in shape with sizes at the nanometer level. For LB-BioSeNPs, the nanospheres ranged in diameter from 70 to 180 nm with an average size of 120 nm. The FBS-BioSeNPs seemed a little smaller resulting from the addition of FBS,26 and the average diameter was about 100 nm with a range of 50–100 nm. According to previous research, the produced BioSeNPs are in the form of colloidal spherical nanoparticles with a diameter of 50–500 nm.11,27 Therefore, Bacillus amyloliquefaciens could reduce selenite efficiently and synthesize BioSeNPs in this study.

The biosynthesized elemental Se is usually not of very high purity and is mixed with other components due to the complexity of the biological medium.28 In this study, EDS was applied to analyze the elemental composition of the obtained BioSeNPs, and the relative amounts are listed in Table S1. As shown in Fig. 1d and e, the spectra of LB-BioSeNPs and FBS-BioSeNPs showed a strong peak at 1.2 keV, indicating the presence of the Se element. Strong signals of Na and Cl were also observed, which might be attributed to the residual culture medium. Also, carbon and oxygen were detected on the surface of the BioSeNPs, indicating that some bioactive compounds were adsorbed on the nanoparticles during the synthesis process,14 which might affect the physicochemical properties of the BioSeNPs.

XRD spectra were carried out to evaluate the crystal structure and phase composition of the BioSeNPs. As shown in Fig. 2, three main diffraction peaks were observed with 2θ values at 31.8, 45.5, and 56.6 for LB-BioSeNPs, and 31.7, 45.4, and 56.6 for FBS-BioSeNPs. There was nearly no difference between the two samples, suggesting that the addition of FBS could not influence the crystal structure of the synthesized BioSeNPs. According to the literature value (JCPDS 06-0362), the three diffraction peaks were for the (101), (111) and (003) reflections of the pure hexagonal phase of selenium crystals.29 The strong and sharp Bragg diffraction peaks resulted from the presence of trigonal selenium (t-Se) nanoparticles, which is consistent with other research.29 Compared with the XRD pattern of SeNPs synthesized by chemical methods,30 some background noise was observed in the BioSeNPs, which may be attributed to the bioactive compound adsorbed on the nanoparticles in agreement with the EDS results.


image file: c6ra22747c-f2.tif
Fig. 2 XRD patterns of LB-BioSeNPs (a) and FBS-BioSeNPs (b).

3.3 Conversion efficiency

The Se(IV) concentrations were detected using ICP-MS to evaluate the formation of BioSeNPs, and the conversion efficiencies are shown in Fig. 3. Selenite was rapidly consumed in the first 12 h, and then the reduction rate slowed down until the end of the incubation. About 73.6% of the sodium selenite was reduced in the LB medium, and the conversion efficiencies were highly improved when FBS was added. Besides, the conversion efficiency increased along with an increasing amount of FBS. When the FBS concentration was 20%, the conversion efficiency was highest, 98.5%, and more FBS did not enhance the transformation of sodium selenite. So, the optimal FBS concentration could be 20% to maximize the selenite conversion.
image file: c6ra22747c-f3.tif
Fig. 3 The conversion efficiency of BioSeNPs at different FBS doses.

Biological reduction of selenite to BioSeNPs has been described for bacteria, activated sludge and granular sludge.14,31–33 It has been reported that Klebsiella pneumonia was applied for selenium nanoparticles biosynthesis and selenite reached only 60% utilization.16 Moreover, Jain et al. treated selenite-containing wastewater with activated sludge and found that about 73% of the fed selenium was transformed to elemental selenium.33 The conversion efficiency is similar to our results obtained in LB medium. In this study, FBS was added to improve the yield of BioSeNPs, and the conversion efficiency raised more than 20% to 98.5% in culture medium containing 20% FBS. In cell culture studies, FBS is commonly used as a protein source to mimic a real biological fluid,34 and BSA is the main component of FBS. In control experiments, about 88.8% of selenite was reduced to BioSeNPs with BSA addition (Fig. S3), indicating that BSA could enhance the conversion of BioSeNPs. Therefore, the BSA in FBS might play an important role in BioSeNPs synthesis. Moreover, the higher conversion efficiency with FBS implied that components besides BSA in FBS might also contribute to the improved conversion. Generally, FBS contains a variety of proteins and growth factors, such as hormones, plasma proteins, and carbohydrates, which could promote the growth of bacteria and enhance the microbial activity.19 This might explain why FBS could improve the conversion of selenite to elemental Se.

3.4 FTIR analysis

In this study, the obtained BioSeNPs were not composed entirely of selenium, and strong signals of carbon and oxygen were also detected in the EDS spectra, suggesting that some bioactive compounds excreted by bacteria might exist in the BioSeNPs. Therefore, FTIR spectra were carried out to determine the possible functional groups on the surface of the BioSeNPs and are shown in Fig. 4. For LB-BioSeNPs, a broad peak was observed at 3413 cm−1 due to the stretching vibrations of O–H and N–H in hydroxyl and amine groups,35,36 while the signal at about 2920 cm−1 represents the aliphatic saturated C–H stretching modes in alkyl chains.37 The characteristic functional groups of protein were also detected at 1700–1200 cm−1. The signal at 1652 cm−1 was attributed to the C[double bond, length as m-dash]O stretching vibration (amide I) in protein. The strong absorbance at 1556 cm−1 represents the amide II band, which was assigned to N–H bending vibrations and C–N stretching vibrations in the –CO–NH of proteins. Besides, a sharp peak was found at 1392 cm−1, which was associated with the bending vibration of the C–O bond.38 The small peak at 1244 cm−1 was mainly attributed to the C–O deformation vibration in the carboxylic group and the P[double bond, length as m-dash]O stretching vibration.39 In addition, a doublet peak was observed between 1079 and 1051 cm−1, which originated from the C–O–C group and C–H stretching vibration in polysaccharides.40 For FBS-BioSeNPs, the spectrum was similar to that of LB-BioSeNPs, and the signals assigned to the functional groups mentioned above were also detected at the approximate wavenumbers. The peaks of protein and polysaccharide exhibited slight shifts, implying that these bioactive compounds might be involved in the BioSeNPs synthesis with the addition of FBS. Furthermore, the relative peak intensities were much higher after the FBS addition, indicating that the content of proteins and polysaccharides in FBS-BioSeNPs might be higher than those in LB-BioSeNPs.41 In general, the FTIR spectra of the BioSeNPs confirmed the signals of amine (I, II), hydroxyl and carboxyl groups, suggesting that there were proteins and polysaccharides in the synthesized BioSeNPs. These results were similar to other research which obtained SeNPs with biological methods.14,24
image file: c6ra22747c-f4.tif
Fig. 4 FTIR spectra of LB-BioSeNPs and FBS-BioSeNPs.

3.5 X-ray photoelectron spectroscopy analysis

The XPS spectra were conducted to further investigate the composition and functional groups on the surface of the LB-BioSeNPs and FBS-BioSeNPs. The wide scan XPS spectra are shown in Fig. S4, and the signals of C, O, Na, Cl and Se were all detected, which is in agreement with the EDS analysis. Besides, N was also detected in the wide scan spectra but not observed in the EDS spectra, which could be attributed to the overlap of C and O signals on the N peaks in the EDS spectra. Hence, the BioSeNPs obtained in this study are mainly composed of C, N, O and Se, indicating that Se nanoparticles were coated by bioactive compounds like proteins. This finding was consistent with the results found in the EDS and FTIR analyses.

The high-resolution scans for C 1s and O 1s are shown in Fig. 5. The spectra were decomposed with XPSPEAK 41 Software, and the assignment and relative content of these XPS signals are listed in Table S2. The C 1s scan of LB-BioSeNPs and FBS-BioSeNPs can be resolved into three component peaks. The peak at binding energy of 284.39 ± 0.09 eV can be assigned to C–C or C–H in lipids or amino acid side chains.40 The C–O or C–N bonds, as in alcohol, amine, ether or amide, were detected at 285.59 ± 0.06 eV.42 The peaks at 287.70 ± 0.23 eV can be attributed to C[double bond, length as m-dash]O or O–C–C in carbonyl, amide or hemiacetal.38 The O 1s spectra were decomposed into two component peaks, and the peaks at binding energy of 531.45 ± 0.24 and 532.34 ± 0.04 eV were assigned to C[double bond, length as m-dash]O and C–O bonds, respectively.43


image file: c6ra22747c-f5.tif
Fig. 5 XPS spectra of LB-BioSeNPs (a, c) and FBS-BioSeNPs (b, d): a, b – C 1s scan; c, d – O 1s scan.

Compared with LB-BisSeNPs, the relative content of C–(C, H) and C–(O, N) in FBS-BioSeNPs decreased from 42.43% and 36.13% to 40.09% and 31.11%, while the amount of C[double bond, length as m-dash]O or O–C–O increased from 21.44% to 28.80%, suggesting that FBS-BioSeNPs contained more oxygenic functional groups such as carbonyl, aldehyde, ether and amide. The peak area of O 1s in C[double bond, length as m-dash]O increased from 59.35% to 63.42%, which was in agreement with the variations in the C 1s peaks. These results could be explained by more proteins being contained in Se nanoparticles with the addition of FBS, leading to more C[double bond, length as m-dash]O bonds.

3.6 Effects of FBS on BioSeNPs stability

The zeta potential is considered as a key indicator for the stability of colloidal dispersions and was applied to evaluate the colloidal stability of BioSeNPs in this study. Nanoparticle suspensions with high zeta potential (positive or negative, above 30 mV) are colloidally stable while those with low zeta potential (from 15 mV to 30 mV) exhibit instability, and nanoparticles will aggregate rapidly when the zeta potential is less than 15 mV.44 As shown in Fig. 6, BioSeNPs with positive charge were detected below pH = 4, and the zeta potentials were less than 30 mV, implying instability of the BioSeNPs. The isoelectric point of both LB-BioSeNPs and FBS-BioSeNPs was extrapolated to be at pH 4.1–4.2, which is similar to other research.14 Due to the intrinsic negative charge of <−30 mV, LB-BioSeNPs exhibited colloidal stability above pH = 8.0, while FBS-BioSeNPs were moderately stable above pH = 7.0.1 It was obvious that FBS-BioSeNPs have greater zeta potential values (positive or negative) than LB-BioSeNPs (P < 0.05), especially at neutral and alkaline conditions, indicating that the colloidal stability of the BioSeNPs increased with the FBS addition.
image file: c6ra22747c-f6.tif
Fig. 6 Zeta potential of BioSeNPs and FBS-BioSeNPs.

To evaluate the long-term stability of the nanoparticles, the same amounts of LB-BioSeNPs and FBS-BioSeNPs were suspended and stored at 4 °C. The suspensions were analyzed with a UV-visible spectrophotometer during the storage. A broad absorption peak was detected at 550–600 nm, which was attributed to the BioSeNPs.45 Moreover, the calibration plots (Fig. S5a) were generated at 570 nm, which showed a linear correlation between the absorbance and the BioSeNPs concentration. Therefore, it is feasible to determine the BioSeNPs concentration in the suspensions via the absorbance at 570 nm to evaluate the stability of the nanoparticles. In the first three days, both BioSeNPs were stable in the first 72 h, and about 87.6% of LB-BioSeNPs and 96.2% of FBS-BioSeNPs were detected in the suspensions (Fig. S5b). FBS-BioSeNPs exhibited higher stability with less than 15% precipitate after 168 h storage, while more than 40% of LB-BioSeNPs were precipitated. These results indicated that FBS could highly improve the stability of BioSeNPs and maintain the high stability for at least 168 h. In addition, we re-suspended both BioSeNPs through shaking the two suspensions, and the zeta potentials were also measured in a neutral environment. FBS-BioSeNPs were colloidally stable with the zeta potential at −51.4 ± 3.1 mV, suggesting that highly stable FBS-BioSeNPs suspensions were achieved. The zeta potential of LB-BioSeNPs was only 21.2 ± 1.7 mV, which is considered to be unstable.1 Therefore, FBS-BioSeNPs exhibited better long-term stability with little precipitate and high zeta potential.

Colloidal stability is a key characteristic of nanoparticles against the tendency to aggregate, and it is very important for both the application and storage of nanoparticles. In this study, FBS was added to optimize the synthesis of BioSeNPs. It was found that FBS could significantly improve the stability of BioSeNPs. In a neutral environment (pH = 7.0), FBS-BioSeNPs were colloidally stable with the zeta potential at −35.5 ± 4.8 mV, while the zeta potential of LB-BioSeNPs was only −26.8 ± 3.1 mV, which is considered to be unstable.44 FBS is mainly composed of proteins, which are generally useful dispersing agents for stabilizing nanoparticles.21 The adsorption of proteins onto the surface of nanoparticles could be achieved via hydrophobic, electrostatic or specific chemical interactions, which depend on pH and ionic strength in solution.46 In this study, the isoelectric point (IEP) of FBS was about 4.6. When the pH was close to the IEP, FBS was hydrophobic and could be adsorbed onto the nanoparticles through hydrophobic interactions. FBS became positively or negatively charged at pH below or above the IEP, and electrostatic forces would be dominant over hydrophobic interactions.21 Generally, the synthesis and storage of BioSeNPs were carried out under neutral or near neutral environment (pH ∼ 7.0), under which condition proteins were negatively charged. According to the EDS and FTIR analyses mentioned above, proteins were detected on the obtained BioSeNPs, and more proteins were found on the FBS-BioSeNPs than the LB-BioSeNPs, leading to a greater negative charge on the FBS-BioSeNPs, in agreement with the zeta potential analysis. These results will enhance the lateral protein–protein electrostatic repulsive interaction, resulting in higher stability of the FBS-BioSeNPs. In Section 3.4, the C[double bond, length as m-dash]O bond, a highly negatively charged group, was more abundant in the FBS-BioSeNPs, which could also induce a strong electrostatic repulsion between the nanoparticles, which is against aggregation.18 This might explain why FBS could improve the stability of BioSeNPs.

It has been reported that protein could adsorb onto the nanoparticles’ surface and stabilize the nanoparticles against aggregation.20 Therefore, serums, abundant in proteins, have been used as dispersing agents for stabilizing nanoparticles in several studies.21,47 Kittler et al.22 found that BSA and fetal calf serum (FCS) could enhance the dispersibility of nanoparticles and prevent their agglomeration. For BSA, the agglomeration started soon after dispersion and also led to sedimentation. For FCS, the particles exhibited high stability for at least one week, which was similar to our results. It was also reported that FBS was added to stabilize magnetic iron oxide nanoparticles and the sizes of nanoparticles could be maintained against aggregation for at least 16 h in the presence of FBS.18 In our study, FBS was added as part of the culture medium, which was the main participant in the BioSeNPs synthesis. The conversion efficiency and stability of the BioSeNPs were highly improved in the presence of FBS. Furthermore, FBS could highly enhance the stability of the BioSeNPs by improving the amount of C[double bond, length as m-dash]O bonds and proteins adsorbed on the nanoparticles, which leads to strong electrostatic repulsion between nanoparticles, which is against aggregation.18 The FBS-BioSeNPs could maintain high stability for at least 168 h, and highly stable suspensions with a high zeta potential at about −50 mV were also achieved by re-suspending the BioSeNPs solution.

4. Conclusions

In this work, FBS was added as part of the culture medium for BioSeNPs synthesis, and we evaluated the effects of FBS on the conversion, physicochemical properties and stability of BioSeNPs. With the addition of FBS, high conversion efficiency, up to 98.5%, was observed due to the proteins and growth factors in FBS. Besides, more proteins and C[double bond, length as m-dash]O bonds were found on the surface of FBS-BioSeNPs, leading to strong electrostatic repulsion between nanoparticles, which is against aggregation. In conclusion, FBS could effectively enhance the conversion efficiencies and stability of BioSeNPs, which is meaningful for the synthesis, application and storage of BioSeNPs.

Acknowledgements

This work was supported by the National Natural Science Foundation of China (21476130, 21676161 and 51208283).

References

  1. B. Buchs, M. W. H. Evangelou, L. H. E. Winkel and M. Lenz, Environ. Sci. Technol., 2013, 47, 2401–2407 CrossRef CAS PubMed.
  2. M. P. Rayman, Lancet, 2000, 356, 233–241 CrossRef CAS.
  3. K. Brown and J. Arthur, Publ. Health Nutr., 2001, 4, 593–599 CAS.
  4. S. I. Yang, G. N. George, J. R. Lawrence, S. G. W. Kaminskyj, J. J. Dynes, B. Lai and I. J. Pickering, Environ. Sci. Technol., 2016, 50, 10343–10350 CrossRef CAS PubMed.
  5. L. H. E. Winkel, C. A. Johnson, M. Lenz, T. Grundl, O. X. Leupin, M. Amini and L. Charlet, Environ. Sci. Technol., 2012, 46, 571–579 CrossRef CAS PubMed.
  6. G. N. Schrauzer, J. Nutr., 2000, 130, 1653–1656 CAS.
  7. G. N. Schrauzer, J. Med. Food, 1998, 1, 201–206 CrossRef CAS.
  8. H. L. Wang, J. S. Zhang and H. Q. Yu, Free Radical Biol. Med., 2007, 42, 1524–1533 CrossRef CAS PubMed.
  9. M. Gallego-Gallegos, L. E. Doig, J. J. Tse, I. J. Pickering and K. Liber, Environ. Sci. Technol., 2013, 47, 584–592 CrossRef CAS PubMed.
  10. D. G. Peng, J. S. Zhang, Q. L. Liu and E. W. Taylor, J. Inorg. Biochem., 2007, 101, 1457–1463 CrossRef CAS PubMed.
  11. R. Jain, N. Jordan, S. Weiss, H. Foerstendorf, K. Heim, R. Kacker, R. Hübner, H. Kramer, E. D. van Hullebusch, F. Farges and P. N. L. Lens, Environ. Sci. Technol., 2015, 49, 1713–1720 CrossRef CAS PubMed.
  12. X. Gao, J. Zhang and L. Zhang, Adv. Mater., 2002, 14, 290–293 CrossRef CAS.
  13. S. Sadeghian, G. A. Kojouri and A. Mohebbi, Biol. Trace Elem. Res., 2012, 146, 302–308 CrossRef CAS PubMed.
  14. F. H. Yuan, C. Song, X. F. Sun, L. R. Tan, Y. K. Wang and S. G. Wang, RSC Adv., 2016, 6, 15201–15209 RSC.
  15. J. S. Zhang, H. L. Wang, Y. P. Bao and L. D. Zhang, Life Sci., 2004, 75, 237–244 CrossRef CAS PubMed.
  16. P. J. Fesharaki, P. Nazari, M. Shakibaie, S. Rezaie, M. Banoee, M. Abdollahi and A. R. Shahverdi, Braz. J. Microbiol., 2010, 41, 461–466 CrossRef CAS PubMed.
  17. J. Lu, Q. Jin, Y. L. He, J. Wu, W. Y. Zhang and J. Zhao, Water Res., 2008, 42, 1075–1082 CrossRef CAS PubMed.
  18. H. T. R. Wiogo, M. Lim, V. Bulmus, J. Yun and R. Amal, Langmuir, 2011, 27, 843–850 CrossRef CAS PubMed.
  19. R. Tedja, M. Lim, R. Amal and C. Marquis, ACS Nano, 2012, 6, 4083–4093 CrossRef CAS PubMed.
  20. R. Murdock, L. Braydich-Stolle, A. Schrand, J. Schlager and S. Hussain, Toxicol. Sci., 2008, 101, 239–253 CrossRef CAS PubMed.
  21. Z. X. Ji, X. Jin, S. George, T. Xia, H. Meng, X. Wang, E. Suarez, H. Y. Zhang, E. M. V. Hoek, H. Godwin, A. E. Nel and J. I. Zink, Environ. Sci. Technol., 2010, 44, 7309–7314 CrossRef CAS PubMed.
  22. S. Kittler, C. Greulich, J. S. Gebauer, J. Diendorf, L. Treuel, L. Ruiz, J. M. Gonzalez-Calbet, M. Vallet-Regi, R. Zellner and M. Köller, J. Mater. Chem., 2009, 20, 512–518 RSC.
  23. C. Song, X. F. Sun, P. F. Xia, Y. K. Wang and S. G. Wang, RSC Adv., 2015, 5, 87333–87340 RSC.
  24. W. J. Zhang, Z. J. Chen, H. Liu, L. Zhang, P. Gao and D. P. Li, Colloids Surf., B, 2011, 88, 196–201 CrossRef CAS PubMed.
  25. D. D. Zhao, Y. Yu and J. P. Chen, Water Res., 2016, 101, 564–573 CrossRef CAS PubMed.
  26. Z. J. Deng, G. Mortimer, T. Schiller, A. Musumeci, D. Martin and R. F. Minchin, Nanotechnology, 2009, 20, 455101 CrossRef PubMed.
  27. R. S. Oremland, M. J. Herbel, J. S. Blum, S. Langley, T. J. Beveridge, P. M. Ajayan, T. Sutto, A. V. Ellis and S. Curran, Appl. Environ. Microbiol., 2004, 70, 52–60 CrossRef CAS PubMed.
  28. D. B. Li, Y. Y. Cheng, C. Wu, W. W. Li, N. Li, Z. C. Yang, Z. H. Tong and H. Q. Yu, Sci. Rep., 2014, 4, 313–317 Search PubMed.
  29. N. Srivastava and M. Mukhopadhyay, Powder Technol., 2013, 244, 26–29 CrossRef CAS.
  30. C. Ramamurthy, K. S. Sampath, P. Arunkumar, M. S. Kumar, V. Sujatha, K. Premkumar and C. Thirunavukkarasu, Bioprocess Biosyst. Eng., 2013, 36, 1131–1139 CrossRef CAS PubMed.
  31. J. Dobias, E. I. Suvorova and R. Bernier-Latmani, Nanotechnology, 2011, 22, 195605–195613 CrossRef CAS PubMed.
  32. S. Dhanjal and S. S. Cameotra, Microb. Cell Fact., 2010, 9, 1–11 CrossRef PubMed.
  33. R. Jain, M. Seder-Colomina, N. Jordan, P. Dessi, J. Cosmidis, E. D. van Hullebusch, S. Weiss, F. Farges and P. N. L. Lens, J. Hazard. Mater., 2015, 295, 193–200 CrossRef CAS PubMed.
  34. H. T. R. Wiogo, L. May, B. Volga, Y. Jimmy and A. Rose, Langmuir, 2011, 27, 843–850 CrossRef CAS PubMed.
  35. L. L. Wang, L. F. Wang, X. M. Ren, X. D. Ye, W. W. Li, S. J. Yuan, M. Sun, G. P. Sheng, H. Q. Yu and X. K. Wang, Environ. Sci. Technol., 2012, 46, 737–744 CrossRef CAS PubMed.
  36. C. Xu, S. Zhang, C. Y. Chuang, E. J. Miller, K. A. Schwehr and P. H. Santschi, Mar. Chem., 2011, 126, 27–36 CrossRef CAS.
  37. X. F. Sun, S. G. Wang, X. M. Zhang, J. P. Chen, X. M. Li, B. Y. Gao and M. Yue, J. Colloid Interface Sci., 2009, 335, 11–17 CrossRef CAS PubMed.
  38. X. F. Sun, S. G. Wang, X. M. Zhang, J. Paul Chen, X. M. Li, B. Y. Gao and Y. Ma, J. Colloid Interface Sci., 2009, 335, 11–17 CrossRef CAS PubMed.
  39. G. P. Sheng, J. Xu, H. W. Luo, W. W. Li, W. H. Li, H. Q. Yu, Z. Xie, S. Q. Wei and F. C. Hu, Water Res., 2013, 47, 607–614 CrossRef CAS PubMed.
  40. C. Song, X. F. Sun, S. F. Xing, P. F. Xia, Y. J. Shi and S. G. Wang, Environ. Sci. Pollut. Res., 2014, 21, 1786–1795 CrossRef CAS PubMed.
  41. M. M. Gao, G. H. Zhang, G. Zhang, X. H. Wang, S. G. Wang and Y. Yang, Polym. Degrad. Stab., 2011, 96, 1799–1804 CrossRef CAS.
  42. S. J. Yuan, M. Sun, G. P. Sheng, Y. Li, W. W. Li, R. S. Yao and H. Q. Yu, Environ. Sci. Technol., 2010, 45, 1152–1157 CrossRef PubMed.
  43. X. F. Sun, S. G. Wang, X. W. Liu, W. X. Gong, N. Bao and B. Y. Gao, J. Colloid Interface Sci., 2008, 324, 1–8 CrossRef CAS PubMed.
  44. D. Hanaor, M. Michelazzi, C. Leonelli and C. C. Sorrell, J. Eur. Ceram. Soc., 2012, 32, 235–244 CrossRef CAS.
  45. U. Jeong and Y. N. Xia, Adv. Mater., 2005, 17, 102–106 CrossRef CAS.
  46. S. Patil, A. Sandberg, E. Heckert, W. Self and S. Seal, Biomaterials, 2007, 28, 4600–4607 CrossRef CAS PubMed.
  47. A.-K. Ostermeyer, C. Kostigen Mumper, L. Semprini and T. S. Radniecki, Environ. Sci. Technol., 2013, 47, 14403–14410 CrossRef CAS PubMed.

Footnote

Electronic supplementary information (ESI) available. See DOI: 10.1039/c6ra22747c

This journal is © The Royal Society of Chemistry 2016
Click here to see how this site uses Cookies. View our privacy policy here.