Natural polysaccharides leading to super adsorbent hydroxyapatite nanoparticles for the removal of heavy metals and dyes from aqueous solutions

Danushika C. Manatungaa, Rohini M. de Silva*a, K. M. Nalin de Silvaab and Rivi Ratnaweeraa
aDepartment of Chemistry, University of Colombo, Colombo 00300, Sri Lanka. E-mail: rohini@chem.cmb.ac.lk
bSri Lanka Institute of Nanotechnology (SLINTEC), Nanotechnology & Science Park, Mahenwatte, Pitipana, Homagama 10206, Sri Lanka

Received 10th September 2016 , Accepted 24th October 2016

First published on 24th October 2016


Abstract

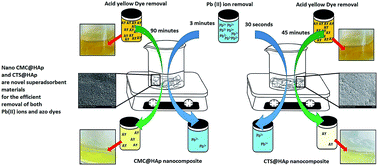
Water pollution has created a major impact on the environment mainly due to contaminated industrial effluents with toxic substances such as heavy metals and textile dyes. Therefore finding effective methodologies for their removal are extremely important. Hydroxyapatite (HAp) is a biocompatible material and has been widely used in many biological and industrial applications. This study involves the synthesis of porous HAp polymer nanocomposites using chitosan (CTS@HAp) and carboxymethyl cellulose (CMC@HAp) to develop a potential adsorbent with high adsorption capacity for heavy metals and textile dyes. A facile in situ synthetic approach was followed to obtain nanoparticles without calcination or freeze drying. X-ray diffraction, Fourier transform infra-red spectroscopy, scanning electron microscopy, thermogravimetric analysis, X-ray fluorescence spectroscopy and BET surface area characterization techniques were applied to elucidate the crystallinity, surface chemistry, morphology and surface area of HAp nanoparticles. This simple approach has produced 25–30 nm and 10 nm spherical nanoparticles of HAp in the presence of chitosan (CTS) and carboxymethyl cellulose (CMC) respectively. These nanocomposites were used for the removal of Pb(II) ions and an industrial dye waste, acid yellow 220. The equilibrium sorption data were fitted according to the Freundlich and Langmuir isotherm models. For the CMC@HAp system the equilibrium for adsorption was achieved in 3 min, while CTS@HAp system required only 30 seconds. The maximum Pb(II) ion adsorption capacity (qm) was found to be 625.0 mg g−1 and 909.1 mg g−1 for CMC@HAp and CTS@HAp respectively. In the case of acid yellow 220, the equilibrium for adsorption was achieved in 90 minutes and 45 minutes for CMC@HAp and CTS@HAp respectively. The maximum acid yellow 220 adsorption capacity (qm) was found to be 200 mg g−1 and 303 mg g−1 for CMC@HAp and CTS@HAp respectively. Therefore this study has highlighted the possibility of developing a HAp nanocomposite material for the efficient and effective removal of both Pb(II) ions and acid yellow 220 from aqueous system.


Introduction

Hydroxyapatite (HAp), Ca10(PO4)6(OH)2 is a naturally available calcium phosphate form1 which is the main mineral component in hard tissue like bone and teeth.2 It is a particularly attractive material because of its non-toxicity,3 biocompatibility,3,4 biodegradability,5 higher sorption capacity,6,7 ion exchangeable ability8,9 and also its ability to bind with a spectrum of biomolecules such as proteins, enzymes, DNA10–12 and heavy metals.13 Even though HAp has vast number of applications the use of neat HAp has been hindered due to its brittleness and low mechanical strength.3 Therefore the synthesis of HAp polymer composites has been investigated to enhance the properties of HAp.4,14,15

In general biodegradable polymer nanocomposites are a novel class of materials which have gained much attention over the years.3,14,16–21 These types of composites exhibit unique properties due to the combination effect created by both the polymer and the other material.18 They have been used in many applications such as drug delivery,14–17,22–24 bone implantation,1,3,15,20 delivery of proteins,10,11 enzymes,12 DNA,1,4 and delivery of antibacterial,25 antifungal agents.4,23 Moreover they have also been used in industrial applications such as water purification26 and removal of heavy metals8,27 and dye contaminants.28 Silica,16 hydroxyapatite,16,29–33 calcium deficient hydroxyapatite34 and clay minerals17 are the commonly used inorganic base material to create these polymer nanocomposites.

HAp polymer scaffolds are one such class of nanocomposites mostly obtained using polysaccharide molecules such as chitosan (CTS) and carboxymethyl cellulose (CMC).3,4,9,19,20 The use of natural polymers for the creation of these composites is known to be much more applicable due to the non-toxicity, low cost and also due to the abundance of these polymers in nature.3,15

Chitosan is a cationic polymer extracted from the crustacean shells which is known to have good biocompatibility as it is structurally similar to proteins and polysaccharides in the cellular environment.3,15,35,36 On the other hand CMC is a negatively charged polymer obtained from cellulose and having a similarity to CTS structure.3,20

Usually HAp polymer nanocomposites, are synthesized by various approaches such as solid state synthesis,8 hydrothermal route37,38 and many other wet chemical approaches.39,40 However, it has been proven that the size, morphology, surface area is strongly affected by the pathway for the synthesis.2,39 Wet chemical approach has been commonly used due to the ease of preparation of HAp nanocomposites.21,39 More specifically an extended form of the wet chemical approach which is referred to as biomimetic synthesis or template directed synthesis has been introduced to create HAp based materials which could mimic the biomineralization in the stimulated body fluid (SBF).41,42 There, the polymeric molecules bearing functional groups on the surface act as nucleation sites or reactive sites which could accumulate the respective ion species (e.g. anionic groups triggering the localization of cations like Ca2+) thereby accelerating the nucleation of HAp. Many natural as well as artificial polymer molecules (e.g. silk fiber, chitosan, poly vinyl alcohol etc.)42,43 have been utilized as templates to obtain HAp with organized structures.

Moreover the synthesis of porous nanocomposites is found to be interesting as it could increase the performance of the material.44,45 In order to create porous polymer hydroxyapatite composites both post synthetic approach2,3,15 and in situ approach are used.19 In the course of post synthetic approach, synthesized HAp nanoparticles have been added to the polymer solution where a polymer HAp blend is created at the end.2,3,15,20 In contrast, during in situ preparation the polymer molecule is present in the precursor solution of HAp while producing HAp nanoparticles, influencing the nucleation and growth of nanoparticles.19 However the use of post synthetic approach is much common, in many occasions, this results in producing both micro or macro porous HAp composites.3,14,15,20 The synthesis of nanoporous HAp structures with bio polymers is scares.46,47 On the other hand, these procedures have utilized very high pH (10–12) conditions21,22,37 and lengthy processing times.2,9,22,48 It is also worth noticing that the porosity of these materials has only been created after subjecting the material to calcination2,19,29 or freeze drying.8,9,15,22,31 Some protocols have even led to the synthesis of irregular porous structures15,20 and the introduction of calcium phosphate impurities, restricting its applications.30 Therefore this study was focused to investigate a facile and cost effective approach to synthesise HAp polymer blends using CTS and CMC.

Heavy metals are a common source of contaminants, introduced to water bodies by many industries such as metal plating, mining operation, battery production, car manufacturing, etc.8,9 Lead (Pb) is considered as a potential health risk as it could severely affect the central nervous system and the red blood cell production.6,9,49 Therefore much concern was raised for the effective removal of Pb(II) ions from industrial effluents before they are introduced to the aquatic environment.

There are number of commonly available approaches for the removal of Pb(II) from polluted water which includes chemical precipitation, adsorption, ion-exchange, electrochemical treatment and osmosis.6,7,9,50,51 However the adsorption process has been widely used in many instances due to its low cost, efficiency and simplicity.6,7,9 Many adsorbents like activated carbon,6 clay minerals,51 polymer materials like chitosan, chitin6,52 and low cost agricultural products51 are among the common adsorbent materials that are being used for the adsorption of heavy metal ions.6,22

Apart from the heavy metals, textile dyes can also be considered as another source of water contamination. Due to the increased solubility and ease of application synthetic dyes are being widely used in textile industry.53 However, heavy metal containing azo dyes such as acid yellow 220, are known to be toxic, carcinogenic and create serious health effects due to the aromatic structure and the metals that are incorporated in its structure.54–56

These dyes are hard to remove as they are robust55,58 and are known to be resistant to light, oxidation and heat.57 Therefore conventional treatment protocols55,57 has been unsuccessful. But the application of adsorption removal approach has been effective with respect to the other methods.53,57 Of the adsorbent materials, activated carbon was widely used but its application has been limited due to the high cost and inability to use in large scale applications.57 Therefore finding an alternative has been one of the major concerns.53 Most of the other adsorbent materials used for the removal of azo dyes are generally derived from organic waste (e.g. rice husks, orange peel, tea waste etc.) or clay minerals (e.g. zeolite, sepiolite).58 Nevertheless, the adsorption capacity of these materials is generally limited.59,60 Therefore finding a low cost and efficient material is essential.

With this regard, the use of HAp for heavy metal removal and toxic dye removal is found to be a promising approach. There are some reports which have used HAp as an adsorbent material for the removal of both Pb(II) ions27,49,50,61 and textile dye compounds.55,62–64

Chitosan, a polysaccharide molecule, has also been used as a heavy metal adsorbent for the removal of number of heavy metals7,8 because of its chelating ability towards the metal ions.9 Moreover modified chitosan and chitosan together with other materials have also explored for the removal of Pb(II) ions.52 However the use of HAp polymer blends for the removal of Pb(II) ions is not common.9,65,66 These studies have utilized the use of post synthetic approach involving lengthy processing times and also an additional step of freeze drying for the preparation of chitosan HAp (CTS@HAp) nanocomposite which required seven days to reach the maximum sorption capacity of Pb(II) ions.9 In another study Park et al.8 has created HAp/CTS hybrid fibrous sorbent material for the removal of Cd and Pb ions from aqueous solution. During their work, the preparation of the HAp/CTS hybrid has required a freeze drying step and the resulting composite is able to reach the equilibrium adsorption capacity for Pb(II) ions after 1 hour.8

CMC and CMC based nanocomposites have also been utilized67–70 for the removal of Pb(II) from aqueous system, but the use of carboxymethyl cellulose HAp (CMC@HAp) nanocomposite for the removal of Pb(II) ions is not investigated. Similarly much work has not been done on the use of HAp, CTS, CMC or CMC@HAp and CTS@HAp for the removal of azo dye, acid yellow 220.

Therefore this work proposes a novel approach to create porous HAp polymer nanocomposites using CTS and CMC as biopolymers with rapid, cost effective way while avoiding cumbersome procedures like freeze drying, calcination, high pH environment and lengthy aging time.20 In situ biomimetic approach was utilized to obtain HAp polymer matrices with an ordered structure and the HAp polymer nanocomposites were used as adsorbent materials for the removal of common water contaminants such as heavy metals (Pb(II)) and dye molecules (acid yellow 220).

Experimental section

Materials and methods

A simple biomimetic approach was employed to synthesize HAp polymer blends using CTS and CMC, motivated by the reported work on this area.20,41–43

Preparation of CMC@HAp composite

40% w/w carboxymethyl cellulose solution was prepared by dissolving carboxymethyl cellulose (CMC, low viscosity, Sigma Aldrich) in water until a homogeneous clear solution was obtained. It was mixed with 25 mL of 0.25 M Ca(NO3)2 (99%, Sigma Aldrich) solution and added in to 25 mL of 0.15 M (NH4)2HPO4 (≥99%, Sigma Aldrich) drop wise (Ca/P = 1.67) under vigorous stirring at room temperature. The pH was adjusted to 8–8.5 using ammonia (25%, Sigma Aldrich) as the base. Stirring was continued for two hours and the obtained suspension was filtered, washed and dried.

Preparation of CTS@HAp composite

A similar approach was used to create the CTS@HAp composite. Briefly, 40% w/w chitosan (CTS, medium molecular weight-CTS, 85% deacetylated, Sigma Aldrich) in acetic acid medium was prepared by dissolving chitosan in acetic acid (≥99%, Sigma Aldrich) provided with vigorous stirring. The dissolved chitosan was mixed with 25 mL of 0.25 M Ca(NO3)2 (99%, Sigma Aldrich) solution and added in to 25 mL of 0.15 M (NH4)2HPO4 (≥99%, Sigma Aldrich) drop wise (Ca/P = 1.67) under vigorous stirring at room temperature. The pH was maintained at 8–8.5 using ammonia (25%, Sigma Aldrich). Vigorous stirring was continued for two hours. The resulting precipitate was filtered, washed and dried. The solids of each system were milled until a fine powder is obtained. This powder was used for further characterization purposes.

Characterization techniques

The powder X-ray diffraction (PXRD) analysis of synthesized HAp nanoparticles was performed by recording the X-ray diffraction pattern with Cu Kα radiation (λ = 1.5418 Å, Bruker D8 Focus X-Ray-Diffractometer) over the range of 5–80°. The crystallite size of each system was obtained by the Scherrer equation22 and the crystallite size can be calculated as follows,
 
image file: c6ra22662k-t1.tif(1)
where Xhkl is the crystallite size (nm), λ is the wavelength of the monochromatic X-ray beam which is 1.5418 Å for Cu Kα radiation, β is the full width of half maximum (FWHM) for the diffraction peak under consideration (rad), θ is the diffraction angle (°) and K is a dimension shape factor of value 0.9.

The interactions of the respective components and the formation of HAp was determined by the Fourier transform infra-red (FT-IR) spectroscopy, using the diffuse reflectance mode over the range of 400–4000 cm−1 using Bruker Vertex 80. The size and the morphology of the composites were examined under the Scanning Electron Microscope (SEM) SU 6600 HITACHI. Thermal degradation pattern of the respective samples was analysed using Thermogravimetric analysis (TGA) which was performed using SDT Q 600 Thermogravimetric Analyzer and the samples were heated at a ramp of 20 °C min−1 in air with a temperature range from room temperature to 1000 °C. The chemical composition was assessed by XGT-5200 X-ray fluorescence spectrometer (Horiba). Further, the specific surface area was determined using N2 gas adsorption based on the multipoint BET method (77.35 K, Quantachrome Nova 2200, gas sorption analyzer).

These composites were then assessed for their ability to participate in heavy metal removal and toxic dye waste removal. Results were analysed to understand the potential use of CMC@HAp and CTS@HAp for various applications.

Computational modeling of the binding of CTS to HAp

The isolated monomer unit of chitosan polymer was evaluated using Hartree–Fock method in conjunction with a 6-31G(d) basis set. The system was optimized in aqueous medium by utilizing the Polarizable Continuum Model (PCM) which is a widely used implicit solvation model. The free energy change (ΔG) corresponding to two binding modes of Ca2+ and chitosan was examined.

• System A – Ca2+ binding to a single chitosan monomer/three chitosan monomer units.

• System B – Ca2+ binding to two different chitosan units/two trimer units.

The ΔG values corresponding to the two binding modes were compared in order to identify the preferred binding mode of chitosan and Ca2+ ions. All calculations were performed using the Gaussian 09 software package on Linux platform. Simulations were run on an Intel® Core™ i7-5500U processor featuring 8 GBs of RAM.

Pb(II) ion adsorption studies

Pb(NO3)2 from Sigma Aldrich was used in the preparation of stock Pb(II) solution of concentration 6000 ppm. The working Pb(II) ion solutions were prepared by diluting the Pb(II) stock solution. The concentration of Pb2+ ions in all the test samples was determined by the atomic absorption spectroscopy (AAS-Hitachi 2-8100 spectrophotometer). All experiments were carried out in triplicate and the mean of the quantitative results was used for the further calculations.

Batch sorption experiments

Adsorption isotherm studies of CMC@HAp and CTS@HAp for Pb(II) removal was studied using the batch adsorption process. Each of the batch adsorption test was carried out by placing a constant amount of the adsorbent with different concentrations of Pb(II) ion solution. The detailed procedure is given below and all the experiments were carried out at ambient temperature (298 K).

Effect of initial Pb(II) ion concentration

The influence of the initial Pb(II) ion concentration on the adsorption process was investigated by mixing 0.05 g of HAp (CMC@HAp and CTS@HAp) with 10.0 mL of Pb(II) solution in different concentration (2500, 3000, 3500, 5000, 6000 ppm). Then the mixture was agitated at 200 rpm at pH 6.0 (experimentally determined optimum pH) for a specific period of time (experimentally determined optimum time of 3 minutes for CMC@HAp and 30 seconds for CTS@HAp). Then the adsorbent was filtered from the solution and the Pb(II) content in the filtrate was analyzed by AAS with necessary dilution.

Generally the equilibrium relationships between the adsorbate and the adsorbent are illustrated by the adsorption isotherms.71 The equilibrium adsorption isotherm is a fundamental property which describes the amount of adsorbate adsorbed on to the adsorbent and the concentration of the dissolved adsorbate at the equilibrium.51,72 Moreover these isotherm models are used to understand the mechanism of adsorption. The equilibrium data are generally explained by two common models which includes the Langmuir and Freundlich isotherms.

In Langmuir model it assumes the monolayer adsorption on to the surface of the adsorbate having a finite number of identical sites and its linear form can be expressed as below,

 
image file: c6ra22662k-t2.tif(2)
where Ce is the equilibrium concentration, Qe is the equilibrium sorption capacity (mg g−1), K (L mg−1) is the equilibrium adsorption constant which is related to the affinity of the binding sites and qm (mg g−1) is the maximum amount of Pb adsorbed in to a unit mass of the adsorbent when all the binding sites are being occupied.49,51,72

On the other hand, Freundlich isotherm is an empirical model which describes about the adsorption on heterogeneous surfaces6,51,72 via multilayer adsorption and with non-uniform heat adsorption distribution.51 The simplified Freundlich equation is as follows,

 
image file: c6ra22662k-t3.tif(3)
where Kf ((mg g−1) (L mg−1)1/n) and n are the Freundlich constants and they are related to the adsorption level and the adsorption intensity respectively.49

The data obtained from batch adsorption studies was fitted according to these Freundlich and Langmuir adsorption models.

Effect of the contact time

The effect of the contact time on the sorption capacity was studied by adding 0.05 g of the adsorbent (CMC@HAp/CTS@HAp) to 10.0 mL of 1000 ppm Pb(II) ion solution and the mixture was shaken at 200 rpm at room temperature at pH 6.0 over 0–90 minutes. The regular procedure of filtering and analysis was performed to find the sorption capacity as follows
 
image file: c6ra22662k-t4.tif(4)
where C0 and Ct represent the Pb(II) ion concentration before and after the adsorption in mg dm−3, V is the volume (dm3) of the Pb(II) ion solution and ‘m’ is the amount of the adsorbent in (g) used over the period of time.

Effect of pH on the adsorption

The effect of pH over the range of 2.5–7.5 was studied using 0.05 g of the adsorbent and 10.0 mL of 1000 ppm Pb(II) solution at room temperature with a shaking speed of 200 rpm, over a period of time (experimentally determined optimum time). After the filtering process the filtrate was analysed by AAS to find the sorption capacity as given in eqn (4).

Removal of azo-metal textile dye

Acid yellow 220 (AY220), commercially known as Lanaset yellow 2R59 was supplied by a local textile factory and was used without further purification (Fig. 1).
image file: c6ra22662k-f1.tif
Fig. 1 Chemical structure of acid yellow 220 (Lanaset yellow 2R).

Batch sorption experiments of the dye

0.025 g of the adsorbent (CMC@HAp) was added in to 10.0 mL of the freshly prepared dye solution of concentration 50, 100, 200, 300, 400 and 500 ppm. Mixture was then agitated at 200 rpm for experimentally determined optimum time of 90 minutes at room temperature. Aqueous dye layer was then separated using centrifugation and the concentration was determined using the UV/Visible spectrophotometer (λmax = 436 nm). The data obtained was fitted in to the two isotherm models, Freundlich and Langmuir isotherms.

Exact procedure was repeated for CTS@HAp nanocomposite except for the optimal time of contact where it was 45 minutes.

Before moving with the batch adsorption studies, the optimal contact time of the dye with both composite systems (CMC@HAp and CTS@HAp) was found experimentally and it was 90 minutes and 45 minutes for CMC@HAp and CTS@HAp respectively.

The effect of pH for the adsorption process was also investigated as in Pb(II) removal studies. 0.010 g from the each adsorbent was separately added to a dye solution having a concentration of 200 ppm and 500 ppm for CMC@HAp and CTS@HAp systems. This was agitated at 200 rpm over the pH range of 2.5–7.5 for a specific period of time (experimentally determined optimum time). The residual dye amount remaining in the solution was collected by centrifugation and analysed spectrometrically to find the sorption capacity as given in eqn (4).

Results and discussion

Morphological characterization of CMC@HAp and CTS@HAp composites using SEM

The morphology and the size of HAp polymer nanocomposites synthesized was determined using scanning electron microscopy. The scanning electron micrograph obtained for CMC@HAp nanocomposite is given in Fig. 2a. According to the image the majority of nanoparticles were in the size of 10 nm. However, a few nano particles with the size of 5 and 15 nm could also be found. By looking at the shape and the surface structure, morphology could be stated as having sponge texture with many pores. A similar morphology of HAp has not yet been reported to the best of our knowledge.
image file: c6ra22662k-f2.tif
Fig. 2 SEM micrograph of polymer incorporated HAp nanoparticle systems (a) CMC@HAp and (b) CTS@HAp.

However in the CTS@HAp system (Fig. 2b), the addition of CTS during the synthesis had steered to an interconnected porous HAp scaffold with high monodispersity. It had generated a coral like appearance with pore diameter of 20–30 nm and a particle diameter of 25–30 nm.

Characterization of CMC@HAp and CTS@HAp using FT-IR spectroscopy

Fig. 3 represents the FT-IR spectra of CMC@HAp and CTS@HAp separately, giving the comparison of composites with the neat HAp nanoparticles and neat polymer. According to the spectra, intense peaks at 963, 1040, 1099 cm−1 of the phosphate stretching vibration5,18,21,29 which can be seen in neat HAp were present in both composites, CMC@HAp and CTS@HAp. Additionally peaks at 605 cm−1 and 569 cm−1 corresponding to phosphate bending vibration of HAp18,21,29 were present in both, composites revealing the formation of HAp nanoparticles. Moreover the presence of apatite –OH in neat HAp and composites was evidenced with bands at 3570 cm−1 and 632 cm−1.21,29
image file: c6ra22662k-f3.tif
Fig. 3 FT-IR spectra of (a) (i) neat CMC, (ii) CMC@HAp, (iii) neat HAp, (b) (i) neat CTS, (ii) CTS@HAp, (iii) neat HAp.

There is a significant broadening observed at –OH stretching region of the spectrum of CMC@HAp nanocomposite given in Fig. 3a. Additionally, the appearance of –CH2 stretching vibrations18,19,21 at 2863 cm−1 and the increase of the –OH bending at 1645 cm−1 was clearly observed.19 Furthermore the appearance of –OH vibrational bands of apatite at 3570 cm−1 and 632 cm−1 had become extra weak.19 The –COO stretching of the neat CMC had shifted to 1550 cm−1 from 1598 cm−1, in the composite sample. Therefore it was reasonable to believe that the –COO groups could interact with the Ca2+ ions which could create a shift in the COO vibrational band. This mechanism of interaction is further explained in Fig. 4a. As suggested by this mechanism, the carboxylate groups present in CMC were connected to calcium ions as shown in the picture due to strong electrostatic interaction to form CMC–Ca2+ complex. Due to the high number of carboxylate groups, simultaneously this could take place in many sites. After addition of (NH4)2HPO4, the PO43− ions had interacted with the complex sites of CMC–Ca2+. As these complex sites were separated, initially HAp nanoparticles would nucleate on those points and later the growth of the nanoparticles would have given rise to this sponge texture.


image file: c6ra22662k-f4.tif
Fig. 4 The mechanism of formation of polymer composites (a) CMC@HAp and (b) CTS@HAp.

Fig. 3b, depicts the FT-IR spectrum obtained for CTS@HAp nanocomposite. It exhibited a very broad –OH stretching region at 3550–3000 cm−1.3,21,29 There were some additional peaks at 2885 and 1668 cm−1, which correspond to –CH2 symmetric stretching vibration18,19,21 and amide I (C[double bond, length as m-dash]O) vibrational modes respectively.21 Furthermore the presence of CTS in the HAp nanocomposite could affect on the PO43− bonding and could lead to the broadening of phosphate vibrational bands21 as observed in Fig. 3b. This could be due to the phosphorylation of CTS with the interaction of PO43− groups.21 The absence of peaks corresponding to HPO42− impurities and CO32− species indicated the purity of HAp nanocomposites.

The proposed mechanism of formation of CTS@HAp as given in Fig. 4b shows that, either the Ca2+ ions can interact with one chitosan molecule or with two amino and two hydroxyl groups from two chitosan molecules which will come and coordinate as previously proposed for the Cu2+ ion interaction to CTS.54,73 In order to examine the possible coordination site of Ca2+ to CTS theoretical modelling was carried out using ligands that would most likely to ligate with Ca2+. According to our theoretical modelling studies, it was found that interaction of one amino and one –OH group from a single CTS monomer as shown in the Fig. 4b(i) had resulted in the lowest free energy (ESI) implying the most probable complex of Ca2+ with CTS. Similarly the polymer matrix would allow Ca2+ ions to trap in between the chitosan polymer molecules at specified locations with the addition of (NH4)2HPO4, where the PO43− groups could localize in the predetermined locations of Ca2+ ions and would have had directed to the formation of HAp with a coral like texture having bumpy, contour surface. In addition, the phosphorylation of CTS by the added PO43− groups could also take place21 (Fig. 4b(ii)), further strengthening the interaction of CTS with HAp.

In both systems, the incorporation of the polymer had tailored a novel type of appearance to the composites. Being large and bulky, these polymers can exert a good steric hindrance74,75 during the nucleation and growth of nanoparticles thereby modulating the crystallization and appearance of the HAp nanoparticles. In addition, the preparation of CTS@HAp and CMC@HAp porous composite had eliminated the use of calcination and freeze drying techniques to obtain the porosity in contrast with previous reports.2,15,19,31

Characterization of CMC@HAp and CTS@HAp using powder X-ray diffraction (PXRD)

The comparison of the XRD pattern of the two materials, CMC@HAp and CTS@HAP with neat HAp is given in Fig. 5. Neat HAp and both composite samples were in accordance with the hexagonal HAp19 having the space group P63/m (JCPDS PDF ref. 01.072.1243). The absence of other peaks corresponding to impurities imply that the two composites were in pure HAp form. However the incorporation of polymers like CMC and CTS during the preparation of HAp had resulted in broad peaks revealing a low crystalline nature.19,29 Of those two composites, CMC@HAp showed more amorphous/low crystalline nature. The true crystallite sizes obtained from the Scherrer equation are given in Table S1. In this study, [002] was appearing alone without the interference from other peaks and was selected to measure the line broadening to calculate the FWHM. And it is evidenced from the Table S1 that the lowering of the crystallinity of the two systems had led to the lowering of the crystallite size as well. The crystallite size of the nanoparticles for two systems are closer to each other and however, the size of CMC@HAp is slightly lower when compared with the CTS@HAp.
image file: c6ra22662k-f5.tif
Fig. 5 Comparison of XRD patterns of (a) neat HAp nanoparticles, (b) CMC@HAp, (c) CTS@HAp.

Furthermore the elemental results obtained from XRF data (ESI, Table S1) exhibited that the Ca/P ratio was less than 1.67 and these results were in good agreement with previously published data of polymer based HAp nanocomposites.2,19,21,29

Characterization of CMC@HAp and CTS@HAp using thermo gravimetric analysis

The incorporation of the polymer in to the HAp matrix was further evidenced by the thermal degradation pattern of the two systems. As given in Fig. 6 the degradation pattern of the each system was compared with the neat HAp and neat polymer samples. In CMC@HAp system it was evidenced that 23.4% weight loss was due to the incorporation of CMC, whereas in CTS@HAp system it was 23.6%. In both situations the weight loss up to 200 °C was due to the removal of absorbed as well as adsorbed water19 in the composite and after 250 °C the weight loss accounted the degradation of polymer by evolution of CO2.19
image file: c6ra22662k-f6.tif
Fig. 6 (a) Thermal degradation of CMC@HAp compared with neat HAp, (b) thermal degradation of CTS@HAp compared with neat HAp.

Specific surface area characterization by multi-point BET analysis

Specific surface area of these nanocomposites was analysed using BET isotherms. From multipoint specific BET surface area calculation (ESI, Fig. S1a and b) it was found that CMC@HAp and CTS@HAp had specific surface area of 70.709 m2 g−1 and 119.022 m2 g−1 respectively. These values further confirmed the porous behavior and high surface area of CTS@HAp. Most of the previously reported high surface area HAp nanoparticles have obtained through either calcination at high temperatures76–78 or by using long digestion period. However, our study neither involved calcination nor long digestion period,79 hence according to our knowledge the CTS@HAp system showed the highest reported surface area for the polymer based HAp nanocomposite prepared using facile conditions. This suggests the possible application of these composites for the removal of heavy metals and textile dye stuff in water purification purposes.

The Pb(II) ion sorption capacities of different kinds of sorbent materials reported in the literature are listed in Table 1. More importantly the use of CMC incorporated HAp nanocomposite can be identified as a novel candidate for this purpose as there are no much reported work done on CMC based HAp composite for the metal ion removal from polluted drinking water. Even though CTS@HAp has been used for the heavy metal removal, our work suggests a facile as well as a greener approach to obtain more efficient ion removal mechanism.

Table 1 The sorption capacities (qm) of different adsorbent materials from the literature for the removal of Pb(II) ions
Adsorbent material qm (mg g−1) Reference
Activated carbon HAp nanocomposite 9.31 27
Nano-hydroxyapatite 83.33 27
Hydroxyapatite (HAp)/chitosan composites 132.1–103.8 8
Calcium hydroxyapatite (n-CaHAP) from phosphogypsum waste 769.23 49
Methyltrimethoxysilane coated hydroxyapatite 105.485 50
Hydroxyapatite nanorods 192.3 6
Hydroxyapatite/chitosan nanocomposite 196.1 6
Carboxylated cellulose nanofibrils-filled magnetic chitosan hydrogel beads 171.0 52
Porous graphene oxide/carboxymethyl cellulose (GO/CMC) monoliths 76.70 67
Hydroxyapatite/chitosan (HAP/CS) porous material 264.42 37
Porous chitosan 5.67 37
Cellulose graft acrylic acid 825.7 72
Hydroxyapatite nanorods 714.14 73
Hydroxyapatite nanospheres 526.31 73
Hydroxyapatite/magnetite (HAp/Fe3O4) 598.8 80
HAp alginate composite 270.3 81
Chitosan coated sand 12.32 82
Functionalized MWCNTs 43 83
Modified granular activated carbon 29.44 84


Pb(II) removal and adsorption isotherms studies

Effect of pH on Pb(II) ion adsorption. The effect of initial pH on the sorption process was studied over the pH range of 2.5–7.5. As given in Fig. 7 it is clear that pH of the medium can influence on the sorption capacity of the HAp systems and highest Pb(II) adsorption capacity was observed when the pH of the medium is above 5.5. In these two systems the –COO groups in CMC@HAp and –NH2 groups in CTS@HAp are primarily responsible for the chelation of metal ions. When the pH is lowered, the protonation of these groups, reduces the interaction of metal ions with the functional groups.72
image file: c6ra22662k-f7.tif
Fig. 7 Effect of pH on the adsorption capacity on Pb(II) ions by CMC@HAp and CTS@HAp.
Effect of contact time on Pb(II) ion adsorption. The effect of contact time was also evaluated by selecting a 1000 ppm of Pb(II) ion solution and keeping a constant amount of the adsorbent over a period of time (0–120 min). The contact time is a far most important factor as it determines the time needed for adsorption equilibrium. As shown in Fig. 8 the removal of Pb(II) ions by CTS@HAp was superior than the removal ability of CMC@HAp. CTS@HAp reached the equilibrium where the removal percentage had reached up to 99.64% within 30 seconds of incubation. In the case of CMC@HAp the equilibrium was reached after 3 minutes with the removal percentage of 99.66%. Nevertheless both composites had shown a very fast and efficient removing of Pb(II) ions compared with the neat HAp sample27 which shows only 62% of removal after 2 hours. It was clear that both CTS@HAp and CMC@HAp were far superior than the neat HAp. To the best of our knowledge these two HAp polymer composites were the most efficient ever recoded for the removal of Pb(II) ions.
image file: c6ra22662k-f8.tif
Fig. 8 Effect of contact time on the adsorption capacity of Pb(II) ions by (a) CMC@HAp and (b) CTS@HAp.
Effect of initial concentration of Pb(II) ions. The influence of the initial Pb(II) ion concentration was also assessed using different Pb(II) concentration ranging from 2500–6000 ppm, under an optimal pH and contact time of 3 minutes for CMC@HAp and 30 seconds for CTS@HAp respectively. It is clearly seen that the Pb adsorption capacity of CMC@HAp and CTS@HAp (ESI, Fig. S2) was initially increased with the increase of the Pb ion content and had reached to a maximum equilibrium uptake of 625.0 mg g−1 and 909.1 mg g−1 for CMC@HAp and CTS@HAp respectively. Thereafter the sorption capacity hasn't significantly changed with the increase of the initial Pb(II) concentration.
Batch adsorption studies on Pb(II) ion adsorption. Based on the batch adsorption studies, the data were assessed by Freundlich and Langmuir isotherm models. The Fig. 9 illustrates the linear fits of the Pb(II) ion adsorption on to CMC@HAp according to the Freundlich and Langmuir models.
image file: c6ra22662k-f9.tif
Fig. 9 Adsorption isotherm of Pb(II) removal by CMC@HAp explained by (a) Freundlich model, (b) Langmuir model.

It was understood that the linear fitting of Pb(II) removal by CMC@HAp according to Freundlich model was not applicable as it had given rise to a very low R2 value (Table 2) with scattered data points. However the adsorption removal could be well explained by the Langmuir model (Table 2, high R2 value). The Freundlich constants for the removal of Pb(II) from this system were found to be 45.2 for ‘n’ and 531.3 for ‘Kf’. Since the ‘n’ value is greater than 1, it reveals that the adsorption could be a physical process if the Freundlich isotherm is considered.85 According to the Langmuir model the ‘qm’ and ‘K’ of CMC@HAp are 625.0 mg g−1 and 0.4706 L mg−1 respectively (Table 2). This indicated that CMC@HAp had higher affinity towards the Pb(II) ion adsorption and the better fitting in to the Langmuir model assumes that the surface of the adsorbent is homogeneous in nature. It could be assumed that the surface of the CMC@HAp have carboxylate groups evenly distributed supporting the electrostatic interaction between the metal ions and the carboxylate groups.

Table 2 Summary of isotherm model parameters for Pb(II) ion adsorption by CMC@HAp and CTS@HAp
    CMC@HAp CTS@HAp Neat HAp40
Langmuir model K (L mg−1) 0.4706 0.0636 0.0124
qm (mg g−1) 625.0 909.1 83.33
R2 1.000 0.9998 0.9960
Freundlich model Kf 531.3 405.2 10.62
n 45.2 8.51 3.20
R2 0.7205 0.9626 0.9880


Fig. 10 explains the adsorption isotherms of CTS@HAp for Pb(II) ion removal. It was clear that the mechanism of adsorption could be explained well with the Langmuir as well as Freundlich model owing to high R2 value (Table 2).


image file: c6ra22662k-f10.tif
Fig. 10 Adsorption isotherm of Pb(II) removal by CTS@HAp explained by (a) Freundlich model, (b) Langmuir model.

The Freundlich constants were 8.51 for ‘n’ and 405.2 for Kf. Since the ‘n’ value is greater than 1, it again indicates that even CTS@HAp facilitates physical adsorption of Pb ions on to the HAp surface. According to the Langmuir model ‘qm’ and ‘K’ constant are 909.1 mg g−1 and 0.0636 L mg−1 respectively (Table 2). This indicated that CTS@HAp was having extraordinary affinity towards the Pb(II) ion. A great sorption of Pb(II) on HAp could have originated due to the strong electrostatic interaction between the Pb2+ ions and the negatively charged species in HAp, such as PO43− and OH. This was common to both of these systems while in CTS@HAp this affinity was much more profound. This could be due to the high surface area in CTS@HAp observed in comparison to the CMC@HAp.

When adsorption isotherms were considered it was clear that CMC@HAp had facilitated the chemisorption mechanism while in the case of CTS@HAp adsorption mechanisms were both chemisorption and physisorption. Further, the comparison of qm values of CMC@HAp and CTS@HAp with neat HAp highlighted the pronounced affinity of these composites towards Pb(II) ion (Table 2).27 This again highlights the supreme ability of polymer HAp composites over the removal of heavy metals.

Even though there are reported work on the use of CMC together with other materials like graphene oxide (GO)67 and magnetic chitosan,52 this study is the first reported study for the use of CMC@HAp nanocomposite material for the removal of Pb(II) ions from the aqueous system.

Azo dye removal and isotherm studies

Effect of pH on dye adsorption. pH plays a vital role for the sorption capacity as it could influence on the surface functionalization of the adsorbent as well as the ionization of the adsorbate.59 The result of the pH variation during the adsorption process is depicted in Fig. S3 (ESI). It was evident that the sorption capacity was high at acidic pH than in alkaline pH. In both systems, a higher sorption capacity was maintained in the range of 2.5–4.5 and then it decreased with the increase of the pH due to the competition of OH ions with active sites.59
Effect of contact time on dye adsorption. The optimal contact time for the adsorption of the Lanaset dye was also studied for the two systems. As given in Fig. S4 (ESI), when acid yellow 220 was placed in CMC@HAp system it reached to a maximum percentage of dye removal at the 90th minute, where it is much faster in CTS@HAp system as it reached to a maximum at the end of 45 minutes. Therefore in CMC@HAp and CTS@HAp the optimal contact time can be considered as 90 minutes and 45 minutes respectively. Nevertheless in both systems, the dye adsorption was rapid within the first 10 minutes and later the rate became much slower. This could be explained by the abundance of the active sites of HAp initially for dye molecules and then reduction of the available active sites with the time.59 These values obtained for the optimal contact time was compared with the adsorption of Lanaset dye on to neat HAp nanoparticles as given in Fig. S5 (ESI) and found to have a lower equilibrium adsorption capacity (Fig. S5, ESI) with respect to CTS@HAp and CMC@HAp.
Effect of initial dye concentration. After finding the optimum pH and the contact time for the optimal adsorption, the effect of initial dye concentration was assessed by varying the amount of the dye at a constant weight of the adsorbent (Fig. S6, ESI). However in this study the pH of the medium was maintained at 6 as the maintainance of the low pH is not practically possible in industrial applications.
Batch adsorption studies on dye removal. The equilibrium data obtained from batch adsorption studies was used to fit the isotherm patterns as given in Fig. 11 and 12. Further more Table 3 summarizes the data obtained from each isotherm model for the adsorption of the Lanaset dye by CMC@HAp and CTS@HAp.
image file: c6ra22662k-f11.tif
Fig. 11 Adsorption isotherm of azo dye removal by CMC@HAp explained by (a) Freundlich model, (b) Langmuir model.

image file: c6ra22662k-f12.tif
Fig. 12 Adsorption isotherm of azo dye removal by CTS@HAp explained by (a) Freundlich model, (b) Langmuir model.
Table 3 Summary of the isotherm adsorption parameters for acid yellow 220 removal by CMC@HAp and CTS@HAp
    CMC@HAp CTS@HAp Neat HAp
Langmuir model K (L mg−1) 0.0072 0.0068 0.0035
qm (mg g−1) 200.0 303.0 169.5
R2 0.9832 0.9730 0.8655
Freundlich model Kf 2.797 3.110 1.022
n 1.366 1.255 1.246
R2 0.9719 0.9944 0.9648


It is clear from the above data that the dye adsorption by CMC@HAp and CTS@HAp could be explained by both isotherm models due to high R2 values. However in CMC@HAp, the results showed that the Langmuir isotherms fits better. The ‘qm’ was found to be 200 mg g−1 and ‘K’ was found to be 0.0072. This suggests that CMC@HAp has a very good affinity towards the binding of acid yellow 220. Freundlich constant ‘n’, 1.366 for this system further confirmed the adsorption of the dye molecules was by a physical process.85

In CTS@HAp system, the adsorption pattern was more predictable by the Freundlich model. The ‘qm’ was found to be 303.0 mg g−1 and the ‘K’ was 0.0068. The Freundlich constants ‘n’ and ‘Kf’ were found to be 1.255 and 3.110 respectively. As this model fitted well with the Freundlich isotherm model, it could be deduced that the adsorption of the dye could occur via multilayer sorption process.51

According to Table 3, it was evident that, in neat HAp, the adsorption pattern was more predictable by the Freundlich isotherm (higher R2 value). However when compared with CTS@HAp and CMC@HAp, the maximum adsorption capacity of neat HAp (Table 3) over Lanaset dye was much lower. There are only few reported work on the adsorption removal of acid yellow 220 (ref. 59 and 86) using agro residues as sorbent materials. The use of chitosan, carboxymethyl cellulose, hydroxyapatite composites could be considered as novel approaches for the removal of acid yellow 220. Moreover the sorption capacities obtained for CMC@HAp and CTS@HAp in this study were extremely higher than the most of the commonly used adsorbent materials reported.59,86

Conclusions

Two natural polysaccharide based nanobiocomposites were synthesized via a facile in situ approach eliminating the use of high pH, lengthy processing time, energy and time consuming protocols to obtain porous HAp nanoparticles. SEM images revealed that the presence of polymers during the preparation of HAp had produced composites with high monodispersity. Pb(II) ion adsorption studies conducted for composites had suggested that the CMC@HAp and CTS@HAp could be used as powerful sorbent materials for the removal of lead and CTC@HAp had shown very high adsorption capacity with respect to CMC@HAp. To the best of our knowledge these composites report the fastest ever known contact times for Pb(II) removal. In addition these composites possess an outstanding affinity towards the binding of azo dyes such as Lanaset yellow 2R, where the maximum adsorption capacity exceeded the values already reported by the other systems.

Acknowledgements

Authors like to extend the sincere gratitude to National Research Council Sri Lanaka (NRC 14-016) for the financial support provided. The authors are also grateful for the science team at SLINTEC and the technical officers at Department of Chemistry, University of Colombo for the necessary support provided during the characterization purposes, specially to Dr Nuwan de Silva, Mrs Malini Damayanthi, Mrs Induni Siriwardena and Mr P. G. W. Ariyasena.

References

  1. R. K. Singh, A. M. El-Fiqi, K. D. Patel and H. W. Kim, Mater. Lett., 2012, 75, 130–133 CrossRef CAS.
  2. H. A. M. Romero, J. M. Ruacho, C. A. M. Pérez and P. E. G. Casillas, J. Mater., 2013, 2013, 1–5 Search PubMed.
  3. L. Jiang, Y. Li, L. Zhang and X. Wang, Mater. Sci. Eng., C, 2009, 29, 193–198 CrossRef CAS.
  4. L. Alireza, S. Naznin and M. Z. Razauden, Adv. Mater. Res., 2014, 1030–1032, 2364–2367 CrossRef.
  5. Y. Han, X. Wang and S. Li, J. Nanopart. Res., 2009, 11, 1235–1240 CrossRef CAS.
  6. A. M. Mohammad, T. A. S. Eldin and B. E. El-anadouli, Arabian J. Chem., 2015, 1–7 Search PubMed.
  7. T. A. Salah, A. M. Mohammad, M. A. Hassan and B. E. El-Anadouli, J. Taiwan Inst. Chem. Eng., 2014, 45, 1571–1577 CrossRef CAS.
  8. S. Park, A. Gomez-flores, Y. S. Chung and H. Kim, J. Chem., 2015, 2015, 1–12 CrossRef.
  9. Y. Lei, J. Guan, W. Chen, Q. Ke and C. Zhang, RSC Adv., 2015, 5, 25462–25470 RSC.
  10. S. Dasgupta, A. Bandyopadhyay and S. Bose, Langmuir, 2010, 26, 4958–4964 CrossRef CAS PubMed.
  11. N. Zhang, T. Gao, Y. Wang, Z. Wang, P. Zhang and J. Liu, Mater. Sci. Eng., C, 2015, 46, 158–165 CrossRef CAS PubMed.
  12. C. C. Ribeiro, C. C. Barrias and M. A. Barbosa, Biomaterials, 2004, 25, 4363–4373 CrossRef CAS PubMed.
  13. G. Bharath, A. J. Kumar, K. Karthick, D. Mangalaraj, C. Viswanathana and N. Ponpandian, RSC Adv., 2014, 4, 37446–37457 RSC.
  14. J. Roul, R. Mohapatra and S. K. Sahoo, Asian J. Biomed. Pharm. Sci., 2013, 03, 33–38 Search PubMed.
  15. J. Liuyun, L. Yubao and X. Chengdong, J. Biomed. Sci., 2009, 16, 65 CrossRef PubMed.
  16. N. Murillo-cremaes, A. M. López-periago, J. Saurina, A. Roig and C. Domingo, J. Supercrit. Fluids, 2013, 73, 34–42 CrossRef CAS.
  17. R. Abdeen and N. Salahuddin, J. Chem., 2013, 2013, 1–9 CrossRef.
  18. M. R. Nikpour, S. M. Rabiee and M. Jahanshahi, Composites, Part B, 2012, 43, 1881–1886 CrossRef CAS.
  19. V. T. Kalinnikov and A. E. Chalykh, Inorg. Mater., 2005, 41, 509–515 CrossRef.
  20. L. Jiang, Y. Li, X. Wang, L. Zhang, J. Wen and M. Gong, Carbohydr. Polym., 2008, 74, 680–684 CrossRef CAS.
  21. R. Kumar, K. H. Prakash, P. Cheang, L. Gower and K. A. Khor, J. R. Soc., Interface, 2008, 5, 427–439 CrossRef CAS PubMed.
  22. B. Palazzo, M. Iafisco, M. Laforgia, N. Margiotta, G. Natile, C. L. Bianchi, D. Walsh, S. Mann and N. Roveri, Adv. Funct. Mater., 2007, 17, 2180–2188 CrossRef CAS.
  23. V. Uskoković and T. A. Desai, J. Pharm. Sci., 2014, 103, 567–579 CrossRef PubMed.
  24. D. Li, Y. Zhu and Z. Liang, Mater. Res. Bull., 2013, 48, 2201–2204 CrossRef CAS.
  25. M. P. Ferraz, A. Y. Mateus, J. C. Sousa and F. J. Monteiro, J. Biomed. Mater. Res., Part A, 2007, 81, 994–1004 CrossRef CAS PubMed.
  26. K. S. M. Udayakantha, R. M. De Silva, K. M. N. De Silva and C. Hettiarachchi, RSC Adv., 2015, 5, 64696–64703 RSC.
  27. M. S. Fernandoa, R. M. de Silva and K. M. N. de Silva, Appl. Surf. Sci., 2015, 351, 95–103 CrossRef.
  28. G. Vasugi and E. K. Girija, Cellul. Chem. Technol., 2015, 49, 87–91 CAS.
  29. F. Chen, Z. C. Wang and C. J. Lin, Mater. Lett., 2002, 57, 858–861 CrossRef CAS.
  30. Y. H. Tseng, C. S. Kuo, Y. Y. Li and C. P. Huang, Mater. Sci. Eng., C, 2009, 29, 819–822 CrossRef CAS.
  31. H. Li, J. Biomater. Nanobiotechnol., 2010, 01, 42–49 CrossRef CAS.
  32. I. A. Figueroa, O. Novelo-Peralta, C. Flores-Morales, R. González-Tenorio and M. C. Piña-Barba, Biomatter, 2012, 2, 71–76 CrossRef PubMed.
  33. N. Iqbal, M. R. Abdul Kadir, N. A. N. Nik Malek, N. H. Bin Mahmood, M. R. Murali and T. Kamarul, Mater. Res. Bull., 2013, 48, 3172–3177 CrossRef CAS.
  34. T. Y. Liu, S. Y. Chen, J. H. Li and D. M. Liu, J. Controlled Release, 2006, 112, 88–95 CrossRef CAS PubMed.
  35. R. N. Wijesena, N. Tissera, R. Perera and K. M. N. De Silva, Carbohydr. Polym., 2014, 109, 56–63 CrossRef CAS PubMed.
  36. R. N. Wijesena, N. Tissera, Y. Y. Kannangara, Y. Lin, G. A. J. Amaratunga and K. M. N. De Silva, Carbohydr. Polym., 2015, 117, 731–738 CrossRef CAS PubMed.
  37. A. J. Nathanael, S. S. Han and T. H. Oh, J. Nanomater., 2013, 2013, 1–8 CrossRef.
  38. X. Zhanga and K. S. Vecchio, J. Cryst. Growth, 2007, 308, 133–140 CrossRef.
  39. N. Monmaturapoj, J. Met., Mater. Miner., 2008, 18, 15–20 CAS.
  40. C. P. García, C. Paucar, J. Gaviria and A. Durán, Key Eng. Mater., 2005, 284–286, 47–50 CrossRef.
  41. J. D. Hartgerink, E. Beniash and S. I. Stupp, Science, 2010, 294, 1684 CrossRef PubMed.
  42. G. Wei, J. Reichert, J. Bossert and K. D. Jandt, Biomacromolecules, 2008, 9, 3258–3267 CrossRef CAS PubMed.
  43. S. Mollazadeh, J. Javadpour and A. Khavandi, Ceram. Int., 2007, 33, 1579–1583 CrossRef CAS.
  44. F. Akhtar, L. Andersson, S. Ogunwumi, N. Hedin and L. Bergström, J. Eur. Ceram. Soc., 2014, 34, 1643–1666 CrossRef CAS.
  45. C. Pelekani and V. L. Snoeyink, Carbon, 2000, 38, 1423–1436 CrossRef CAS.
  46. Y. Li, W. Tjandra and K. C. Tam, Mater. Res. Bull., 2008, 43, 2318–2326 CrossRef CAS.
  47. Z. Su, J. Li, Z. Ouyang, M. M. L. Arras, G. Wei and K. D. Jandt, RSC Adv., 2014, 4, 14833 RSC.
  48. P. Gentile, C. Wilcock, C. Miller, R. Moorehead and P. Hatton, Materials, 2015, 8, 2297–2310 CrossRef.
  49. S. M. Mousa, N. S. Ammar and H. A. Ibrahim, J. Saudi Chem. Soc., 2014, 20, 357–365 CrossRef.
  50. C. S. Ciobanu, S. L. Iconaru, C. L. Popa, A. Costescu and D. Predoi, J. Nanomater., 2014, 2014, 1–9 Search PubMed.
  51. S. S. Samandari, S. S. Samandari, S. Heydaripour and M. Abdouss, J. Environ. Manage., 2016, 166, 457–465 CrossRef PubMed.
  52. Y. Zhoua, S. Fu, L. Zhanga, H. Zhana and M. V. Levit, Carbohydr. Polym., 2014, 101, 75–82 CrossRef PubMed.
  53. G. Z. Kyzas, J. Fu and K. A. Matis, Materials, 2013, 6, 5131–5158 CrossRef.
  54. F. Zhao, B. Yu, Z. Yue, T. Wang, X. Wen, Z. Liu and C. Zhao, J. Hazard. Mater., 2007, 147, 67–73 CrossRef CAS PubMed.
  55. E. Pajootan, M. Arami and N. Mohammad, J. Taiwan Inst. Chem. Eng., 2012, 43, 282–290 CrossRef CAS.
  56. M. El Haddad, R. Slimani, R. Mamouni, S. ElAntri and S. Lazar, J. Assoc. Arab Univ. Basic Appl. Sci., 2013, 14, 51–59 Search PubMed.
  57. M. A. Ashraf, M. Hussain, K. Mahmood, A. Wajid, M. Yusof, Y. Alias and Y. Yusoff, Desalin. Water Treat., 2013, 51, 4530–4545 CrossRef CAS.
  58. H. E. L. Boujaady, E. R. Abdelhadi, M. B. Ziatni, R. El Hamri, A. Taitai and J. L. Lacout, Desalination, 2011, 275, 10–16 CrossRef.
  59. F. Deniz and S. Karaman, Microchem. J., 2011, 99, 296–302 CrossRef CAS.
  60. R. K. Gautam, A. Mudhoo and M. C. Chattopadhyaya, J. Environ. Chem. Eng., 2013, 1, 1283–1291 CrossRef CAS.
  61. N. Gupta, Adv. Mater. Lett., 2011, 2, 309–312 CrossRef CAS.
  62. K. Allam, A. El Bouari, B. Belhorma and L. Bih, J. Water Resour. Prot., 2016, 8, 358–371 CrossRef.
  63. W. Lemlikchi, P. Sharrock, M. Fiallo, A. Nzihou and M. O. Mecherri, Procedia Eng., 2014, 83, 378–385 CrossRef CAS.
  64. N. Barka, A. Assabbane, A. Nounah, L. Laanab and Y. A. Ichou, Desalination, 2009, 235, 264–275 CrossRef CAS.
  65. N. Gupta, A. K. Kushwaha and M. C. Chattopadhyaya, J. Taiwan Inst. Chem. Eng., 2011, 43, 125–131 Search PubMed.
  66. R. Bazargan-Lari, M. E. Bahrololoom and A. Nemati, J. Food, Agric. Environ., 2011, 9, 892–897 CAS.
  67. Y. Zhanga, Y. Liu, X. Wang, Z. Suna, J. Mab, T. Wub, F. Xing and J. Gaob, Carbohydr. Polym., 2014, 101, 392–400 CrossRef PubMed.
  68. S. Chen, Y. Zou, Z. Yan, W. Shen, S. Shi, X. Zhang and H. Wang, J. Hazard. Mater., 2009, 161, 1355–1359 CrossRef CAS PubMed.
  69. S. Yang, S. Fu, H. Liu, Y. Zhou and X. Li, J. Appl. Polym. Sci., 2011, 119, 1204–1210 CrossRef CAS.
  70. M. Ahmad and S. Ahmed, Indian J. Pharmacol., 2015, 2, 280–289 CAS.
  71. Z. Abbasi and M. Aghababaei, Universal Journal of Engineering Science, 2014, 2, 124–129 Search PubMed.
  72. Y. Zhou, L. Zhang, S. Fu, L. Zheng and H. Zhan, BioResources, 2012, 7, 2752–2765 CAS.
  73. A. J. Al-manhel, A. R. S. Al-hilphy and A. K. Niamah, J. Saudi Soc. Agric. Sci., 2016 Search PubMed , in press.
  74. N. M. Sultan and M. R. Johan, Sci. World J., 2014, 2014, 1–7 CrossRef PubMed.
  75. F. He and D. Zhao, Environ. Sci. Technol., 2007, 41, 6216–6221 CrossRef CAS PubMed.
  76. A. R. Ibrahim, X. Li, Y. Zhou, Y. Huang, W. Chen, H. Wang and J. Li, Int. J. Mol. Sci., 2015, 16, 7960–7975 CrossRef CAS PubMed.
  77. A. R. Ibrahim, Y. Zhou, X. Li, L. Chen, Y. Hong, Y. Su, H. Wang and J. Li, Mater. Res. Bull., 2015, 62, 132–141 CrossRef CAS.
  78. M. Uota, H. Arakawa, N. Kitamura, T. Yoshimura, J. Tanaka and T. Kijima, Langmuir, 2005, 21, 4724–4728 CrossRef CAS PubMed.
  79. C. Verwilghen, S. Rio, A. Nzihou, D. Gauthier, G. Flamant and P. J. Sharrock, J. Mater. Sci., 2007, 42, 6062–6066 CrossRef CAS.
  80. L. Dong, Z. Zhu, Y. Qiu and J. Zhao, Chem. Eng. J., 2010, 165, 827–834 CrossRef CAS.
  81. F. Googerdchian, A. Moheb and R. Emadi, Chem. Eng. J., 2012, 200–202, 471–479 CrossRef CAS.
  82. M. Wan, C. Kan, B. D. Rogel, M. Lourdes and P. Dalida, Carbohydr. Polym., 2010, 80, 891–899 CrossRef CAS.
  83. M. S. Tehrani, P. A. Azar, P. E. Namin and S. M. Dehagi, J. Environ. Prot., 2013, 4, 529–536 CrossRef CAS.
  84. J. Goel, K. Kadirvelu, C. Rajagopal and V. Kumar, J. Hazard. Mater., 2005, 125, 211–220 CrossRef CAS PubMed.
  85. M. B. Desta, J. Thermodyn., 2013, 2013, 1–6 CrossRef.
  86. F. Deniz, Desalin. Water Treat., 2013, 51, 4573–4581 CrossRef CAS.

Footnote

Electronic supplementary information (ESI) available. See DOI: 10.1039/c6ra22662k

This journal is © The Royal Society of Chemistry 2016