DOI:
10.1039/C6RA22646A
(Paper)
RSC Adv., 2016,
6, 108310-108314
Synthesis of TiO2@C nanospheres with excellent electrochemical properties
Received
10th September 2016
, Accepted 20th October 2016
First published on 7th November 2016
Abstract
TiO2@C nanospheres are synthesized through annealing a mixture of tetrabutyl titanate and oleic acid, as the titanium and carbon source, respectively. The as-synthesized TiO2@C with higher carbon content presents a superior specific capacity (286.5 mA h g−1 at 100 mA g−1 after 200 cycles) and higher rate performance (148 mA h g−1 at 500 mA g−1), when tested as the anode material for lithium ion batteries. The as-synthesized TiO2@C nanospheres are promising anode materials for next-generation LIBs.
1. Introduction
Nowadays, there is a hot spot in exploring green, low-cost and enduring energy storage systems to prevent global environmental contamination and resource depletion.1,2 On account of the high energy density and long cycle, lithium-ion batteries (LIBs) have become one of the most promising batteries. It is well-recognized that anode materials play an incredibly important role in LIBs.3–7 As an anode material in LIBs, graphite is commercially applied due to its good cycling and low cost.5 However, the performance has been limited by its poor rate capability due to its low Li diffusion efficiency.8,9 Thus, some metal oxides or metal oxide based compositions with carbon or carbon nanotubes (CNTs), such as Fe2O3,10 SnO2,11 Co3O4,12 MnO,13 MoO2/CNTs,14 Cr2O3,15 TiO2,16 etc., have attracted increasing attention. Wei et al. reported that solvothermally synthesized SnO2 hollow nanospheres exhibited a capacity of 509 mA h g−1 at 0.5 C.11 Cao and his co-workers reported that MnO@C octahedra could realize a capacity of 503 mA h g−1 at 100 mA g−1.13
Among these metal oxides, TiO2 has been received attention as an anode material owing to some advantages including low cost, simple preparation and high security. Besides, TiO2 possesses superior structural stability owing to its small volume variation with Li ion insertion/extraction processes.16,17 Four kinds of TiO2, anatase, rutile, brookite and TiO2–B, have been studied as anode materials for LIBs.18,19 Among them, anatase TiO2 has been regarded as one of the most potential anode materials because of its high theoretical capacity (about 335.5 mA h g−1). Simultaneously, it can be optimized by various synthetic methods. Moreover, TiO2 shows a considerable improvement in safety due to its high voltage plateau at about 1.7 V versus Li+/Li, which could efficaciously avoid the formation of solid electrolyte interphase (SEI) layers and lithium plating on the electrode.20 Nevertheless, the poor ion and electronic conductivity of TiO2 make it a challenge to present superior rate capability, which is one of important properties related to LIBs.21–23 Thus, it is of particular importance to seek suitable methods for relieving damages derived from poor electronic and ion conductivity. Fabrication of various nanostructures is a well-acknowledged approach to improving the electronic conductivity and Li+ diffusivity in battery materials. Porous nanostructures can not only shorten the length of Li+ diffusion in the solid phase, but also enhance the electrolyte's immersion, so nanostructured porous TiO2 has become one of the most popular nanostructured anode materials. Hence, researchers have been devoted to synthesizing mesoporous TiO2 for LIBs.24–26 Meanwhile, researchers found that it could boost the electronic conductivity by combining TiO2 with highly conductive materials, such as carbon, CNT and graphene, and hence to improve the electrode performance of TiO2.27–29 However, TiO2 nanoparticles on the CNT or graphene surface would still suffer from decomposition and the furious volumetric expansion during the charge/discharge process. As a result, these anode materials would present a gradual weakening cycle performance. Another way to boost rate capability is the carbon coating on TiO2 nanostructures, which can effectively maintain structure stability.30
Herein, we reported a facile and simple method for synthesizing the anatase TiO2 coated with carbon (TiO2@C) by using oleic acid as the carbon source. Compared with general glucose as carbon source, oleic acid possesses carboxyl groups,30–32 which can be steadily attached to the surface of TiO2. After annealed at a high temperature in the Ar atmosphere, TiO2 was coated with thin carbon layer in its surface, which could effectively improve the electrochemical performance of the sample. In this work, to explore effect in electrochemical performance by different coating carbon content, we synthesized two samples by adding different amount of oleic acid. We found that the TiO2@C with high content of carbon presented superior property not only in cycling performance but also rate performance during the whole cycling process. The as-synthesized TiO2@C with high content of carbon still maintains a discharge capacity of 286.5 mA h g−1 at 100 mA g−1 after 200 cycles. Besides, the as-synthesized TiO2@C with high content of carbon also indicates an excellent rate capability of 240, 205, 148 mA h g−1, at 100, 200, 500 mA g−1, respectively. Compared with some previous literatures on TiO2,33–35 the as-synthesized TiO2@C samples in our work has some advantages: our samples show a higher discharge capacity than that of the TiO2@C samples synthesized by Guo group with a discharge capacity of 236 mA h g−1, although it indicated a superior rate capability than that of TiO2@C here; our samples show a longer cycle with a relatively stable capacity compared with the TiO2@C prepared by Yang et al.30
2. Experimental section
2.1 Materials
Tetrabutyl titanate (Ti(OC4H9)4, TBT, 98%) was purchased from Sinopharm Chemical Reagent Co., Ltd, China. Oleic acid (C18H34O2) was received from Tianjin Fengchuan Chemical Reagent technologies Co., Ltd, China. Ammonia solution (NH4OH, 25%) was obtained from Tianjin Damao Chemical reagent Factory, China. All the chemicals of analytical grade were used as-received without any further purification.
2.2 Synthesis of TiO2@C
In a typical synthetic process, 3 mL of TBT and 1 mL of oleic acid were first mixed uniformly. Then, 1 mL of ammonia solution was added into the mixture under stirring drop by drop. After that, the mixture was put into a quartz tube and annealed for 2 h at the temperature of 700 °C at a heating rate of 3 °C min−1 in argon atmosphere. Finally, the sample (TiO2@C-1) was obtained after cooling to room temperature. Likewise, TiO2@C-2 was obtained by changing the volume of oleic acid to 0.5 mL, while the amount of other reagents kept the same.
2.3 Characterization
Scanning electron microscopy (SEM), transmission electron microscope (TEM) and high-resolution TEM (HR-TEM) were performed to explore the morphology and structure of samples on a Hitachi S-4800 and a JEOL2010, respectively. To characterize the components of the as-synthesized samples, X-ray diffraction (XRD) characterization was performed by a Rigaku D max-2500. The carbon content of samples was calculated using Thermogravimetric analysis (TGA, Setaram 018124) at a heating rate of 10 °C min−1 from room temperature to 800 °C in air. The Brunauer–Emmett–Teller (BET) measurements were performed to evaluate the pore diameter distribution and specific surface area of two samples by Gemini VII2390 Automated Physisorption Analyzer.
2.4 Electrochemical measurements
The electrodes were prepared by mixing TiO2@C with acetylene carbon black and carboxyl methyl cellulose (CMC), in a weight ratio of 8
:
1
:
1, respectively. Deionized water and ethyl alcohol were used as the mixed solvents for the mixture to form an electrode slurry. Then the flurry was uniformly coated on the copper foil, dried at 80 °C for 24 h, and cut into pole piece. The obtained pole pieces were dried again at 80 °C for 12 h in vacuum oven. The as-made working electrode were integrated into two-electrode CR 2032 coin-type cells for electrochemical measurements. Li metal and porous polypropylene film worked as the counter and reference electrode and the separator, respectively, and the electrolyte consisted of 1 M LiPF6, ethylene carbonate and diethyl carbonate in a 1
:
1
:
1 by volume. An automatic battery tester system (Land®, China) was used to measure the obtained battery's properties. Galvanostatic charge–discharge was measured in the voltage range of 0–3 V, with a current density of 100 mA g−1, as well as specific capacity at various current densities.
3. Results and discussions
The X-ray diffraction (XRD) characterization was employed to confirm the structures and phase of the as-synthesized TiO2@C. As shown in Fig. 1a, all the diffraction peaks of the as-synthesized TiO2@C samples could be attributed to the anatase structure of TiO2 (PDF #21-1272). TGA was applied to calculate the carbon content of the TiO2@C.36,37 As shown in Fig. 1b, the carbon contents of the TiO2@C-1 and TiO2@C-2 were estimated to be 21% and 12.5 wt%, respectively.
 |
| Fig. 1 (a) XRD patterns of TiO2@C-1 and TiO2@C-2; (b) TGA curve of TiO2@C-1 and TiO2@C-2. | |
The SEM, TEM, HR-TEM were performed to explore the morphology and structure of the as-prepared TiO2@C-1 and TiO2@C-2 samples.38 As shown in Fig. 2a, b, e and f, both of TiO2@C-1 and TiO2@C-2 are composed of spheres analogue, and it could be seen that the diameter of TiO2@C-1 (1000 nm) is larger than that of TiO2@C-2 (500 nm), respectively. In TEM images (Fig. 2c, d, g and h), one can find that carbon layer can be seen to be coated in the surface of TiO2 nanospheres. In Fig. 2d and h, it can be clearly seen that there is a lattice distance of 0.33 nm between layers corresponding to the (101) plane of TiO2.
 |
| Fig. 2 (a and b) SEM images, (c) TEM image and (d) HR-TEM image of TiO2@C-1; (e and f) SEM images, (g) TEM image and (h) HR-TEM image of TiO2@C-2. | |
To explore the pore diameter distribution and specific surface area of the TiO2@C-1 and TiO2@C-2, the BET analysis was characterized. As shown in Fig. 3b, an emblematic hysteresis loop is observed in the TiO2@C-2 sample, while the hysteresis loop is very narrow in the TiO2@C-1 (Fig. 3a), which indicates that the TiO2@C-2 sample owns relatively higher specific surface area. TiO2@C-1 and TiO2@C-2 reveal the specific surface areas of 2.7964 m2 g−1 and 30.4168 m2 g−1, respectively. As shown in the inset of Fig. 3a and b, TiO2@C-1 exhibits a larger pore diameter than TiO2@C-2.
 |
| Fig. 3 N2 adsorption–desorption isotherm of (a) TiO2@C-1 and (b) TiO2@C-2 (inset of each plot: pore size distribution). | |
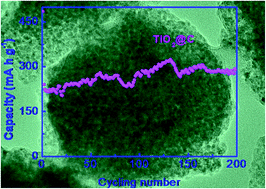
To study the electrochemical performance of the TiO2@C-1 and TiO2@C-2, constant current charge–discharge testing was examined. Fig. 4a and b show the charge–discharge voltage profiles of the TiO2@C-1 and TiO2@C-2 for 1st, 2nd, 3rd cycles in 0.01–3 V voltage range at 100 mA g−1, respectively. However, it is obvious that a great loss of initial capacity in the 1st cycle for both the TiO2@C-1 and TiO2@C-2. As shown in Fig. 4a and b, the TiO2@C-1 and TiO2@C-2 electrodes show the initial discharge/charge capacities of 485/226 and 168/77 mA h g−1, respectively, with a coulombic efficiency (the ratio of charge capacity to discharge capacity) of 46.6% and 45.8%, respectively. The sharp capacity decrease in the initial cycle is mainly attributed to the irreversible process of Li ions inserting into the TiO2 lattice34 and the formation of a SEI layer along with the irreversible consumption of electrode materials.14,39 Besides, the coulombic efficiencies in the second and third cycle are almost 100%, which indicates that the electrochemical process is quite stable during the later discharge/charge reactions. Fig. 4c shows the cycling performance and coulombic efficiency of the TiO2@C-1 and TiO2@C-2 electrodes. Obviously, the TiO2@C-1 electrode presents a higher specific capacity than the TiO2@C-2 electrode. The initial discharge capacities of the TiO2@C-1 and TiO2@C-2 electrodes at 100 mA g−1 are 485.6, 168.3 mA h g−1, dropping to 240.0, 98.5 mA h g−1 in the second cycle, respectively. After 200 cycles, the discharge capacities of TiO2@C-1 and TiO2@C-2 electrodes still remain at 286.5, 211.6 mA h g−1, respectively. The coulombic efficiency of the TiO2@C-1 and TiO2@C-2 electrodes are both around 100% during the whole cycle periods, showing stably reversible lithium diffusion kinetics. The discharge capacities drop from the first cycle to the second cycle, while then slowly increase and reach about 280, 200 mA h g−1 for TiO2@C-1 and TiO2@C-2, respectively. As shown in Fig. 4d, when the current density increases from 100 mA g−1 to 1000 mA g−1 and decreases back to 100 mA g−1, the TiO2@C-1 presents the higher average discharge capacities of 240, 205, 148, 95 and 275 mA h g−1, compared with the TiO2@C-2 electrodes of 120, 88, 41, 21 and 123 mA h g−1, at 100, 200, 500, 1000 and 100 mA g−1, respectively. Obviously, the TiO2@C-1 electrode indicates excellent rate performance, remaining a discharge capacity of 148 mA h g−1 even when the current density reaches 500 mA g−1. As can be seen in Fig. 4c and d, the TiO2@C-1 electrode presents a much higher specific capacity and rate performance than the TiO2@C-2 electrode. The better electrochemical performance of TiO2@C-1 are possibly attributed to the higher carbon content. A higher carbon content means that the surface of TiO2 crystal is coated by more carbon, which contributes to a more stable structure that can effectively restrain from dramatic volumetric change. Besides, more coating carbon can facilitate the electronic conductivity of the TiO2 electrode, which results in a higher electrochemical activity.
 |
| Fig. 4 Discharge–charge profiles of (a) TiO2@C-1 and (b) TiO2@C-2 at the 100 mA g−1; (c) cycling performance and coulombic efficiency of TiO2@C-1 and TiO2@C-2 at 100 mA g−1; (d) rate performance of TiO2@C-1 and TiO2@C-2 at 100 mA g−1, 200 mA g−1, 500 mA g−1, 1000 mA g−1 and 100 mA g−1, respectively. | |
4. Conclusions
In summary, we have successfully synthesized TiO2@C with different carbon content by a facile and simple method. The as-synthesized TiO2@C samples are composed of nanospheres analogue with different diameters. TiO2@C-1 (with more carbon content) reveals a much higher specific capacity and rate performance than TiO2@C-2 as the anode material for lithium ion batteries. The TiO2@C-1 electrode maintains a discharge capacities of 286.5 mA h g−1 at 100 mA g−1 after 200 cycles, and the discharge capacity can remain at 148 mA h g−1 even at 500 mA g−1. The as-synthesized TiO2@C nanospheres are promising anode materials for next-generation LIBs.
Acknowledgements
This work was supported by the National Natural Science Foundation of China (Grant No. 51302079 and 21401140).
Notes and references
- A. S. Arico, P. Bruce, B. Scrosati, J.-M. Tarascon and W. van Schalkwijk, Nat. Mater., 2005, 4, 366–377 CrossRef CAS PubMed.
- W. Tang, L. Liu, Y. Zhu, H. Sun, Y. Wu and K. Zhu, Energy Environ. Sci., 2012, 5, 6909–6913 CAS.
- L. Wang, C. L. Yang, S. Dou, S. Y. Wang, J. T. Zhang, X. Gao, J. M. Ma and Y. Yu, Electrochim. Acta, 2016, 219, 592–603 CrossRef CAS.
- Z. Lu, N. Liu, H.-W. Lee, J. Zhao, W. Li, Y. Li and Y. Cui, ACS Nano, 2015, 9, 2540–2547 CrossRef CAS PubMed.
- R. Mo, Z. Lei, K. Sun and D. Rooney, Adv. Mater., 2014, 26, 2084–2088 CrossRef CAS PubMed.
- H. Z. Li, L. Y. Yang, J. Liu, S. T. Li, L. B. Fang, Y. K. Lu, H. R. Yang, S. L. Liu and M. Lei, J. Power Sources, 2016, 324, 780–787 CrossRef CAS.
- J. Liu, P.-J. Lu, S. Q. Liang, J. Liu, W. J. Wang, M. Lei, S. S. Tang and Q. Yang, Nano Energy, 2015, 12, 709–724 CrossRef CAS.
- H. Jia, P. Gao, J. Yang, J. Wang, Y. Nuli and Z. Yang, Adv. Energy Mater., 2011, 1, 1036–1039 CrossRef CAS.
- S. Hossain, Y.-K. Kim, Y. Saleh and R. Loutfy, J. Power Sources, 2003, 114, 264–276 CrossRef CAS.
- X. Zhu, Y. Zhu, S. Murali, M. D. Stoller and R. S. Ruoff, ACS Nano, 2011, 5, 3333–3338 CrossRef CAS PubMed.
- W. Wei, L.-X. Song and L. Guo, Chin. Chem. Lett., 2015, 26, 124–128 CrossRef CAS.
- D. Wang, Y. Yu, H. He, J. Wang, W. Zhou and H. D. Abruña, ACS Nano, 2015, 9, 1775–1781 CrossRef CAS PubMed.
- H. Cao, X. Z. Wang, H. B. Gu, J. R. Liu, L. Q. Luan, W. Liu, Y. R. Wang and Z. H. Guo, RSC Adv., 2015, 5, 34566–34571 RSC.
- S. Qiu, G. X. Lu, J. R. Liu, H. L. Lv, C. X. Hu, B. Li, X. R. Yan, J. Guo and Z. H. Guo, RSC Adv., 2015, 5, 87286–87294 RSC.
- Y. Fu, H. B. Gu, X. R. Yan, J. R. Liu, Y. R. Wang, G. N. Huang, X. Y. Li, H. L. Lv, X. Z. Wang, J. Guo, G. X. Lu, S. Qiu and Z. H. Guo, Chem. Eng. J., 2015, 277, 186–193 CrossRef CAS.
- T. Froschl, U. Hormann, P. Kubiak, G. Kucerova, M. Pfanzelt, C. K. Weiss, R. J. Behm, N. Husing, U. Kaiser, K. Landfester and M. Wohlfahrt-Mehrens, Chem. Soc. Rev., 2012, 41, 5313–5360 RSC.
- C. Kim, R. Buonsanti, R. Yaylian, D. J. Milliron and J. Cabana, Adv. Energy Mater., 2013, 3, 1286–1291 CrossRef CAS.
- S.-T. Myung, M. Kikuchi, C. S. Yoon, H. Yashiro, S.-J. Kim, Y.-K. Sun and B. Scrosati, Energy Environ. Sci., 2013, 6, 2609–2614 CAS.
- Z. Chen, I. Belharouak, Y. K. Sun and K. Amine, Adv. Funct. Mater., 2013, 23, 959–969 CrossRef CAS.
- Z. Yang, D. Choi, S. Kerisit, K. M. Rosso, D. Wang, J. Zhang, G. Graff and J. Liu, J. Power Sources, 2009, 192, 588–598 CrossRef CAS.
- J.-Y. Shin, D. Samuelis and J. Maier, Adv. Funct. Mater., 2011, 21, 3464–3472 CrossRef CAS.
- L. Zeng, C. Zheng, L. Xia, Y. Wang and M. Wei, J. Mater. Chem. A, 2013, 1, 4293–4299 CAS.
- L. Liu, Q. Fan, C. Sun, X. Gu, H. Li, F. Gao, Y. Chen and L. Dong, J. Power Sources, 2013, 221, 141–148 CrossRef CAS.
- H. Liu, Z. Bi, X.-G. Sun, R. R. Unocic, M. P. Paranthaman, S. Dai and G. M. Brown, Adv. Mater., 2011, 23, 3450–3454 CrossRef CAS PubMed.
- K. Saravanan, K. Ananthanarayanan and P. Balaya, Energy Environ. Sci., 2010, 3, 939–948 CAS.
- Z. Wang, X. Li, H. Xu, Y. Yang, Y. Cui, H. Pan, Z. Wang, B. Chen and G. Qian, J. Mater. Chem. A, 2014, 2, 12571–12575 CAS.
- W. Wang, Q. Sa, J. Chen, Y. Wang, H. Jung and Y. Yin, ACS Appl. Mater. Interfaces, 2013, 5, 6478–6483 CAS.
- X. Xin, X. Zhou, J. Wu, X. Yao and Z. Liu, ACS Nano, 2012, 6, 11035–11043 CrossRef CAS PubMed.
- X. Su, Q. L. Wu, X. Zhan, J. Wu, S. Y. Wei and Z. H. Guo, J. Mater. Sci., 2012, 47, 2519–2534 CrossRef CAS.
- F. Yang, Y. Zhu, X. Li, C. Lai, W. Guo and J. Ma, RSC Adv., 2015, 5, 98717–98720 RSC.
- L. Wang, B. Ruan, J. Xu, H. K. Liu and J. Ma, RSC Adv., 2015, 5, 36104–36107 RSC.
- G. Zhou, J. Ma and L. Chen, Electrochim. Acta, 2014, 133, 93–99 CrossRef CAS.
- S. M. Guo, J. R. Liu, S. Qiu, Y. R. Wang, X. R. Yan, N. N. Wu, S. Y. Wang and Z. H. Guo, Electrochim. Acta, 2016, 190, 556–565 CrossRef CAS.
- H. L. Lv, J. R. Liu, S. Qiu, Y. H. Cao, C. X. Hu, S. M. Guo and Z. H. Guo, J. Mater. Chem. A, 2016, 4, 9881–9889 Search PubMed.
- S. M. Guo, J. R. Liu, S. Qiu, W. Liu, Y. R. Wang, N. N. Wu, J. Guo and Z. H. Guo, J. Mater. Chem. A, 2015, 3, 23895–23904 CAS.
- J. W. Gu, N. Li, L. D. Tian, Z. Y. Lv and Q. Y. Zhang, RSC Adv., 2015, 5, 36334–36339 RSC.
- J. W. Gu, C. B. Liang, J. Dang, W. C. Dong and Q. Y. Zhang, RSC Adv., 2016, 6, 35809–35814 RSC.
- J. W. Gu, X. T. Yang, C. M. Li and K. C. Kou, Ind. Eng. Chem. Res., 2016, 55, 10941–10946 CrossRef CAS.
- Z. H. Zhang, W. Y. Li, T. W. Ng, W. P. Kang, C. S. Lee and W. J. Zhang, J. Mater. Chem. A, 2015, 3, 20527–20534 CAS.
|
This journal is © The Royal Society of Chemistry 2016 |
Click here to see how this site uses Cookies. View our privacy policy here.