Thickness-dependent bandgap tunable molybdenum disulfide films for optoelectronics

Juntong Zhua, Jiang Wub, Yinghui Sun*a, Jianwen Huanga, Yufei Xiaa, Hao Wanga, Haibo Wanga, Yun Wanga, Qinghua Yia and Guifu Zou*a
aCollege of Physics, Optoelectronics and Energy, Institute of Chemical Power Sources & Collaborative Innovation Center of Suzhou Nano Science and Technology, Soochow University, Suzhou 215006, China. E-mail: yinghuisun@suda.edu.cn; zouguifu@suda.edu.cn
bDepartment of Electronic and Electrical Engineering, University College London, London WC1E 7JE, UK

Received 8th September 2016 , Accepted 2nd November 2016

First published on 3rd November 2016


Abstract

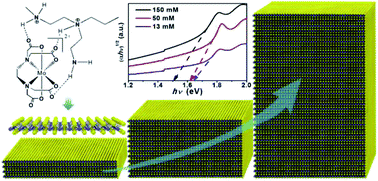
Thickness-dependent bandgap tunable MoS2 has significant potential applications in electronic and optoelectronic devices. Here, we report an aqueous solution approach to grow thickness-controlled MoS2 films. The thicknesses of the MoS2 films can be readily changed from 50 nm to 2.5 nm, corresponding to bandgaps modulated from 1.50 eV to 1.64 eV. Remarkably, MoS2 films with various thicknesses are expediently realized by simple adjustment of the precursor concentration. Microscopic and spectroscopic analyses illustrate that the as-grown MoS2 films are uniform and high quality. Photoresponse tests demonstrate that the as-grown MoS2 films have fast responses to light and good stability.

1. Introduction

Two dimensional MoS2 is attracting a wide range of research interest due to its potential applications in thin-layer transistors and high performance integrated circuits.1–4 Notably, MoS2 has a thickness-dependent bandgap that changes from 1.9 eV for single-layer MoS2 (direct bandgap) to 1.3 eV for bulk MoS2 (indirect band gap).5–9 Compared with single-layer MoS2, multilayer MoS2 film has been widely studied and has been demonstrated to have applications in fascinating electronic devices with higher drive current density; this is because multilayer MoS2 has a low band gap, manifold conduction channels, and triple the density of states at the conduction band minimum.9–12 Many studies have indeed demonstrated promising applications of MoS2 films in many fields, such as phototransistors,2 saturable absorbers,13 nonlinear optical limiters,14 lasers, and field effect transistors.15–17 To date, a few methods have been reported to prepare multilayer MoS2 films; these can be divided into two categories: film thicknesses less than 10 nm and over several tens of nanometers. For MoS2 films with thicknesses less than less than 15 layers (<10 nm), bottom-up growth methods such as chemical vapor deposition (CVD), pulsed laser deposition (PLD), sulfurization of MoO3 and laser thinning have been reported.12,18–24 On the other hand, top-down techniques, including thermolysis,25,26 mechanical exfoliation,10,11 and liquid phase and lithiation exfoliation,27–29 have been used to prepare much thicker MoS2 films (>several tens of nanometers). Precise control of the thickness growth of MoS2 films is extremely important for their properties and for their performance in electronic devices. Herein, we report for the first time an aqueous solution approach, polymer-assisted deposition (PAD), to grow thickness-controlled MoS2 films. The thickness of the MoS2 films is readily changed from 50 nm to 2.5 nm, corresponding to bandgaps modulated from 1.50 eV to 1.64 eV. Remarkably, MoS2 films of various thicknesses are expediently realized by simple adjustment of the precursor concentration. Moreover, all the precursor solutions are prepared in an environmentally friendly aqueous system. The polymer, with numerous pairs of nitrogen atoms, combines with metal ions in water to form metal–polymer complexes, while the uncombined anions and cations are removed to prevent unwanted reactions. Compared with previously reported bottom-up growth and top-down methods, this aqueous solution approach, PAD, enables control of the distribution of the metal ions at a molecular level and forms a homogenous and stable aqueous precursor solution. Varying the metal concentration of the precursor solutions enables the fabrication of high quality, thickness-dependent MoS2 thin films with tunable bandgap growth in an aqueous system; this facilitates the formation of homogenous thin films on a large scale with fewer material defects. Photoresponse tests demonstrate that the as-grown MoS2 films have fast responses to light and good stability. The facile growth of thickness-controlled MoS2 films in an aqueous system also provides an environmentally friendly solution platform to fabricate a variety of single/multiple metal chalcogenides for sustainable industrial use of thin films.

2. Experimental section

2.1 Preparation of MoS2 films

A three-step method was utilized to grow MoS2 films: (1) polyethyleneimine (PEI) and ethylenediaminetetraacetic acid (EDTA) were used to bind molybdenum ions to form the homogeneous polymeric precursor; (2) the Mo precursor solution was spin-coated onto a substrate, such as SiO2/Si, Si or quartz. To prepare the stable Mo precursor, 2 g of (NH4)6Mo7O24·4H2O was added to a solution containing 1 g of EDTA and 40 ml of deionized water (DI-water), followed by the dropwise addition of 2 g of PEI to the solution. After a few minutes of continuous stirring, the solution was filtered by Amicon ultrafiltration with a molecular weight of <10[thin space (1/6-em)]000 g mol−1 several times. Finally, the obtained precursor solution was diluted to obtain a concentration of Mo2+ ions of 200 mM. Moreover, precursor solutions with the desired concentrations (13 mM, 50 mM and 150 mM) were obtained through dilution by adding various amounts of DI water to the original precursor solution (200 mM). The substrates were first cleaned with a standard piranha solution (H2SO4/H2O2 ∼ 4/1).

The Mo precursors with various concentrations were spin-coated on cleaned substrates following annealing processes which were performed in a homemade furnace system. In more detail, the freshly prepared thin film was firstly placed at the center of a quartz tube, and pure sulfur (S8) in a ceramic boat was placed in the entrance of the quartz tube in an Ar/H2 atmosphere. When the center of the furnace reached 550 °C, the chamber was filled with a mixture of Ar/H2 and sulfur gas. After 30 min, the sample was heated to 850 °C and maintained for a second annealing time of 10 min. Finally, the sample was cooled to room temperature within 10 h.

2.2 Characterization

The concentration of Mo in the precursor solution was evaluated with an inductively coupled plasma atomic emission spectrometer (PerkinElmer Optima 8000). X-ray diffraction (XRD) patterns of the films were obtained with a Rigaku D/MAX-2000PC diffraction system. The cross-sectional microstructures of the films were analyzed by high resolution transmission electron microscopy (HRTEM, FEI Tecnai F20). Surface characterization of the MoS2 films was performed by X-ray photoelectron spectroscopy (XPS, ESCALAB 250Xi). The absorption spectra of the films were measured with an ultraviolet-visible (UV-Vis) spectrometer (Shimadzu UV-2450). The surface morphologies of the films were analyzed by atomic force microscopy (AFM, Asylum Research MFP-3D-BIO) and scanning electron microscopy (SEM, Hitachi SU8010). The MoS2 films were exfoliated in N-methyl-2-pyrrolidone (NMP) solvent at 0 °C with an ultrasonic cell crusher (Percival, TZL-630D).

2.3 Device characterization

Two-end devices were fabricated as follows: a 5 nm Cr electrode followed by a 100 nm Au electrode were deposited on the MoS2 film by a standard thermoevaporation method in vacuum. The photo-excitation behavior of the device was studied through 2-point probe measurements with a constant gate bias by shining simulated AM 1.2 illumination onto the device with a Keithley semiconductor parameter analyzer (model 4200-SCS).

3. Results and discussion

The microstructures of the grown MoS2 films are shown in Fig. 1. The SEM image (Fig. 1a) shows that the top morphology of the film is smooth and homogeneous. To evaluate the film growth, we scratched the film from the substrate. The obvious contrast between the black film and the white substrate suggests that the grown film is dense and of high quality. Moreover, the inset of the optical microscopy photograph and the large area photograph (Fig. S2) also illustrate the formation of MoS2 film by the strong color contrast between the sample and the substrate. Fig. 1b shows the cross-sectional microstructure of the film. There is a clear interface between the film and the substrate. Side observation indicates that the grown film is continuous, without any cracks, and is uniformly flat, with a thickness of around 90 nm. As illustrated in Fig. S1 and Table S1, the amounts of S and Mo elements on the bottom and the top sides of the MoS2 film were characterized by EDAX. For S, the amount on the bottom of the MoS2 film is about 2% less than the amount on the top, indicating the formation of homogenous MoS2 film during sulfurization. In order to further estimate the thickness and roughness of the film, AFM was used to analyze the topography of an area with a scratch, as shown in Fig. 1c. The thickness and root-mean-square (RMS) surface roughness of the MoS2 film are around 90 nm (cross-sectional height profile marked by a white line in Fig. 1c) and 10.7 nm (Fig. S3), respectively. Fig. 1d reveals the crystalline structure of the MoS2 film. The high resolution transmission electron microscopy (HRTEM) image clearly shows the periodic atom arrangement of MoS2. The interplanar lattice spacing is calculated to be 0.28 nm, corresponding to the (100) plane of MoS2, which is in good agreement with the bulk MoS2 value of 0.27 nm.23,30,31 The inset displays the selected area electron diffraction (SAED) pattern taken from the [001] crystalline axis direction. The two sets of rings can be indexed to the (100) and (110) planes, corresponding to the two sets of planes from the HRTEM images. The electron diffraction ring indicates the stacking of several pieces of MoS2 layers.23 Careful observation shows that the rings are composed of many bright dots. This suggests that the grown film has high crystallinity.
image file: c6ra22496b-f1.tif
Fig. 1 (a) and (b) SEM images and cross-sectional SEM micrograph of a MoS2 film on a SiO2/Si substrate with a precursor concentration of 200 mM. Inset: optical microscopy image of the MoS2 film. (c) AFM image of the MoS2 film. Inset: a line scan showing an average thickness of 90 nm. (d) Standard HRTEM image of the MoS2 film after liquid exfoliation in NMP solution at 0 °C. Inset: SAED pattern taken from the [001] crystalline axis direction.

XRD measurements were carried out to identify the phase structures of the samples annealed at different temperatures. Compared with the substrate XRD pattern, there is a faint peak observed at a value of 2θ around 14.2° (d = 0.623 nm), corresponding to the (002) plane, at the annealing temperature of 750 °C. The intensity of the peak is obviously increased when the annealing temperature is increased to 850 °C. In addition to the (002) peak, there are three additional peaks at values of 2θ around 28.3°, 43.54° and 59.24°. These peaks can be indexed to the (004), (006) and (110) planes for MoS2, indicating that the crystallinity of MoS2 annealed at 850 °C is good.32 The appearance of (00l) peaks, including (002), (004), and (006), is characteristic of materials with layered structures; this indicates some ordered stacking of MoS2 layers in the film.33 In addition, the crystallinity of the MoS2 films shows no distinct enhancement when the annealing temperature is increased to 900 °C. The films were further characterized using confocal Raman spectroscopy and XPS. As is well known, the E12g mode results from the in-plane vibrations of S and Mo atoms, and the A1g mode is the out-of-plane vibration of S atoms.34 As shown in Fig. 2b, the Raman spectrum of the as-grown MoS2 film (excitation = 534 nm) features two main bands at 381.6 and 406.5 cm−1 with modes related to E12g and A1g, respectively. From the Raman spectrum, we calculated the relative peak difference between the E12g mode and the A1g modes, δ, to be ∼25.0 cm−1, corresponding to the Raman signature of bulk MoS2; this clearly indicates that the layer numbers of MoS2 are greater than 25.34,35 Fig. 2c displays detailed XPS scans for the Mo and S binding energies of the samples. All measured XPS results are calibrated to the C 1s peak at 285 eV. The Mo 3d peaks are observed at 232.7 and 229.5 eV, assigned to the doublet Mo d3/2 and Mo d5/2 for Mo4+. In addition, the peaks at 163.6 and 162.3 eV correspond to the S 2p1/2 and S 2p3/2 orbitals of divalent sulfide ions (S2−), respectively.23,30 The stoichiometric ratio (S[thin space (1/6-em)]:[thin space (1/6-em)]Mo) can be estimated to be 2 based on the respective integrated peak areas of the XPS spectra. The above results and analyses have demonstrated that high-quality MoS2 film can be directly grown by the PAD method.


image file: c6ra22496b-f2.tif
Fig. 2 (a) XRD patterns of MoS2 thin films annealed at different temperatures. (b) and (c) Raman (excitation laser: 534 nm) and XPS spectra of MoS2 annealed at 850 °C.

It is well known that the MoS2 bandgap can be tuned by changing the film thickness.2 Precise control of the thickness of MoS2 film is extremely important to its properties and performance in electronic devices. Herein, we attempted to precisely adjust the concentration of the Mo precursor solution to control the thickness of MoS2 films. The following advantages of our precursor solutions allow film growth at the molecular level, similar to atomic layer deposition, to achieve modification of the film thickness. Firstly, all the precursor solutions are prepared in an environmentally friendly aqueous system. The polymer, with numerous pairs of nitrogen atoms, combines with the metal ions in water to form a metal–polymer complex, while the uncombined anions and cations are removed to prevent unwanted reactions. Secondly, this aqueous solution approach can precisely control the distribution of the metal ions at a molecular level and form a homogenous and stable aqueous precursor solution. Finally, the varied metal concentrations of the molecular precursor solutions ensure the growth of high quality MoS2 films with different thicknesses following molecular decomposition to Mo atoms in an aqueous system. Fig. 3 exhibits SEM and AFM images of MoS2 films grown with precursor concentrations of 150 mM, 50 mM and 13 mM. The films were annealed at 850 °C. The films shown in Fig. 3a–c are continuous and uniformly flat across the whole surface compared with the scratches on the SiO2/Si substrates. Fig. 3d–f show AFM topographies of the scratched areas and the cross-sectional height profiles of the MoS2 films. The AFM surface topography images show good uniformity over large areas. The thicknesses of the MoS2 films are evaluated to be 50 nm, 10 nm and 2.5 nm, corresponding to around 75, 15 and 4 layers of MoS2, respectively. Indeed, this relationship between the thickness and the precursor concentration is as expected based on our design. Moreover, it is interesting to observe that there is a linear relationship between the thickness and the precursor concentration, as shown in Fig. 4d. This provides a promising indication that the film thickness can be precisely controllable by adjustment of the precursor concentration. Additionally, the RMS surface roughnesses of the films are 1.0 nm, 0.8 nm and 0.6 nm, corresponding to precursor concentrations of 150 mM, 50 mM and 13 mM, as shown in Fig. S1. The results of the above characterization analyses indicate that the PAD synthesis method described here can provide highly uniform films whose thicknesses can be easily controlled by changing the concentration of Mo precursor during the spin-coating process.


image file: c6ra22496b-f3.tif
Fig. 3 SEM (a–c) and AFM images of MoS2 films with precursor concentrations of 150 mM, 50 mM and 13 mM, respectively. Insets: line scans showing the average thicknesses. Scale bars: 2 μm for (a), (b), (c) and (f); 1 μm for (d); 200 nm for (e).

image file: c6ra22496b-f4.tif
Fig. 4 (a) The calculated (αhν)1/2 versus hν plots of MoS2 films with different thicknesses on quartz substrate with precursor concentrations of 150 mM, 50 mM and 13 mM. Inset: UV-Vis absorbance spectra of the MoS2 films with different thicknesses. (b) Photoluminescence spectra normalized by Raman intensity for MoS2 films with different thicknesses, showing a dramatic increase of luminescence efficiency in the thin MoS2 film. (c) Raman spectra of the MoS2 films with different thicknesses. (d) The relationship of film thickness and precursor concentration.

To investigate the influence of the thickness of the films on the bandgap, the films were examined by UV-Vis, PL, and confocal Raman spectroscopies. We calculated the relationship between the optical absorption coefficient (α) and the photon energy () by Tauc's semi-empirical equation:36–38

(αhν) = A(Eg)m
where α is the absorption coefficient, Eg is the energy of the optical band gap and A is a constant. The value of m is 2 for an indirect band transition and m is 1/2 for a direct band transition; and for MoS2 as an indirect band transition, m = 2. As shown in Fig. 4a, the optical band gap energies are estimated to be 1.50 eV, 1.63 eV and 1.64 eV for the MoS2 films with thicknesses of 50 nm, 10 nm and 2.5 nm, respectively, by extrapolating the straight-line portion of the plot at α = 0. It is obvious that the bandgap of MoS2 depends on the film thickness. In the inset in Fig. 4a, the UV-Vis absorption spectra of MoS2 films exhibit A and B excitonic features. The spectra show two prominent absorbance centers at 635 nm (1.95 eV) and 688 nm (1.80 eV), which are similar to the reported values for multilayer MoS2.39,40 The absorbance peak position is almost constant, and the absorbance intensities of the typical peaks decrease when the thicknesses of the films decrease. The energy difference between the A1 and B1 exciton transitions was found to be 0.15 eV, which is in agreement with the theoretically calculated value for ideal MoS2 (0.148 eV).20,22 Fig. 4b shows the PL spectra of MoS2 films of different thicknesses. For the 50 nm MoS2 film, there is no obvious emission peak because its properties are analogous to bulk MoS2. When the thickness decreased from 50 nm to 10 nm and 2.5 nm, the MoS2 thin films showed two more emission peaks at ∼670 nm and 620 nm, which are correlated to the A1 and B1 excitons of MoS2, respectively.41,42 In general, the relative intensity of the PL band decreases with increasing thickness of MoS2 because the indirect electron transitions dominate the direct transitions.40,43 Thus, the PL responses of the MoS2 films are represented by the intensity decay. The transition wavelength was red-shifted in thicker samples (Fig. 4b).20 All of our thin films have similar Raman signals in terms of peak position and line shape (Fig. 4c). However, the A1g peak clearly blue-shifted from 405.0 cm−1 to 401.3 cm−1 and δ decreased from 24.3 to 20.6 cm−1 when the thickness decreased from 50 to 2.5 nm, which is in good agreement with previously reported values for synthesized MoS2. The blue-shift of the A1g peak with decreasing thickness of the MoS2 layers may result from interlayer van der Waals interactions in MoS2. The thickness of the film is controlled by the concentration of the precursor. The UV-Vis, PL and Raman results identically confirm the thickness controllability of MoS2 grown using the PAD method. As plotted in Fig. 4d, there is a nearly linear relationship between the thickness of the MoS2 films and the concentration of Mo precursor, indicating that the MoS2 thickness is highly controllable.

To further explore their photoresponse properties, as-grown MoS2 films with a thickness of 10 nm were fabricated into photoconductors and characterized under simulated AM 1.2 illumination at room temperature (see Experimental section). Fig. 5 displays an obvious photocurrent under illumination. The current-versus-voltage (IV) curve is depicted in Fig. 5a. It can be concluded that there is good ohmic contact on the basis of the linear behavior of the IV curve for both dark current and photocurrent, with increasing bias from −1.0 to 1.0 V. The corresponding resistances were calculated to be 3.29 and 1.40 MΩ, respectively. The photoresponse behavior in Fig. 5b demonstrates that the MoS2 film has good photoresponse; this was further measured by switching a light on/off every ∼30 s at a bias of 0.1 V. It can be clearly seen that the photocurrent rapidly reached the maximum value (70 μA) and quickly dropped to the initial state when the light was off. The ratio of conductivity under illumination to dark conductivity is close to 3, and the average response time was observed to be around 0.3 s; this response time is similar to that of most of the reported photodetectors/sensors with MoS2 films.2 After repeating several on–off cycles, there is marginal degradation, indicating the good stability and reproducibility of the MoS2 photoconductor; also, the results are comparable to an optoelectronic device based on a MoS2 thin-film network of liquid-exfoliated nanosheets synthesized by the Langmuir–Blodgett method.44


image file: c6ra22496b-f5.tif
Fig. 5 Photoresponsive sensitivity of the 10 nm MoS2 film as a representative system. (a) The IV characteristics of the device in the dark and under simulated AM 1.2 illumination. (b) Time dependence of the current of the MoS2 film at a bias of 0.1 V in the dark and under simulated AM 1.2 illumination.

4. Conclusions

In summary, we demonstrated an efficient chemical-solution approach to control the thickness growth of MoS2 films. Various thicknesses of MoS2 films were expediently realized by simple adjustment of the precursor concentration. The thickness of the MoS2 films readily changed from 50 nm to 2.5 nm; the corresponding bandgaps were modulated from 1.50 eV to 1.64 eV. A photodetector based on MoS2 films exhibits good stability and fast response to light, suggesting that the thick MoS2 films could be applied in optoelectronics. This new method for preparing MoS2 can be applied to other TMDs and is very promising to enhance the stability and decrease the cost of photovoltaic technologies and other electronic applications.

Acknowledgements

We gratefully acknowledge the support from “973 Program – the National Basic Research Program of China” Special Funds for the Chief Young Scientist (2015CB358600), the Excellent Young Scholar Fund from National Natural Science Foundation of China (21422103), Jiangsu Fund for Distinguished Young Scientist (BK20140010), the Priority Academic Program Development of Jiangsu Higher Education Institutions (PAPD), Jiangsu Scientist and Technological Innovation Team (2013), the Nature Science Foundation of Jiangsu Province (BK20151227 and BK20151228), the Natural Science Foundation in High Education of Jiangsu Province (16KJB430024), the Prospective Project of Industry-University-Research Institution of Jiangsu Province (BY2014059-13) and Specialized Research Fund for the Doctoral Program of Higher Education (SRFDP, 20133201120028).

References

  1. X. Cui, G.-H. Lee, Y. D. Kim, G. Arefe, P. Y. Huang, C.-H. Lee, D. A. Chenet, X. Zhang, L. Wang, F. Ye, F. Pizzocchero, B. S. Jessen, K. Watanabe, T. Taniguchi, D. A. Muller, T. Low, P. Kim and J. Hone, Nat. Nanotechnol., 2015, 10, 534–540 CrossRef CAS PubMed.
  2. H. S. Lee, S. W. Min, Y. G. Chang, M. K. Park, T. Nam, H. Kim, J. H. Kim, S. Ryu and S. Im, Nano Lett., 2012, 12, 3695–3700 CrossRef CAS PubMed.
  3. K. Kang, S. Xie, L. Huang, Y. Han, P. Y. Huang, K. F. Mak, C.-J. Kim, D. Muller and J. Park, Nature, 2015, 520, 656–660 CrossRef CAS PubMed.
  4. Q. H. Wang, K. Kalantar-Zadeh, A. Kis, J. N. Coleman and M. S. Strano, Nat. Nanotechnol., 2012, 7, 699–712 CrossRef CAS PubMed.
  5. B. Liu, W. Zhao, Z. Ding, I. Verzhbitskiy, L. Li, J. Lu, J. Chen, G. Eda and K. P. Loh, Adv. Mater., 2016, 28, 1604 Search PubMed.
  6. M. C. Lucking, J. Bang, H. Terrones, Y.-Y. Sun and S. Zhang, Chem. Mater., 2015, 27, 3326–3331 CrossRef CAS.
  7. K. F. Mak, C. Lee, J. Hone, J. Shan and T. F. Heinz, Phys. Rev. Lett., 2010, 105, 136805 CrossRef PubMed.
  8. M. R. Islam, N. Kang, U. Bhanu, H. P. Paudel, M. Erementchouk, L. Tetard, M. N. Leuenberger and S. I. Khondaker, Nanoscale, 2014, 6, 10033–10039 RSC.
  9. W. Bao, X. Cai, D. Kim, K. Sridhara and M. S. Fuhrer, Appl. Phys. Lett., 2013, 102, 042104 CrossRef.
  10. S. Kim, A. Konar, W.-S. Hwang, J. H. Lee, J. Lee, J. Yang, C. Jung, H. Kim, J.-B. Yoo, J.-Y. Choi, Y. W. Jin, S. Y. Lee, D. Jena, W. Choi and K. Kim, Nat. Commun., 2012, 3, 1011 CrossRef PubMed.
  11. X. Zhong, W. Zhou, Y. Peng, Y. Zhou, F. Zhou, Y. Yin and D. Tang, RSC Adv., 2015, 5, 45239–45248 RSC.
  12. Y.-C. Lin, W. Zhang, J.-K. Huang, K.-K. Liu, Y.-H. Lee, C.-T. Liang, C.-W. Chu and L.-J. Li, Nanoscale, 2012, 4, 6637–6641 RSC.
  13. R. Woodward, R. Howe, G. Hu, F. Torrisi, M. Zhang, T. Hasan and E. Kelleher, Photonics Res., 2015, 3, A30–A42 CrossRef.
  14. K. P. Loh, H. Zhang, W. Z. Chen and W. Ji, J. Phys. Chem. B, 2006, 110, 1235–1239 CrossRef CAS PubMed.
  15. O. Salehzadeh, M. Djavid, N. H. Tran, I. Shih and Z. Mi, Nano lett., 2015, 15, 5302–5306 CrossRef CAS PubMed.
  16. M.-W. Lin, L. Liu, Q. Lan, X. Tan, K. S. Dhindsa, P. Zeng, V. M. Naik, M. M.-C. Cheng and Z. Zhou, J. Phys. D: Appl. Phys., 2012, 45, 345102 CrossRef.
  17. H. Wang, L. Yu, Y.-H. Lee, Y. Shi, A. Hsu, M. L. Chin, L.-J. Li, M. Dubey, J. Kong and T. Palacios, Nano lett., 2012, 12, 4674–4680 CrossRef CAS PubMed.
  18. A. Jawaid, D. Nepal, K. Park, M. Jespersen, A. Qualley, P. Mirau, L. F. Drummy and R. A. Vaia, Chem. Mater., 2015, 28, 337–348 CrossRef.
  19. C. R. Serrao, A. M. Diamond, S.-L. Hsu, L. You, S. Gadgil, J. Clarkson, C. Carraro, R. Maboudian, C. Hu and S. Salahuddin, Appl. Phys. Lett., 2015, 106, 052101 CrossRef.
  20. Y. Lee, J. Lee, H. Bark, I.-K. Oh, G. H. Ryu, Z. Lee, H. Kim, J. H. Cho, J.-H. Ahn and C. Lee, Nanoscale, 2014, 6, 2821–2826 RSC.
  21. A. Castellanos-Gomez, M. Barkelid, A. M. Goossens, V. E. Calado, H. S. J. van der Zant and G. A. Steele, Nano Lett., 2012, 12, 3187–3192 CrossRef CAS PubMed.
  22. J. Jeon, S. K. Jang, S. M. Jeon, G. Yoo, Y. H. Jang, J.-H. Park and S. Lee, Nanoscale, 2015, 7, 1688–1695 RSC.
  23. K.-K. Liu, W. Zhang, Y.-H. Lee, Y.-C. Lin, M.-T. Chang, C.-Y. Su, C.-S. Chang, H. Li, Y. Shi, H. Zhang, C.-S. Lai and L.-J. Li, Nano Lett., 2012, 12, 1538–1544 CrossRef CAS PubMed.
  24. S. Wang, Y. Rong, Y. Fan, M. Pacios, H. Bhaskaran, K. He and J. H. Warner, Chem. Mater., 2014, 26, 6371–6379 CrossRef CAS.
  25. J. Pütz and M. A. Aegerter, J. Sol-Gel Sci. Technol., 2003, 26, 807–811 CrossRef.
  26. J. Pütz and M. A. Aegerter, J. Sol-Gel Sci. Technol., 2000, 19, 821–824 CrossRef.
  27. S. Ghosh, A. Winchester, B. Muchharla, M. Wasala, S. Feng, A. L. Elias, M. B. M. Krishna, T. Harada, C. Chin, K. Dani, S. Kar, M. Terrones and S. Talapatra, Sci. Rep., 2015, 5, 11272 CrossRef CAS PubMed.
  28. S. S. Chou, Y.-K. Huang, J. Kim, B. Kaehr, B. M. Foley, P. Lu, C. Dykstra, P. E. Hopkins, C. J. Brinker, J. Huang and V. P. Dravid, J. Am. Chem. Soc., 2015, 137, 1742–1745 CrossRef CAS PubMed.
  29. X. Zhang, S. Zhang, C. Chang, Y. Feng, Y. Li, N. Dong, K. Wang, L. Zhang, W. J. Blau and J. Wang, Nanoscale, 2015, 7, 2978–2986 RSC.
  30. J. Wang, L. Chen, W. Lu, M. Zeng, L. Tan, F. Ren, C. Jiang and L. Fu, RSC Adv., 2015, 5, 4364–4367 RSC.
  31. Y.-H. Lee, X.-Q. Zhang, W. Zhang, M.-T. Chang, C.-T. Lin, K.-D. Chang, Y.-C. Yu, J. T.-W. Wang, C.-S. Chang, L.-J. Li and T.-W. Lin, Adv. Mater., 2012, 24, 2320–2325 CrossRef CAS PubMed.
  32. K. Chang and W. Chen, ACS Nano, 2011, 5, 4720–4728 CrossRef CAS PubMed.
  33. D. Yang and R. F. Frindt, J. Mater. Res., 1996, 11, 1733–1738 CrossRef CAS.
  34. S.-L. Li, H. Miyazaki, H. Song, H. Kuramochi, S. Nakaharai and K. Tsukagoshi, ACS Nano, 2012, 6, 7381–7388 CrossRef PubMed.
  35. C. Lee, H. Yan, L. E. Brus, T. F. Heinz, J. Hone and S. Ryu, ACS Nano, 2010, 4, 2695–2700 CrossRef CAS PubMed.
  36. J. Tauc and F. Abeles, Optical properties of solids, North-Holland, Amsterdam, 1972, vol. 277, p. 372 Search PubMed.
  37. P. Zhai, Q. Yi, J. Jian, H. Wang, P. Song, C. Dong, X. Lu, Y. Sun, J. Zhao, X. Dai, Y. Lou, H. Yang and G. Zou, Chem. Commun., 2014, 50, 1854–1856 RSC.
  38. J. Tauc, Mater. Res. Bull., 1968, 3, 37–46 CrossRef CAS.
  39. B. Visic, R. Dominko, M. K. Gunde, N. Hauptman, S. D. Skapin and M. Remskar, Nanoscale Res. Lett., 2011, 6, 1–6 CrossRef PubMed.
  40. J. W. Park, H. S. So, S. Kim, S.-H. Choi, H. Lee, J. Lee, C. Lee and Y. Kim, J. Appl. Phys., 2014, 116, 183509 CrossRef.
  41. Y. Yu, C. Li, Y. Liu, L. Su, Y. Zhang and L. Cao, Sci. Rep., 2013, 3, 1866 Search PubMed.
  42. A. Splendiani, L. Sun, Y. Zhang, T. Li, J. Kim, C.-Y. Chim, G. Galli and F. Wang, Nano Lett., 2010, 10, 1271–1275 CrossRef CAS PubMed.
  43. G. Eda, H. Yamaguchi, D. Voiry, T. Fujita, M. Chen and M. Chhowalla, Nano Lett., 2011, 11, 5111–5116 CrossRef CAS PubMed.
  44. G. Cunningham, D. Hanlon, N. McEvoy, G. S. Duesberg and J. N. Coleman, Nanoscale, 2015, 7, 198–208 RSC.

Footnote

Electronic supplementary information (ESI) available. See DOI: 10.1039/c6ra22496b

This journal is © The Royal Society of Chemistry 2016
Click here to see how this site uses Cookies. View our privacy policy here.