DOI:
10.1039/C6RA22414H
(Paper)
RSC Adv., 2016,
6, 105222-105230
Preparation and adsorption capacity of porous MoS2 nanosheets†
Received
7th September 2016
, Accepted 26th October 2016
First published on 26th October 2016
Abstract
Layered porous MoS2 with high adsorption capacity was synthesized directly using molybdenum trioxide and potassium rhodanate as Mo and S sources in a facile hydrothermal method without any surfactant and sacrificial template. The influences of varying the hydrothermal temperature on the morphology and adsorptive properties of MoS2 are discussed. As-prepared MoS2 samples were characterized by X-ray diffraction (XRD), X-ray photoelectron spectroscopy (XPS), field-emission scanning electron microscopy (SEM), transmission electron microscopy (TEM), ultraviolet-visible spectrophotometry (UV-Vis), room-temperature photoluminescence spectroscopy (RT-PL), thermogravimetric analysis (TGA) and Brunauer–Emmet–Teller (BET) measurements. MoS2 samples exhibited an optimal nanostructure, specific surface area and thermal stability when the hydrothermal temperature was 190 °C, and the layered porous structure is comprised of many thin nanosheets. In addition, the final adsorption capacities of the layered MoS2 toward RhB, MB and MO were studied. The sample exhibited ultrafast adsorption for dye removal and could reach 163.0 mg g−1, 499.0 mg g−1 and 125.1 mg g−1 at 420 min, respectively. The adsorption mechanism was also studied. The results indicate that layered MoS2 structures possess a significant adsorption ability, which may be useful for further research and practical applications of the layered MoS2 adsorbent in wastewater treatment.
1. Introduction
Molybdenum disulfide (MoS2) is widely used as a solid-state lubricant and catalyst for hydrodesulfurization and hydrogen evolution.1 However, due to its unique chemical, mechanical, and electronic properties, molybdenum disulfide (MoS2) nanomaterials, with the two-dimensional (2-D) layered structure of a typical transition-metal dichalcogenide (MX2), has attracted immense attention in energy storage, catalysis, adsorption and solar cells.2–9 To date, a variety of MoS2 nanomaterials have been obtained; for example, zero-dimensional MoS2 quantum dots (QDs) with unique optical and electronic properties are potentially applicable in fluorescence sensing,10 catalysis,11 bioimaging,12,13 and so on. Monolayer MoS2 nanosheets obtained from various exfoliation methods presented a strong photoluminescence quantum yield. Further, these nanosheets exhibit a direct bandgap of 1.2 eV, which differs from the indirect bandgap of bulk form. This bandgap alteration has attracted interest in these materials as potential photovoltaic and photocatalytic materials.14–16 Recently, layered MoS2 nanosheets have also attracted great interest for their potential applications in environmental pollution purification. This application exploits their sheet-like intrinsically layered structures for the improvement of pollutant adsorption. It is known that the adsorption process provides a simple and universal approach to effectively remove aqueous dyes.17–19 Ye et al.4 found that the largest adsorption capacity of layered MoS2 nanosheets for removal of methyl orange (MO) was 90 mg g−1. Song et al.20 found that the Fe3O4/MoS2 nanocomposites might have a maximum adsorption capacity of about 22 mg g−1 for rhodamine B (RhB) in aqueous solutions. Qiao et al.5 used uniform hierarchical MoS2 microspheres obtained with the aid of nonionic surfactant polyethylene glycol (PEG) to efficiently remove rhodamine B (RhB) and methylthionine chloride (MB) from aqueous solutions; the methylthionine chloride (MB) solution was changed from blue to colorless in 15 s, much faster than that of Fe3O4, carbon microspheres and α-MoO3. As a comparison, herein we describe the synthesis and adsorptive properties of layered MoS2 nanosheets fabricated directly using molybdenum trioxide and potassium rhodanate as Mo and S sources via a low temperature hydrothermal method. The layered MoS2 obtained presents ultrafast adsorption for dye removal and could reach 163.0 mg g−1, 499.0 mg g−1 and 125.1 mg g−1 at 420 min for RhB, MB and MO, respectively. The results indicate that layered MoS2 structures possess significant adsorption ability, which may be useful for further research and practical applications of the layered MoS2 adsorbent in wastewater treatment.
2. Experimental
2.1 Preparation of layered MoS2 nanosheets
All purchased chemical reagents were analytical grade and used without further purification. The specific operation steps are as follows: 3.00 mmol of MoO3 and 8.25 mmol of KSCN were dispersed in 20 mL of distilled water, respectively. Then an aqueous solution of KSCN was added dropwise to MoO3 suspensions with continuous magnetic stirring. After 10 min, the above solution was transferred into an autoclave reactor and the reactor was placed in an oven for hydrothermal treatment for 24 h. After allowing the reactor to cool to room temperature naturally, the obtained products were centrifuged and washed successively with distilled water and ethanol several times. The black precipitates were dried in a vacuum oven at 70 °C for 5 h and labeled as MS-1, MS-2, MS-3 and MS-4 corresponding to hydrothermal temperatures of 170, 180, 190 and 200 °C, respectively.
According to the chemical reaction, it is believed that MoS2 is formed by an oxidation–reduction process with the sulfurization reagent KSCN serving as a reductant. The reaction process can be expressed as follows:21
| 4MoO3 + 9SCN− + 14H2O → 4MoS2 + SO42− + NH4+ + 4CO32− + 8NH3↑ + 5CO2↑ |
2.2 Adsorption studies
\The adsorption behavior of MoS2 samples was evaluated by monitoring the degradation of RhB, MB and MO in aqueous solution. Briefly, a MoS2 sample was dispersed into 100 mL of an aqueous dye solution using an ultrasonic bath. Under constant stirring in the dark, 5 mL aliquots of the mixture were taken out at set time intervals. After centrifugation, the UV-Vis spectrum of the supernatant was recorded to calculate the concentration. The removal percent of dyes and adsorption capacity of MoS2 were calculated by using the following equations:
| Adsorption (%) = (A0 − At)/A0 × 100% |
| Adsorption capacity (mg g−1) = (adsorption% × Cd × Vd)/mA |
where A0 is the initial absorbance of dye; At is the dye absorbance at t minutes; Cd is the initial concentration of dye; Vd is the volume of dye solution; mA is the weight of MoS2.
2.3 Characterization
X-ray diffraction (XRD) patterns were obtained on an X-ray diffractometer (D/Max2500pc) using Cu Kα radiation at a scan rate of 0.02° 2θ s−1. The accelerating voltage and the applied current were 40 kV and 150 mA, respectively. Chemical compositions on the surface and valence states of the samples were investigated by X-ray photoelectron spectroscopy (XPS) measurements (K-Aepna). The morphology of samples was studied by field-emission scanning electron microscopy (FESEM) and transmission electron microscopy (TEM). The thermal stability and product purity were studied by thermogravimetric analysis (TGA) and infrared spectroscopy (FT-IR). The specific BET surface area (SBET) was calculated by following the nitrogen adsorption–desorption and Brunauer–Emmet–Teller method using an automated surface area and pore size analyzer (TRISTARII3020). The adsorption capacity of each sample was analyzed by the absorbance of dye aqueous solution acquired by a UV-vis spectrophotometer (TU-1980). Room-temperature photoluminescence (RT-PL) measurements were performed on ethanol suspensions of samples with a pulsed Xe laser (RF-5301 PC) as the excitation wavelength of 520 nm.
3. Results and discussion
3.1 XRD analysis
The crystallization, structure and phase purity of the prepared samples were confirmed by XRD. Fig. 1 is the XRD pattern of samples MS-1, MS-2, MS-3 and MS-4. All diffraction peaks can be assigned to the hexagonal MoS2 phase (JCPDS card no. 75-1539) with cell constants of a = 3.14 Å and c = 12.53 Å. Diffraction peaks attributed to MoO3 as shown in ESI (Fig. S1†) were not observed in the recorded pattern, indicating that the prepared products have high purity. The position of the XRD diffraction (002) peak arising from interlayer Mo–Mo scattering of MS-1, MS-2 and MS-3 samples was slightly shifted to lower angles with the hydrothermal temperature, indicating a substantial increase of interlayer distance of the crystal, which might be attributed to the lattice expansion by crystal defects or strains owing to the curvature of the layers.22–24 However, compared with the previous three samples, we find that the diffraction peak of MS-4 sample at the original (002) position is very weak, and a stronger diffraction peak is appeared at 13.88° after the hydrothermal treatment at 200 °C, which may be caused by the bending of MoS2 sheets, strain effects and defects involving folding of the layers due to the faster reaction rate at the higher temperature.25,26 Moreover, with increasing the hydrothermal temperature from 170 to 190 °C, the intensities of the diffraction peaks become more and more sharper, indicating that the crystalline quality improves and signifies a well-stacked layered structure.27 The continually growing diffraction peak at ca. 18°, shows that the higher hydrothermal temperature is favorable for the orientation of the (004) crystal facet, similar to the report by Liu et al.28
 |
| | Fig. 1 XRD pattern for as-prepared MoS2 samples. | |
3.2 Thermogravimetric analysis (TGA)
TGA was carried out to check the thermal stability of MoS2 samples from 150 to 600 °C under a nitrogen atmosphere as shown in Fig. 2. When the sample was heated from 150 to 200 °C, the weight decreased slowly, but without any obvious changes in DTG curves, which may be due to the loss of water. The thermal decomposition of MoS2 in the range of 200–450 °C was observed with weight loss in samples MS-1, MS-2, MS-3 and MS-4 corresponding to 10.11%, 7.67%, 3.60% and 7.54%, respectively. Moreover, as shown in DTG curves, it is obvious that the peak temperature of sample MS-3 is higher than those of samples MS-1, MS-2 and MS-4. This means sample MS-3 exhibits better thermal stability, which is related to the better orientation of the highly crystalline sample, in accordance with XRD results.29
 |
| | Fig. 2 TGA and DTG curves of MoS2 samples formed at different hydrothermal temperatures. | |
3.3 Optical properties
The optical properties of MoS2 samples composed of varying layers were investigated using UV-Vis spectroscopy (Fig. 3a) and photoluminescence (PL) spectroscopy (Fig. 3b). The UV-Vis absorption spectra of MoS2 samples reveal an absorption peak at ∼360 nm and a broad absorption from 450 nm to 800 nm, which shows the MoS2 samples possess a wider absorption range. The PL spectra show a broad photoluminescence from 650 to 800 nm as shown in Fig. 3b. The weak emission peaks at ∼595 and 630 nm correspond to the A1 and B1 direct excitonic transitions, respectively.30 Moreover, the PL intensity gradually increased when the hydrothermal temperature increased from 170 to 190 °C, indicating the transformation of products from bulk form to a layered-sheet morphology. However, the PL intensity decreased as the hydrothermal temperature further increased to 200 °C, which suggests the number of MoS2 layers increased. That is, the electronic structure of MoS2 is known to transform from an indirect to direct bandgap when the dimensions of MoS2 are reduced from bulk form to a layered sheet.31,32 The layered MS-3 sample with the strongest photoluminescence would help to increase the specific surface area and improve the adsorption performance.
 |
| | Fig. 3 The UV-Vis absorption spectrum (a) and photoluminescence spectrum (b) of MoS2 samples. | |
3.4 BET measurements
The specific surface area and porosity of hierarchical MoS2 samples were investigated by N2-adsorption. As shown in Fig. 4, the N2 adsorption–desorption isotherm can be categorized as a type IV isotherm with H3 hysteresis loop, indicating a mesoporous structure. The pores presumably arise from the spaces between the intercrossed MoS2 nanosheets. The nitrogen adsorption–desorption curves of MS-1, MS-2 and MS-4 are shown in Fig. S2† and the calculated surface area and average pore diameter of samples MS-1, MS-2, MS-3 and MS-4 are presented in Table 1. The results indicate that sample MS-3 has the largest surface area of 76.85 m2 g−1, which is much higher than the reported MoS2 (23.9 m2 g−1).33 The presence of mesoporosity in the ultrathin nanosheets yields a large specific surface area. The relatively large surface area can provide more active sites for adsorption of dye molecules, which would be beneficial for the fast adsorption and transfer of adsorbate inside the hierarchically porous structure of the sample.34
 |
| | Fig. 4 Nitrogen adsorption–desorption curve of MS-3 sample; pore size distribution curve (inset). | |
Table 1 SBET and average pore size of MoS2 prepared at different reaction temperature
| Sample |
MS-1 |
MS-2 |
MS-3 |
MS-4 |
| SBET (m2 g−1) |
29.10 |
46.31 |
76.85 |
7.13 |
| Average pore diameter (Å) |
106.51 |
96.15 |
103.51 |
141.50 |
3.5 Morphology analysis
Field-emission scanning electron microscopy (FESEM) was used to observe the morphologies of the MS-3 sample. The low magnification SEM image (Fig. 5a) reveals that the product is composed of irregular and uneven nanostructures, which looks like “broken cotton”. The high-magnification SEM image shown in Fig. 5b indicates that the mesoporous MoS2 consists of many randomly aligned nanosheets with an average thickness about 9 nm. The nanosheets are also observed to form a layered structure, which is consistent with XRD analysis. In addition, energy-dispersive X-ray spectrometry (EDS) results (Fig. S3†) reveal that the sample consists primarily of Mo and S, with no other element being observed. Furthermore, the quantification of the peaks shows that the atomic ratio between Mo and S is about 1![[thin space (1/6-em)]](https://www.rsc.org/images/entities/char_2009.gif) :1.95, which is very close to the stoichiometry of MoS2.
:1.95, which is very close to the stoichiometry of MoS2.
 |
| | Fig. 5 Low-magnification (a) and high-magnification (b) SEM image of the sample MS-3. | |
Transmission electron microscopy (TEM) was employed to further investigate the microstructure of the MS-3 sample. Fig. 6a presents a typical low-resolution TEM image of the MoS2. The image reveals that samples are composed of many randomly aligned nanosheets, and the sheets are slightly curved with an uneven surface morphology. The high-resolution TEM image (Fig. 6b) shows an interlayer separation between the MoS2 layers of about 0.62 nm, which is consistent with the (002) lattice plane of MoS2. Moreover, we can find that the as-prepared MoS2 sample has a porous structure. The randomly aligned nanosheets and porous structure should increase the specific surface area of MoS2 and thus improve its adsorption capacity.
 |
| | Fig. 6 TEM images of sample MS-3: (a) low-resolution TEM image, (b) high-resolution TEM image. | |
3.6 X-ray photoelectron spectroscopy measurements
The elemental compositions and chemical speciation of sample MS-3 are further analyzed by XPS measurements. The XPS survey spectrum in Fig. 7a illustrates the sample is composed of two major elements of Mo and S, with a trace amount of C and O. The peaks of O and C may come from H2O, O2 and CO2 adsorbed on the surface of the sample due to exposure to the air and adventitious hydrocarbon from the XPS instrument itself.35,36 Fig. 7b shows the Mo 3d spectrum and the binding energies at 228.9 eV and 232.2 eV belong to Mo 3d5/2 and 3d3/2 spin orbit peaks of MoS2, confirming the existence of the Mo IV oxidation state, while the peaks at 163.1 eV and 161.8 eV in the high-resolution spectrum of S (Fig. 7c) are attributed to S 2p1/2 and S 2p3/2, which is similar to the report by Tang et al.37 Meanwhile, the peaks centered at 233.2 and 236.4 eV are attributed to Mo6+, which might be originated from slight oxidation of MoS2. This was also observed in the S 2s region of the spectra. Thus, due to insignificant quantities of other phase, we did not find any MoO3 in the XRD and HRTEM images. The above results confirmed the formation of MoS2.
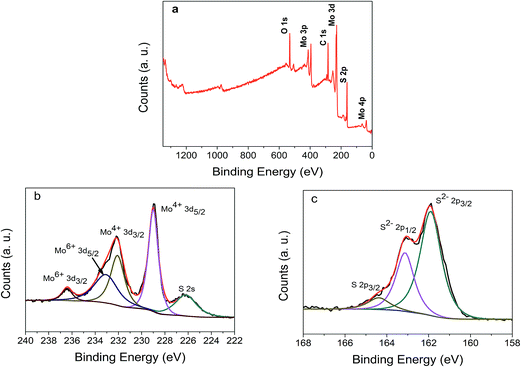 |
| | Fig. 7 (a) XPS full spectrum of sample MS-3. High resolution spectra of the elements Mo (b) and S (c). | |
3.7 Adsorption performance
To evaluate the adsorption capacity of as-prepared MoS2, 0.1000 g of the MS-3 sample was added to an RhB aqueous solution of different concentrations (20 mg L−1, 100 mg L−1 and 200 mg L−1). The adsorption experiments were performed under dark conditions for 120 min. Fig. 8a provides the absorption spectrum of the RhB aqueous solution (200 mg L−1) and Fig. 8b shows the adsorption capacity of MoS2 for RhB at varying adsorption times and RhB concentrations. The MoS2 samples are shown to effectively remove RhB from water; the complete removal of RhB occurred after 5 min, as observed by the RhB solution fading rapidly to colorless. The % RhB removed and the adsorption capacity of MoS2 samples were to 97.96% and 19.6 mg g−1, respectively, for a [RhB] of 20 mg L−1. In comparison, the respective values were 98.65% and 98.6 mg g−1 for a [RhB] of 100 mg L−1. However, the adsorption capacity was shown to increase to 112.4 mg g−1 when the [RhB] was increased to 200 mg L−1. Furthermore, its adsorption capacity did not plateau, but displayed a trend of sustained growth, which implies the as-prepared MS-3 sample would possess higher adsorption capacity for RhB with the allotment of additional time. The FT-IR spectrum of the MS-3 sample before and after adsorption is shown Fig. S4.† The differences in the spectra, especially in the range 1500 to 500 cm−1 indicate that the dye molecules have been successfully adsorbed by MoS2.
 |
| | Fig. 8 Adsorption performance pattern of MS-3 sample: (a) adsorption curves of MoS2 synthesized for RhB with the concentration of 200 mg L−1; (b) adsorption capacity of MoS2 synthesized for RhB with different concentrations. | |
In order to determine the saturated adsorption capacity of MS-3 for RhB, the adsorption experiments were carried out from 0 to 420 min by using 200 mg L−1 RhB as the pollutant. Meanwhile, we also studied the adsorption performance of the MS-3 sample for MB and MO solutions under the above conditions. The % removal of the dyes and the adsorption capacity of MoS2 with varying adsorption times is shown in Fig. 9a and b, respectively. The adsorption profile for the MS-3 sample at 200 mg L−1 of dye solution at 5 min and 420 min are shown in Table 2. For all dyes, the % removal of the dyes increased quickly in the first 5 min with the following respective % adsorption (adsorption capacity) values for MB, RhB, and MO: 55.83% (111.7 mg g−1), 42.16% (84.3 mg g−1) and 21.34% (42.7 mg g−1). In comparison, when the adsorption time was increased to 420 min, the respective adsorption capacities were 99.99% (199.9 mg g−1), 81.84% (163.0 mg g−1), and 62.55% (125.1 mg g−1). The above experimental results adequately indicate that the adsorption capacity of layered porous MoS2 is quite high and much greater than that reported for other adsorbent materials such as Bi2O3-bentonite, magnetic bentonite and Ag@AgBr/SBA-15.38–40 The adsorption capacity of MoS2 for different dyes is different, with the general trend: MB > RhB > MO, which may be connected with the molecular structure of dye and more negative adsorption energy (ΔHads).20 This suggests that the adsorption of MoS2 for different dyes possesses a certain extent of selectivity, which could be exploited for water remediation applications. The saturated adsorption capacity of MS-3 for RhB and MO was 163.0 mg g−1 and 125.1 mg g−1 at 420 min under our experimental conditions, respectively. The saturated adsorption capacity of MoS2 for MB is currently under investigation.
 |
| | Fig. 9 Adsorption performance pattern of MS-3 sample: (a) adsorption curves of MoS2 synthesized for different dyes; (b) adsorption capacity of MoS2 synthesized for different dyes. | |
Table 2 The adsorption date of MS-3 sample for 200 mg L−1 of dye solutions at 5 min and 420 min
| Removal rate (%)/adsorption capacity (mg g−1) |
MB |
RhB |
MO |
| 5 min |
55.83/111.7 |
42.16/84.3 |
21.34/42.7 |
| 420 min |
99.99/199.9 |
81.84/163.0 |
62.55/125.1 |
To confirm the maximum adsorption capacity of MoS2 for MB, the adsorption experiment was performed by varying the MoS2 dosage from 20 mg to 100 mg. Fig. 10a displays the UV-Vis spectra of MB (200 mg L−1), which shows that the absorbance at 664 nm gradually decreased over time upon exposure to MS-3. Fig. 10b and c show the % adsorption and adsorption capacity of the porous MS-3 sample for MB at varying adsorption times. As the MoS2 dosage increased from 20 to 100 mg, the % removal was shown to increase from 31.28% to 99.99%. However, the adsorption capacity of the MS-3 sample ranged from 200.0 to 499.0 mg g−1 for dosages in the range of 20–100 mg (Fig. 10d). The largest adsorption capacity for MB of 499.0 mg g−1 is much higher than that previously reported for other adsorbent materials.41
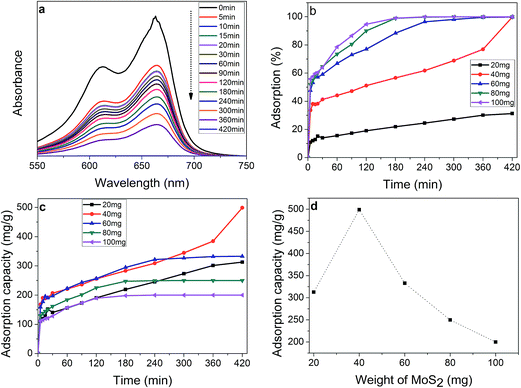 |
| | Fig. 10 Adsorption performance pattern of the MS-3 sample: (a) adsorption curves of 40 mg MoS2 for 200 mg L−1 methylene blue aqueous solution; (b) and (c) adsorption performance of different masses of MoS2 for methylene blue aqueous solution; (d) adsorption capacity of different masses of the MS-3 sample for methylene blue aqueous solution at 420 min. | |
3.8 Adsorption mechanism
The adsorption mechanism has a certain guiding role in the adsorption behavior and can depict the rate of adsorption and control the residual time for the whole adsorption process.36 For solid–liquid systems, kinetic studies and adsorption isotherms are the important physicochemical aspects in the description of adsorption behavior.42 According to the optimal adsorption conditions derived from the above results, we used MB as a representative dye, fixed the MoS2 quantity at 0.04 g and changed the concentration of the dye solution from 600 to 1200 mg L−1 (600, 800, 1000 and 1200 mg L−1). The changes in concentration of MB dye were determined on the basis of absorbance at 664 nm wavelength using a UV-vis spectrophotometer and the corresponding adsorption capacity curves are shown in Fig. 11a. The adsorption of MB on MoS2 nanosheets was found to be very fast in the first 10 min under all concentrations prior to reaching its equilibrium. The adsorption nearly finished within 60 min, indicating the relatively fast adsorption rate of MB on the MoS2 in water.
 |
| | Fig. 11 Time profiles (a) and pseudo-second-order adsorption kinetic plots (b) of MB onto sample MS-3 at different initial dye concentrations. | |
The adsorption kinetics of MB onto MoS2 was investigated with the help of two kinetic models, namely the Lagergren pseudo-first-order and pseudo-second-order model. The pseudo-first-order and pseudo-second-order kinetic model are expressed by the following equation:
| ln(Qe − Qt) = lnQe − k1t |
where
k1 and
k2 are the rate constant of pseudo-first-order adsorption (1/min) and pseudo-second-order adsorption (g mg
−1 min
−1), respectively.
Qt and
Qe are the amount adsorbed at time
t and at equilibrium (mg g
−1).
Fig. 11b represents a pseudo-second-order model and the adsorption kinetic parameters are reported in Table 3. The results reveal that all the experimental data can fit well to the pseudo-second-order model. All correlation coefficient (R2) values are greater than 0.99 at different initial concentrations, showing a good linear relationship between t/Qt and t. The calculated Qe values from the pseudo-second-order adsorption model were found to be closer to that of experimental Qe. It can be summarized from the above results that the pseudo-second-order kinetic model is highly applicable to the adsorption process of MB onto MoS2.
Table 3 Pseudo-first-order and pseudo-second-order adsorption kinetic constants for MB adsorption on sample MS-3
| C0 (mg L−1) |
Qe(exp) (mg g−1) |
Pseudo-first-order |
Pseudo-second-order |
| k1 (1/min) |
Qe(cal) (mg g−1) |
R2 |
k2 (g mg−1 min−1) |
Qe(cal) (mg g−1) |
R2 |
| 600 |
355.97 |
1.2 × 10⁻² |
36.51 |
0.4948 |
2.21 × 10⁻³ |
370.37 |
0.9998 |
| 800 |
341.50 |
7.6 × 10⁻² |
206.87 |
0.6232 |
8.90 × 10⁻⁴ |
357.14 |
0.9994 |
| 1000 |
189.96 |
2.9 × 10⁻² |
35.35 |
0.5538 |
4.71 × 10⁻² |
189.75 |
0.9982 |
| 1200 |
166.33 |
2.6 × 10⁻² |
54.07 |
0.4952 |
8.62 × 10⁻⁴ |
170.00 |
0.9987 |
The adsorption isotherm is important in designing the adsorption system.43 In this work, Langmuir and Freundlich models were chosen to determine the adsorption equilibrium and further to explain the adsorption mechanism of MB onto MoS2 nanosheets. The linear forms of Langmuir and Freundlich isotherms are described as:
The plots of Langmuir and Freundlich linear equations are displayed in Fig. 12. Two models could express the adsorption process due to the linear correlation coefficients R2 are all greater than 0.9. But the Langmuir isotherm (R2 = 0.96288) fit the experimental data better than Freundlich isotherm (R2 = 0.90715) under the studied concentration range by comparing the regression coefficients. This suggests that the adsorption process of the MB dye onto the MS-3 sample is more suitable to describe by the Langmuir isotherm model. However, in the Langmuir isotherm, the calculated maximum adsorption capacity (Qm = 119.1 mg g−1) is noted to be significantly lower than that of the experimental value (499.0 mg g−1). The above results suggest that the MoS2 surface exhibits a blend of homogeneous and heterogeneous adsorption sites, and the adsorption process of MB on MoS2 was controlled by the synergistic reaction between the two isotherm models.
 |
| | Fig. 12 Langmuir (a) and Freundlich (b) isotherm curve fitting for MB adsorption onto sample MS-3. | |
4. Conclusions
Layered porous MoS2 has been synthesized by a facile hydrothermal method using MoO3 and KSCN as the source materials. The hydrothermal temperature plays an important influence on the final morphology and properties of the MoS2 nanosheets. The structure and morphology of the obtained MoS2 samples have been confirmed by XRD, XPS, TGA, SEM, TEM and HRTEM. The optical properties of the MoS2 were characterized by UV-Vis absorption and photoluminescent spectra. The specific surface area of all samples was also determined from BET measurements. The results show MoS2 nanosheets exhibited the best adsorption capacity when the preparation temperature was 190 °C, and the adsorption process was more suitable to be described by the pseudo-second-order kinetic model and Langmuir model. The practical applications of MoS2 materials in sewage treatment are anticipated.
Acknowledgements
This work was funded by 321 talent project of Nanjing (Grant No. 631783) and National Natural Science Foundation of China (Grant No. 51371126).
Notes and references
- Y. M. Shi, W. Zhou, A. Y. Lu, W. J. Fang, Y. H. Lee, A. L. Hsu, S. M. Kim and K. K. Kim, Nano Lett., 2012, 12, 2784–2791 CrossRef CAS PubMed.
- S. Wang, S. Yuan, Y. B. Yin, Y. H. Zhu, X. B. Zhang and J. M. Yan, Part. Part. Syst. Charact., 2016, 33, 493 CrossRef CAS.
- M. Chhowalla, H. S. Shin, G. Eda, L. J. Li, K. P. Loh and H. Zhang, Nat. Chem., 2013, 5, 263–275 CrossRef PubMed.
- L. J. Ye, H. Y. Xu, D. K. Zhang and S. J. Chen, Mater. Res. Bull., 2014, 55, 221–228 CrossRef CAS.
- X. Q. Qiao, F. C. Hu, D. F. Hou and D. S. Li, Mater. Lett., 2016, 169, 241–245 CrossRef CAS.
- H. X. Zhong, K. Li, Q. Zhang, J. Wang, F. L. Meng, Z. J. Wu, J. M. Yan and X. B. Zhang, NPG Asia Mater., 2016, 8, 132 CrossRef.
- C. S. Zhu, L. Zhang, B. Jiang and M. B. Wu, Appl. Surf. Sci., 2016, 377, 99–108 CrossRef CAS.
- Q. Zhang, S. Z. Kang, D. Wang, X. Q. Li, L. X. Qin and J. Mu, Catal. Commun., 2016, 82, 7–10 CrossRef CAS.
- A. Molina-Sanchez and L. Wirtz, Phys. Rev. B: Condens. Matter Mater. Phys., 2011, 84, 1–8 CrossRef.
- Y. Wang and Y. N. Ni, Anal. Chem., 2014, 86, 7463–7470 CrossRef CAS PubMed.
- S. J. Xu, D. Li and P. Y. Wu, Adv. Funct. Mater., 2015, 25, 1127–1136 CrossRef CAS.
- W. Gu, Y. H. Yan, X. N. Cao, C. L. Zhang, C. P. Ding and Y. Z. Xian, J. Mater. Chem. B, 2016, 4, 27–31 RSC.
- H. H. Lin, C. X. Wang, J. P. Wu, Z. Z. Xu, Y. J. Huang and C. Zhang, New J. Chem., 2015, 39, 8492–8497 RSC.
- C. B. Roxlo, R. R. Chianelli, H. W. Deckman, A. F. Ruppert and P. P. Wong, J. Vac. Sci. Technol., A, 1987, 5, 555 CAS.
- H. Tributsch, Z. Naturforsch., A: Phys., Phys. Chem., Kosmophys., 1977, 9, 972–985 Search PubMed.
- E. Fortin and W. M. Sears, J. Phys. Chem. Solids, 1982, 43, 881 CrossRef CAS.
- F. L. Liu, Z. B. Guo, H. G. Ling, Z. N. Huang and D. Y. Tang, Microporous Mesoporous Mater., 2016, 227, 104–111 CrossRef CAS.
- Z. Li, S. Z. Jiang, S. C. Xu, C. Zhang and B. Y. Man, Sens. Actuators, B, 2016, 230, 645–652 CrossRef CAS.
- J. Luo, X. S. Zhou, L. Ma, L. M. Xu and J. Q. Zhang, Mater. Res. Bull., 2016, 81, 16–26 CrossRef CAS.
- H. J. Song, S. S. You, X. H. Jia and J. Yang, Ceram. Int., 2015, 41, 13896–13902 CrossRef CAS.
- B. B. Sheng, J. S. Liu, Z. Q. Li, M. H. Wang, K. J. Zhu, J. H. Qiu and J. Wang, Mater. Lett., 2015, 144, 153–156 CrossRef CAS.
- J. H. Li, D. E. Wang, H. J. Ma, Z. D. Pan, Y. X. Jiang, M. Li and Z. J. Tian, Mater. Lett., 2015, 160, 550–554 CrossRef CAS.
- N. Li, Y. M. Chai, Y. P. Li, Z. Tang and C. G. Liu, Mater. Lett., 2012, 66, 236–238 CrossRef CAS.
- H. Luo, C. Xu, D. B. Zou, L. Wang and T. K. Ying, Mater. Lett., 2008, 62, 3558–3560 CrossRef CAS.
- X. H. Zhang, X. H. Huang and M. Q. Xue, Mater. Lett., 2015, 148, 67–70 CrossRef CAS.
- J. F. Xie, J. J. Zhang, S. Li and F. Grote, J. Am. Chem. Soc., 2013, 47, 17881–17888 CrossRef PubMed.
- S. Yuan, S. Wang, L. Li, Y. H. Zhu, X. B. Zhang and J. M. Yan, ACS Appl. Mater. Interfaces, 2016, 8, 9178 CAS.
- Y. C. Liu, L. F. Jiao, Q. Wu, J. Du, Y. P. Zhao, Y. C. Si, Y. J. Wang and H. T. Yuan, J. Mater. Chem. A, 2013, 1, 5822 CAS.
- D. A. D'Amico, L. B. Manfredi and V. P. Cyras, J. Appl. Polym. Sci., 2012, 123, 200 CrossRef.
- X. S. Wang, H. B. Feng, Y. M. Wu and L. Y. Jiao, J. Am. Chem. Soc., 2013, 14, 5304–5307 CrossRef PubMed.
- K. F. Mak, K. L. He, J. Shan and T. F. Heinz, Nat. Nanotechnol., 2012, 8, 494–498 CrossRef PubMed.
- Y. H. Lee, X. Q. Zhang, W. J. Zhang, L. H. Li and T. W. Lin, Adv. Mater., 2012, 24, 2320–2325 CrossRef CAS PubMed.
- Y. L. Zhang, Z. F. Yin, C. M. Dai, X. F. Zhou and W. Chen, J. Colloid Interface Sci., 2016, 481, 210–219 CrossRef CAS PubMed.
- X. B. Zhang, J. Wang, H. X. Zhong, Z. L. Wang and F. L. Meng, ACS Nano, 2016, 10, 2342 CrossRef PubMed.
- X. J. Li, Y. N. Li, F. Xie, W. Li, W. J. Li, M. F. Chen and Y. Zhao, RSC Adv., 2015, 5, 84465–84470 RSC.
- D. N. Xiong, G. F. Huang, B. X. Zhou, Q. Yan, A. L. Pan and W. Q. Huang, J. Colloid Interface Sci., 2016, 464, 103–109 CrossRef CAS PubMed.
- H. Tang, H. Huang, X. S. Wang, K. Q. Wu, G. G. Tang and C. S. Li, Appl. Surf. Sci., 2016, 379, 296–303 CrossRef CAS.
- S. P. Patil, B. Bethi, G. H. Sonawane, V. S. Shrivastava and S. Sonawane, J. Ind. Eng. Chem., 2016, 34, 356–363 CrossRef CAS.
- D. Wan, W. B. Li, G. H. Wang, K. Chen, L. L. Lu and H. Qin, Appl. Surf. Sci., 2015, 349, 988–996 CrossRef CAS.
- L. X. Hu, H. Yuan, L. P. Zou, F. Y. Chen and X. Hu, Appl. Surf. Sci., 2015, 355, 706–715 CrossRef CAS.
- W. Gao, S. Zhao, H. Wu and S. Asuha, Appl. Clay Sci., 2016, 126, 98–106 CrossRef CAS.
- X. B. Wang, W. P. Cai, Y. X. Lin, G. Z. Wang and C. H. Liang, J. Mater. Chem., 2010, 39, 8582–8590 RSC.
- Y. H. Chao, W. S. Zhu, X. Y. Wu, F. F. Hou, S. H. Xun, P. W. Wu, H. Y. Ji, H. Xu and H. M. Li, Chem. Eng. J., 2014, 243, 60–67 CrossRef CAS.
Footnote |
| † Electronic supplementary information (ESI) available. See DOI: 10.1039/c6ra22414h |
|
| This journal is © The Royal Society of Chemistry 2016 |
Click here to see how this site uses Cookies. View our privacy policy here. 


