Green synthesis of BiOBr modified Bi2O2CO3 nanocomposites with enhanced visible-responsive photocatalytic properties†
Nana Guo,
Yali Cao*,
Yaling Rong and
Dianzeng Jia*
Key Laboratory of Energy Materials Chemistry, Ministry of Education, Key Laboratory of Advanced Functional Materials, Institute of Applied Chemistry, Xinjiang University, Autonomous Region, Urumqi, Xinjiang 830046, China. E-mail: caoyali@xju.edu.cn; jdz@xju.edu.cn; Fax: +86-991-8588883; Tel: +86-991-8583083
First published on 26th October 2016
Abstract
BiOBr/Bi2O2CO3 nanocomposites with mesh-like structures were simply synthesized by a green solid-state chemical reaction route with no extra template or surfactant. The as-synthesized nanocomposites have an altered thickness with the different composite ratio and exhibited excellent visible light photocatalytic activity for the degradation of dyes. The optimum photocatalytic activity of BiOBr/Bi2O2CO3 with a molar percentage of 60% was almost 25 times higher than Bi2O2CO3 towards degradation of RhB by visible-light. The enhanced photocatalytic activity could be attributed to the extended absorption in the visible light range and the formation of p–n heterojunctions between p-type BiOBr and n-type Bi2O2CO3 which promoted the photogenerated electron–hole separation. Radical scavenger experiments indicated that ·O2− and h+ played a major role during the RhB degradation process. The photocatalytic mechanism during the degradation process was also proposed.
1. Introduction
Semiconductor photocatalysis have been widely studied as a promising approach to solve environmental pollution in an environmentally friendly, efficient and thoroughgoing way.1–3 Although the focus of research has centered on TiO2 and its modifications, the large band gap of ∼3.2 eV makes it only active in the UV region.4 Therefore, the development of novel visible light photocatalysts is important in the field of photocatalysis. Recently, bismuth-based nanostructured materials with an aurivillius-layered structure photocatalysts has aroused many researchers' great interest. Some bismuth-based nanostructures, including Bi2O3,5,6 Bi2S3,7 BiVO4,8 Bi2O2CO3 9,10 and BiWO4,11 received attention due to their unique layered structure and the valence bands of Bi 6s and O 2p orbits well-dispersed in the hybridization.12 This structure can facilitate charge transfer and prohibit recombining of photogenerated electron–holes. Among these compounds, subcarbonate (Bi2O2CO3) as a typical member of the aurivillius-related oxide family is demonstrated to be a highly promising photocatalyst.13 The structure of Bi2O2CO3 constructed (Bi2O2)2+ layers and (CO3)2− layers14 which exhibited much higher photocatalytic activity due to its abundant oxygen defects. Unfortunately, similar to TiO2, the prepared Bi2O2CO3 material is only excited by the UV-light to degradate organic dyes. In order to improve the utilization of solar light and reduce the recombination of photogenerated charge carriers, some studies have focused on the fabrication of Bi2O2CO3-based composite photocatalysts, including β-Bi2O3/Bi2O2CO3,15 Bi2O2CO3/BiOCl,16 Bi2O2CO3/BiWO4 17 and Bi2O2CO3/CdS.18 These coupled semiconductors exhibited much higher photocatalytic activities under visible light for the decomposition of organic compounds in waste water.Bismuth oxyhalides (BiOX, X = Cl, Br, I),16,19–21 as a ternary oxide semiconductors, have also evoked great interest as a next-generation potential photocatalyst. The layered structure of bismuth oxyhalides can provide the large enough space to polarize the related atoms and orbitals, and then the induced dipole can facilitate separation and transfer of photogenerated electron–hole pairs, making the higher photocatalytic efficiency.22–24 In recent years, BiOBr has drawn considerable attractive owing to its relatively appropriate band-gap (∼2.8 eV) and stability under visible light irradiation. Huang's group reported that BiOBr had higher photocatalytic activity than P25 under UV illumination and iodine-modified BiOBr exhibited high photocatalytic activities.25 Zhang's group prepared BiOBr hierarchical microspheres by employing KBr or CTAB as Br source with one-pot EG-assisted solvothermal process.26 Zhang's group showed that BiOBr nanoplates prepared at different pH values have substrate-dependent photocatalytic activities under visible-light irradiation.20 These works revealed that BiOBr could perform as a good photocatalyst and solar-energy-conversion, make it promising for the potential application in the treatment for dye wastewater.
Comparatively, semiconductor combination with matching band potentials has been extensively adopted to enhance the efficient separation of photo-generated charge carriers and realize the overall response of solar spectra, then achieving the higher efficiency for the decomposition of organic compounds in waste water.27,28 Some methods have been reported to prepare nanocomposite photocatalyst, such as hydrothermal method, precipitation method and acid etching method.17,21,29 However, these techniques involve complication preparation processes, high temperature and expensive equipment, which increased the production costs and made them unsuitable for large scale production. As far as we know, there is no systematic report on the synthesis of BiOBr/Bi2O2CO3 composite by a low-heating solid-state reaction way. There are advantages of low cost, high productivity, less pollution and simplicity for low-heating solid-state synthesis,30–34 which make it become meaningful for the preparation of nanomaterials. Therefore, it is requisite to prepare the BiOBr/Bi2O2CO3 composites with excellent visible-responsive photocatalytic activity by a simple low-heating solid-state reaction way.
In this paper, the BiOBr/Bi2O2CO3 composite with different mole percentage has been successfully synthesized by a fast and simple low-heating solid-state chemical reaction route, and the process reported here should be a promising synthesis route for prepared BiOBr/Bi2O2CO3 composite. The composite presented much higher photocatalytic activities toward the degradation of rhodamine B (RhB) than Bi2O2CO3 by visible light irradiation. Furthermore, the roles of reactive species (including ·O2−, ·OH, h+ and e−) and the possible photocatalytic activity mechanism was studied in detail.
2. Experimental section
2.1 Synthesis of BiOBr/Bi2O2CO3 composites
The BiOBr/Bi2O2CO3 composites were synthesized by a facile solid-state synthesis method. In a typical experiment, the 2.4254 g bismuth nitrate pentahydrate (Bi(NO3)3·5H2O) was ground for about 6 min in agate mortar to ensure the evenness of materials. Then proper amounts of cetyltrimethylammonium bromide (CTAB) and sodium bicarbonate (NaHCO3) (molar percentage of CTAB/NaHCO3 changed from 0 to 100%) were added into the mixture and grounded for 40 min. Subsequently, the sample was collected and treated in water bath at 60 °C for two days. Finally, the mixture was washed thoroughly with distilled water and isopropyl alcohol, dried at room temperature in air and collected for characterization.2.2 Characterization
The phase structure and purity of the sample were characterized by X-ray diffraction (XRD) on a Bruker D8 using filtered Cu Kα radiation. The morphology of the obtained sample was investigated using field emission scanning electronic microscopy (FESEM Hitachi S-4800, at 5 kV). Transmission electron microscope (TEM) and high resolution transmission electron microscope (HRTEM) images of the products were obtained on a JEOL JEM-2100F electron microscope with an accelerating voltage of 200 kV. X-ray photoelectron spectra (XPS) were recorded using ESCALAB 250 Xi system. The Brunauer–Emmett–Teller (BET) and Barrett–Joyner–Halenda (BJH) results were obtained on a Quantachrome surface area and porosity analyzer. UV-vis diffuse reflectance spectra were obtained on Hitachi U-3010 spectrophotometer with BaSO4 as the reference.2.3 Photocatalytic test
The photocatalytic activity of the as prepared samples were evaluated by the degradation of RhB (20 mg L−1), using a 350 W Xe lamp with a 420 nm cut-off filter. In each experiment, the typical photocatalytic degradation process was arranged in this way: some of the photocatalysts (20 mg) were added into 50 mL of dye solution. Prior to illumination, the suspension was sonicated for 10 min and then kept in the dark for 60 min to reach an adsorption–desorption equilibrium. And then the suspension was exposed to visible-light illumination under magnetically stirring. At a given time interval, 4 mL suspension was sampled and centrifuged to remove the photocatalyst particles. The dye concentration was analyzed by UV-visible spectrophotometer.2.4 Active species trapping experiments
In order to examine the active species during photocatalytic process, the benzoquinone, isopropanol, ammonium oxalate and AgNO3 were used to remove active species of ·O2−, ·OH, h+ and e−, respectively.11,17 In this reaction system, the concentrations of all scavengers were 1 mmol L−1. The test method was similar to the above photocatalytic experiments.3. Results and discussion
3.1 Characterization of BiOBr/Bi2O2CO3 composites
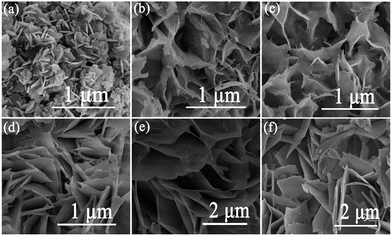 | ||
| Fig. 2 SEM images of as-prepared samples: (a) Bi2O2CO3, (b) 20% BiOBr/Bi2O2CO3, (c) 40% BiOBr/Bi2O2CO3, (d) 60% BiOBr/Bi2O2CO3, (e) 80% BiOBr/Bi2O2CO3 and (f) BiOBr. | ||
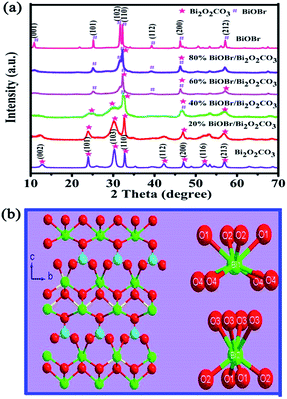
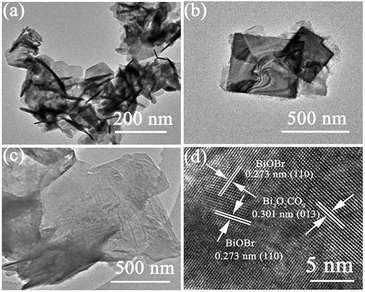
TEM and HRTEM images were shown in Fig. 3, the morphology of the Bi2O2CO3, BiOBr and 60% BiOBr/Bi2O2CO3 from TEM images agreed with the SEM results. The HRTEM image of a single in mesh-like structure was shown in Fig. 3d. The clear fringe spacing of 0.277 nm and 0.302 nm can be indexed to (110) lattice plane of tetragonal BiOBr and (103) lattice plane of Bi2O2CO3, respectively. The fringe of Bi2O2CO3 was inconsistent with those obtained from pure Bi2O2CO3, which indicated the heterojunction structure was formed between Bi2O2CO3 and BiOBr.
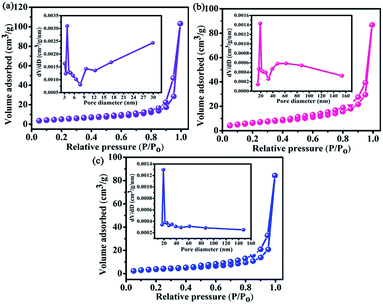 | ||
| Fig. 4 Nitrogen adsorption–desorption isotherms and pore size distribution for: (a) Bi2O2CO3, (b) 60% BiOBr/Bi2O2CO3, (c) BiOBr. | ||
| Samples | SBET (m2 g−1) | Pore volume (cm3 g−1) | Pore size (nm) |
|---|---|---|---|
| Bi2O2CO3 | 18.472 | 0.072 | 13.833 |
| 20% | 29.769 | 0.068 | 19.122 |
| 40% | 23.498 | 0.058 | 13.835 |
| 60% | 21.973 | 0.080 | 19.082 |
| 80% | 19.425 | 0.077 | 19.091 |
| BiOBr | 13.654 | 0.051 | 19.155 |
| (αhυ)n = A(hυ − Eg) | (1) |
3.2 Photocatalytic properties
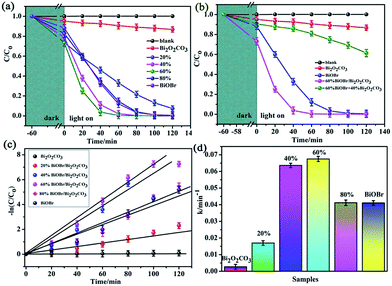
RhB was used as a model dye to evaluate the photocatalytic activity of the samples under the visible light (in Fig. 7a). It was clearly found that RhB was very stable and did not decompose by the photolysis route. At the same time, it could be seen that the Bi2O2CO3 displayed poor photocatalytic activity for the degradation RhB with percentage of 13% after 120 min visible light irradiation because that the pure Bi2O2CO3 is not activate under visible-light, and the degradation process is ascribed to desensitized effect.21 Clearly, all the nanocomposites exhibited better photocatalytic activity under visible light than Bi2O2CO3, the 60% BiOBr/Bi2O2CO3 composite showed the highest photocatalytic activity, by which the dye could be completely degradated within 40 min. The photocatalytic degradation of methyl orange (MO), methyl blue (MB), acid fuchsin (AF) and Congo red (CR) solutions over the 60% BiOBr/Bi2O2CO3 sample were also tested under identical experimental conditions (in Fig. S4†). It was easily found that the photocatalyst had good adsorption and photocatalytic ability. The removal efficiencies for all kinds of dyes could reach to 80% within 25 min. We further investigated the pH-dependent photocatalytic activity of 60% BiOBr/Bi2O2CO3 for RhB dye (in Fig. S5†). It was found that the nanocomposite exhibited poor photocatalytic activities in pH below 6. In order to testify the coupling of BiOBr/Bi2O2CO3 composite played an important role for the photocatalytic degradation activity, the result for photocatalytic degradation of RhB with directly physical mixture with the similar mole ratio as the composite was shown in Fig. 7b. The obtained degradation activity of 60% BiOBr/Bi2O2CO3 composite was much higher than that of the mechanically mixed sample for the degradation of RhB. It indicated that these composites prepared by the solid-state reaction were not physical mixtures of BiOBr and Bi2O2CO3, the heterojunction between Bi2O2CO3 and BiOBr has been formed. The stability of the photocatalyst are the major factors for practical applications. In this work, we evaluate the stability and reusability of the prepared samples, and the recycling experiments were conducted for the degradation of RhB with 60% BiOBr/Bi2O2CO3, shown in Fig. S6.† It was found that the photocatalytic efficiency of BiOBr/Bi2O2CO3 composite keeps about 90% after three runs. The results indicate that the composite exhibits the high stability during the photocatalytic degradation of RhB.To have a better investigate of the kinetics of the RhB degradation (Fig. 7c), the experimental data are fitted by a pseudo first-order simplification of Langmuir–Hinshelwood (L–H) kinetics as expressed by eqn (2), which was well established for the photocatalytic experiments when the organic dye is in the millimolar concentration range.33,35
 | (2) |
3.3 Discussion of degradation mechanism
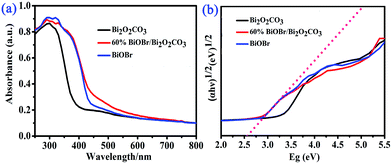
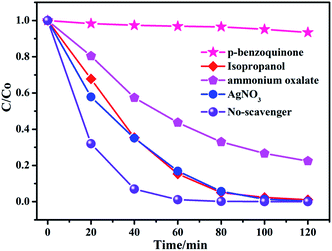
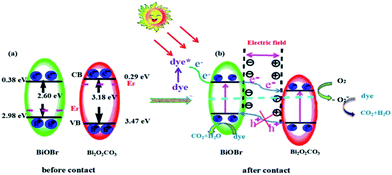
To evaluate the role of primary reactive species, a series of experiment for 60% BiOBr/Bi2O2CO3 composite about the effect of reactive species scavengers on the degradation of RhB under visible light irradiation have been investigated. Benzoquinone (BQ), isopropanol (IPA), ammonium oxalate (AO) and AgNO3 were used to investigate the role of ·O2−, ·OH, h+ and e−, respectively.21 As shown in Fig. 8, the degradation of RhB has little variation after adding the quencher of AgNO3 and IPA, indicating the e− and ·OH had less effect on the photocatalytic process. However, the inhibition of the photocatalytic performance was observed when benzoquinone was added which confirmed the importance of O2− during photodegradation process. In addition, in the presence of ammonium oxalate, the degradation rate has decreased, which suggested that h+ may play a role in the reaction.The transfer, generation and separation of photogenerated electron–hole pairs had important effects on the photodegradation process. The band edge potentials levels have a significant impact on the migration path of the photogenerated carriers,45 the band edge positions of composite were calculated according to the following empirical formulas:27
| EVB = X − Ee + 0.5Eg | (3) |
| ECB = EVB − Eg | (4) |
4. Conclusions
In summary, the mesh-like BiOBr/Bi2O2CO3 composites nanostructures were simply synthesized via a facile solid-state chemical reaction route under solvent-free and template-free condition. The composites nanostructures exhibited superior visible-light-driven photocatalytic performance in degradation of RhB, and 60% BiOBr/Bi2O2CO3 composites displayed the highest photocatalytic activity which is 25 times of pure Bi2O2CO3. The enhanced photocatalytic activity is closely related to the suitable conduction band interaction, structure characteristic and the extended absorption in visible light range which efficiently separated photogenerated electron–hole pairs and provided more photocatalytic reaction centers. This study provides the possibility of template-free solid-state synthesis for the fabrication and application of advanced visible-light nano-photocatalysts with p–n heterojunction structures to remove harmful organic dyes in wastewater.Acknowledgements
This work was financially supported by the Natural Science Foundation of Xinjiang Province (No. 2014711004 and 2014211A013), the National Natural Science Foundation of China (No. 21361024, 21471127 and U1503392) and the Open Project Program of Xinjiang Laboratory of Advanced Functional Materials (No. XJDX0902-2013-04).Notes and references
- M. R. Hoffmann, S. T. Martin, W. Choi and D. W. Bahnemann, Chem. Rev., 1995, 95, 69 CrossRef CAS.
- S. Y. Chai, Y. J. Kim, M. H. Jung, A. K. Chakraborty, D. Jung and W. I. Lee, J. Catal., 2009, 262, 144 CrossRef CAS.
- T. Tachikawa, A. M. Fujitsuka and T. Majima, J. Phys. Chem. C, 2007, 111, 5259 CAS.
- R. A. He, S. Cao, P. Zhou and J. Yu, Chin. J. Catal., 2014, 35, 989 CrossRef CAS.
- M. Muruganandham, R. Amutha, G. J. Lee, S. H. Hsieh, J. J. Wu and M. Sillanpää, J. Phys. Chem. C, 2012, 116, 12906 CAS.
- X. Xiao, R. Hu, C. Liu, C. Xing, C. Qian, X. Zuo, J. Nan and L. Wang, Appl. Catal., B, 2013, 140–141, 433 CrossRef CAS.
- F. Chen, Y. Cao and D. Jia, J. Colloid Interface Sci., 2013, 404, 110 CrossRef CAS PubMed.
- J. Yu and A. Kudo, Adv. Funct. Mater., 2006, 16, 2163 CrossRef CAS.
- Y. Liu, P. Zhang, H. Lv, J. Guang, S. Li and J. Jiang, RSC Adv., 2015, 5, 83764 RSC.
- Y. Peng, K. K. Wang, P.-P. Yu, T. Liu and A. W. Xu, RSC Adv., 2016, 6, 42452 RSC.
- L. Zhang, H. Wang, Z. Chen, P. K. Wong and J. Liu, Appl. Catal., B, 2011, 106, 1 CrossRef CAS.
- L. Zhou, W. Wang, S. Liu, L. Zhang, H. Xu and W. Zhu, J. Mol. Catal. A: Chem., 2006, 252, 120 CrossRef CAS.
- Z. Ni, Y. Sun, Y. Zhang and F. Dong, Appl. Surf. Sci., 2016, 365, 314 CrossRef CAS.
- M. Guan, C. Xiao, J. Zhang, S. Fan, R. An, Q. Cheng, J. Xie, M. Zhou, B. Ye and Y. Xie, J. Am. Chem. Soc., 2013, 135, 10411 CrossRef CAS PubMed.
- R. Hu, X. Xiao, S. Tu, X. Zuo and J. Nan, Appl. Catal., B, 2015, 163, 510 CrossRef CAS.
- H. Lu, L. Xu, B. Wei, M. Zhang, H. Gao and W. Sun, Appl. Surf. Sci., 2014, 303, 360 CrossRef CAS.
- X. Huang and H. Chen, Appl. Surf. Sci., 2013, 284, 843 CrossRef CAS.
- Y. Ao, L. Xu, P. Wang, C. Wang, J. Hou and J. Qian, Dalton Trans., 2015, 44, 11321 RSC.
- W. An, W. Cui, Y. Liang, J. Hu and L. Liu, Appl. Surf. Sci., 2015, 351, 1131 CrossRef CAS.
- V. Malik, M. Pokhriyal and S. Uma, RSC Adv., 2016, 6, 38252 RSC.
- Z. Ai, J. Wang and L. Zhang, Chin. J. Catal., 2015, 36, 2145 CrossRef CAS.
- J. Jiang, K. Zhao, X. Xiao and L. Zhang, J. Am. Chem. Soc., 2012, 134, 4473 CrossRef CAS PubMed.
- R. Hao, G. Wang, H. Tang, L. Sun, C. Xu and D. Han, Appl. Catal., B, 2016, 187, 478 CrossRef.
- S. M. Sun, W. Z. Wang, L. Zhang, L. M. Zhou, W. Z. Yin and M. Shang, Environ. Sci. Technol., 2009, 43, 2005 CrossRef CAS PubMed.
- W. Wang, F. Huang, X. Lin and J. Yang, Catal. Commun., 2008, 9, 8 CrossRef CAS.
- X. Zhang, Z. Ai, F. Jia and L. Zhang, J. Phys. Chem. C, 2008, 112, 747 CAS.
- J. Cao, B. Xu, H. Lin, B. Luo and S. Chen, Chem. Eng. J., 2012, 185–186, 91 CrossRef CAS.
- X. Li, J. Yu and M. Jaroniec, Chem. Soc. Rev., 2016, 45, 2603 RSC.
- X. Zhang, T. Guo, X. Wang, Y. Wang, C. Fan and H. Zhang, Appl. Catal., B, 2014, 150–151, 486 CrossRef CAS.
- R. Y. Wang, D. Z. Jia, L. Zhang, L. Liu, Z. P. Guo, B. Q. Li and J. X. Wang, Adv. Funct. Mater., 2006, 16, 687 CrossRef CAS.
- Y. Cao, D. Jia, J. Zhou and Y. Sun, Eur. J. Inorg. Chem., 2009, 2009, 4105 CrossRef.
- F. Chen, Y. Cao and D. Jia, CrystEngComm, 2013, 15, 4747 RSC.
- Y. Li, Y. Cao and D. Jia, J. Mater. Chem. A, 2014, 2, 3761 CAS.
- J. Xie, Y. Cao, D. Jia, H. Qin and Z. Liang, Catal. Commun., 2015, 69, 34 CrossRef CAS.
- Y. Zheng, F. Duan, M. Chen and Y. Xie, J. Mol. Catal. A: Chem., 2010, 317, 34 CrossRef CAS.
- T. Zhao, J. Zai, M. Xu, Q. Zou, Y. Su, K. Wang and X. Qian, CrystEngComm, 2011, 13, 4010 RSC.
- L. Xu, X. Yang, Z. Zhai and W. Hou, CrystEngComm, 2011, 13, 7267 RSC.
- G. I. N. Waterhouse, G. A. Bowmaker and J. B. Metson, Phys. Chem. Chem. Phys., 2001, 3, 3838 RSC.
- H. Yu, R. Liu, X. Wang, P. Wang and J. Yu, Appl. Catal., B, 2012, 111–112, 326 CrossRef CAS.
- X. Xiao and W. D. Zhang, RSC Adv., 2011, 1, 1099 RSC.
- Y. Schuhl, H. Baussart, R. Delobel, M. L. Bras, J. M. Leroy, L. Gengembre and J. Grimblot, J. Chem. Soc., Faraday Trans., 1983, 79, 2055 RSC.
- J. Cao, B. Xu, H. Lin, B. Luo and S. Chen, Chem. Eng. J., 2012, 185–186, 91 CrossRef CAS.
- S. Park, J. Jun, H. W. Kim and C. Lee, Solid State Commun., 2009, 149, 315 CrossRef CAS.
- X. Li, J. Yu and M. Jaroniec, Chem. Soc. Rev., 2016, 45, 2603 RSC.
- W. Z. Tang, Z. Zhang, H. An, M. O. Quintana and D. F. Torres, Environ. Tech., 1997, 18, 1 CrossRef CAS.
- J. Xia, J. Di, S. Yin, H. Xu, J. Zhang, Y. Xu, L. Xu, H. Li and M. Ji, RSC Adv., 2014, 4, 82 RSC.
- Y. Ao, K. Wang, P. Wang, C. Wang and J. Hou, Dalton Trans., 2016, 45, 7986 RSC.
- L. Chen, S. F. Yin, S. L. Luo, R. Huang, Q. Zhang, T. Hong and P. C. T. Au, Ind. Eng. Chem. Res., 2012, 51, 6760 CrossRef CAS.
- C. Chen, W. Ma and J. Zhao, Chem. Soc. Rev., 2010, 39, 4206 RSC.
Footnote |
| † Electronic supplementary information (ESI) available. See DOI: 10.1039/c6ra22385k |
| This journal is © The Royal Society of Chemistry 2016 |

