DOI:
10.1039/C6RA22163G
(Paper)
RSC Adv., 2016,
6, 97438-97444
Biogenic and chemogenic synthesis of TiO2 NPs via hydrothermal route and their antibacterial activities
Received
4th September 2016
, Accepted 5th October 2016
First published on 6th October 2016
Abstract
Herein, we outline a simple hydrothermal route for the synthesis of titanium dioxide (TiO2) nanoparticles (NPs) using novel biogenic source Piper betel leaf extract and chemogenic source nitric acid as capping and reducing agents. The synthesized TiO2 NPs were subjected to various characterization techniques such as UV-vis spectrophotometry, X-ray diffraction (XRD), Fourier transform infrared spectroscopy (FT-IR), transmission electron microscopy (TEM), and energy dispersive X-ray spectroscopy (EDS) for their optical, structural, morphological and compositional analysis. The obtained results reveal the following features; XRD analysis confirms the phase formation and presence of nanocrystalline TiO2. FT-IR spectroscopy analysis reveals the presence of Ti–O vibrational bands, O–H bands, plant proteins, tannins, carbohydrates and polyols. TEM analysis shows the NPs were of spherical shape with an average size of about 8 nm and 75 nm for biogenic and chemogenic synthesized TiO2 respectively. EDS analysis confirms the chemical compositions of the NPs having Ti and O elements. Further, these synthesized TiO2 NPs were studied for their antibacterial activity against multi-drug resistant microorganisms like Staphylococcus aureus (Gram-positive) and Escherichia coli (Gram-negative); here we observe that the minimum inhibitory concentration (MIC) values for biogenic and chemogenic are 25 μg mL−1 and 50 μg mL−1 respectively. These results suggest that biogenic synthesized NPs act as a more effective antibacterial agent than chemogenic synthesized NPs.
1. Introduction
TiO2 NPs have received considerable attention in recent years because of their unique catalytic, electronic, optical, and structural properties and consequent technological applications as catalysts,1 sensors,2 nanoelectronic devices,3 biosensors,4 dye-sensitized solar cells5 and image contrast agents in medical diagnostics.6 Performance and applicability depend critically on their size, shape, surface morphology, composition, and fine structure, either as alloys or core–shell.7,8 TiO2 particles with different morphologies such as NPs, nanotubes, and nanorods have been synthesized using different reducing and stabilizing agents by sol–gel9,10 electrochemical anodic oxidation,5 hydrothermal,11,12 electrospinning,13,14 chemical vapor deposition15 and spray pyrolysis16 methods. Comparatively, hydrothermal processing offers a promising approach due to its simple process, fast reaction and low cost; it may pave the way for novel TiO2 morphologies with the new properties. Thus, it is obvious that the design and synthesis of NPs with tailor-made structural properties are highly cherished goal for researchers working in the fields of nanoscience and nanotechnology. As a result, suitable synthetic routes need to be developed to ensure a reliable supply of such NPs in sufficient quantities. Moreover, it is extremely desirable that these synthetic protocols are energy efficient, economically viable and environment-friendly if they are to be useful in a real situation. In this context, green methods are highly relevant as it provides the necessary framework of principles which must be satisfied by a given synthetic protocol in order to be implementing for practical application. One of the most promising green methods for NPs preparation is a biogenic synthesis, which employs non-toxic and multifunctional reactants derived from natural and biological sources ranging from unicellular organisms to higher plants that are often characterized as medicinal plants. The plant extracts having phytochemicals such as polyphenols, flavonoids, proteins, terpenoids, tannins, etc.17 These metabolites not only acts as reducing agents for metal ion but also as capping agents, which helps to minimize the agglomeration of NPs. Several groups working in this field have achieved spectacular success like for synthesis of Ag, Au,18 ZnO, Cu and In2O3
19 NPs using different biological systems. These synthesized NPs have been used in anticancer,20 antimicrobial,21 antidiabetic22 activities. Likewise, TiO2 nanoparticles were synthesized using Azadirachta indica,23 fungus24 and Jatropha curcas L.25 but in these cases, the particle size distribution is not uniform. Eventually, fungus mediated synthesis of TiO2 NPs studies for their antibacterial activities and the MIC values is 40 μg mL−1. The use of Piper betel leaf extract in the synthesis of NPs is a relatively recent addition because of its greater potency to act as natural antioxidants. The antioxidant property is correlated with different biological activities like hepatoprotective, antidiabetic, antiarthritis, antistroke and anticancer properties since free radicals are involved in all these diseases.17
Herein, we are describing a simple and inexpensive technique to synthesize the nanocrystalline TiO2 using the capping and reducing agent's betel leaf extract and nitric acid via hydrothermal route. For the confirmation of TiO2 particles, we have made various characterizations like UV-vis spectrophotometer, XRD, FT-IR, TEM, and EDS. Further, we tested their antibacterial activities against Staphylococcus aureus and Escherichia coli. To our knowledge, TiO2 NPs have been synthesized for the first time using novel green source betel leaf extract via hydrothermal route. These synthesis processes could be suitable for large scale production of NPs.
2. Experimental detail and methods
2.1 Chemicals
Titanium(IV) n-butoxide (TNB) [99 wt% liquid analytical grade] was purchased from Alfa Aesar chemicals, India. Nitric acid (HNO3) (69 wt% analytical grade) was purchased from SD fine chemicals, India. De-ionized water (DW) is used in the preparation of all suspensions and solutions.
2.2 Plant material and preparation of the extract
The aqueous leaf extract was prepared using Piper betel leaf, purchased from local market Dharwad. The Piper betel leaves extract was prepared by placing 10 gram of finely chopped leaves in 250 mL Erlenmeyer flask along with 100 mL DW and later boiling the mixture up to 80 °C for 30 minutes. The supernatant was filtered with Whatman filter paper No. 1, stored below 20 °C and used within a week.
2.3 Synthesis of TiO2 NPs
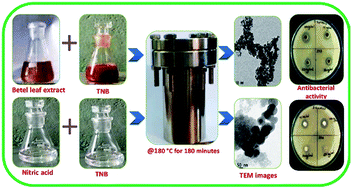
The biogenic and chemogenic synthesis of TiO2 NPs were carried out via hydrothermal route. For the biogenic synthesis of TiO2 NPs (STG), a mixture of 10 mL Piper betel leaves extract and 10 mL DW were taken in 25 mL beaker, stirred for 10 minutes at room temperature. Then 0.5 mL TNB was added dropwise to this mixture and stirred for 45 minutes. The brown colloidal solution was then transferred to a 25 mL Teflon-lined stainless steel autoclave, the autoclave was sealed and placed in an oven heated up to 180 °C for 180 minutes, then the autoclave was cooled down to room temperature. Under the ambient conditions, the reaction mixture was centrifuged to collect the product; the product was washed continuously with DW and ethanol several times to remove the organic molecules bonded to the surface of the product. The final product was dried in an oven at 50 °C for 60 minutes and the same procedure, as adopted in STG was used to obtain the final product for chemogenic method (STH), but in this method Piper betel leaf extract replaced by nitric acid. The product obtained by biogenic and chemogenic methods are in the form of brown and white color powders respectively, which were used for various characterization techniques.
2.4 Characterization techniques
2.4.1 UV-vis spectroscopy. UV-vis absorbance spectra in the wavelength range 200–800 nm were measured using UV-vis spectrophotometer (model: V-670 Jasco) at USIC, K. U. Dharwad.
2.4.2 XRD. The crystal structures of the powder samples at a scanning rate of 0.02° per second in the range of 20° to 80° with the use of Cu Kα radiation of wavelength 1.54060 Å were analyzed by XRD (model: Rigaku pro analytical) at M. I. T. Manipal. Peak analysis was carried out using PCPDFWIN software.
2.4.3 FT-IR. The IR absorption bands of samples in the range of 4000 to 400 cm−1 at a resolution of 2 cm−1 in KBr pellets were analyzed using FT-IR spectrograph (model: Nicolet 6700) at USIC, K. U. Dharwad.
2.4.4 TEM. The surface morphology and nano nature of the samples at an operating voltage 200 kV were examined using TEM (model: Hitachi 7500) at STIC, Cochin. Along with corresponding selected area electron diffraction (SAED) pattern. TEM images were analyzed using PIXEL imaging software.
2.4.5 EDS. Elemental compositions were analyzed using EDS (model: NORAN System 7) at University of Mysore, Mysore.
2.4.6 Antibacterial activity. Antibacterial activities of powder samples STG and STH were evaluated by Agar well diffusion method.24 Lag phase cultures of Staphylococcus aureus (Gram-positive) and Escherichia coli (Gram-negative) were used as the test microorganisms. 100 μL of the test organisms were inoculated into the sterile nutrient Agar petri plates (Hi-Media) for which four wells were bored using sterile cork borer having 6 mm diameter. Four concentrations of STG and STH (25, 50, 75 and 100 μg mL−1 in DW) were added into the respective labelled wells. These petri plates were incubated at 37 °C for 24 hours in incubator during which the activity was evidenced by the presence of a zone of inhibition surrounding the well and measured in millimetres.
3. Results and discussion
The simple hydrothermal route was employed to yield nanocrystalline TiO2 using the novel green source Piper betel leaf and nitric acid.
3.1 UV-vis spectroscopy analysis
UV-vis spectra were recorded for STG and STH in an ethanol solvent at room temperature and are shown in Fig. 1(a). From the Fig. 1(a) it is observed that the absorption maxima (λmax) for STG and STH were found to be 342 nm and 341 nm respectively, which is a preliminary indication for the presence of TiO2 material.26 The method of Kubelka–Munk transformation on the absorption data can be used to estimate the band gap of STG and STH samples,27 the optical absorption coefficient (α) is used to estimate bandgap energy of the semiconductor and is expressed by equation |
 | (1) |
here hν is an energy of the photon, Eg is the band gap energy, A is a constant depends on the transition probability, and n depends on the nature of the transition for allowed direct transition (n = 1/2), for allowed indirect transition (n = 2). In our cases, for an indirect band gap, the value of n is 2 for STG and STH.27 The band gap of STG and STH samples were estimated by extrapolating straight portion of the plot (αhν)1/2 versus hν as shown in Fig. 1(b) and also it is known as Tauc's plot, the estimated Eg values were found to be 3.10 eV and 3.07 eV respectively.
 |
| Fig. 1 (a) UV-vis spectra for STG and STH, (b) the Tauc's plots for STG and STH. | |
3.2 XRD analysis
XRD analysis was carried out to verify the presence of nanocrystalline and phase formation. Fig. 2 and 3 shows XRD pattern for STG and STH powders respectively, it is observed that there is the presence of strong and sharp peaks; it may indicate the formation of the well-crystallized samples. From the Fig. 2 it is observed that the Bragg's reflection peaks were at 2θ = 24.931°, 37.753°, 47.563°, 54.732°, 62.180°, 69.591°, 75.015° and 82.407° can be indexed to (110), (401), (602), (221), (−341), (620), (621) and (423) crystal planes respectively. The comparison of 2θ values in observed (Fig. 2) XRD patterns with those from the Standard Joint Committee on Powder Diffraction Standards (JCPDS) data no. 46-1238 confirms the formation of the TiO2 phases having rutile phase and a monoclinic crystal structure. Fig. 3 shows the XRD pattern for the STH, and it is observed that the Bragg's reflection peaks were at 2θ = 27.056°, 35.765°, 40.866°, 43.724°, 53.962°, 56.274°, 62.553°, 68.716° and 89.274° can be indexed to the (110), (101), (111), (210) (211), (220), (002), (301) and (330) crystal planes respectively. The comparison of 2θ values in observed (Fig. 3) XRD patterns with those from the JCPDS data no. 79-1640 confirms the formation of TiO2 having rutile phase with a tetragonal crystal structure. Some sharp Bragg's peaks were observed in the XRD patterns, it may due to the capping agent as stabilizing the nanoparticles and intense Bragg's reflection suggests the strong X-ray scattering centers in the crystalline phase and could be due to capping agents. Generally, the broadening of peaks in XRD patterns is attributed to crystalline size effects. Broader peaks signify smaller crystalline size and reflect the effects due to experimental conditions on the nucleation and growth of the crystal nuclei.28
 |
| Fig. 2 XRD pattern for STG. | |
 |
| Fig. 3 XRD pattern for STH. | |
The Scherrer's equation27 is used to estimate an average crystalline size by determining the full width at half maximum (FWHM) of the most intense reflection plane and this equation is given by
|
 | (2) |
where
D is an average crystalline size,
λ is the wavelength of X-ray used (1.50406 × 10
−10 m),
θ is the Bragg's angle in radian and
β is the full width at half maximum of the most intense reflection peak in radian. In our cases, the most intense peak for STG and STH were found to be (110) plane and the estimated average crystalline size is 4.05 nm and 50.70 nm respectively.
3.3 FT-IR spectroscopy analysis
FT-IR spectroscopy analysis was conducted to demonstrate the successful conjugation of some molecules associated with TiO2 NPs. The FTIR spectrum of chemogenic synthesized TiO2 NPs (Fig. 4(a)) shows a strong peak at 520 cm−1 is associated with characteristic vibrational modes of O–Ti, the absorption bands at 1621 cm−1 (OH bending), 1463 cm−1 (CH bending) and 3430 cm−1 (OH stretching bands).29 The FT-IR spectrum of Piper betel leaf, as shown in Fig. 4(c), peaks at 3442 cm−1 (free NH stretching), 2928 cm−1 (CH asymmetric stretching), 2855 cm−1 (CH symmetric stretching), 1740 cm−1 (C
O stretching), 1623 cm−1 (NH asymmetric bending amide I), 1548 cm−1 (NH symmetric bending amide II), 1480 cm−1 (CH bending), and 1024 cm−1 (C–O stretching), whereas the biogenic synthesized TiO2 NPs shows peaks at 3390, 2923, 1630, 1490, 1026 and 530 cm−1, as indicated in Fig. 4(b). The main significant difference between the spectrum of Piper betel leaf before and after TiO2 NPs reduction is the disappearance peak at 1740 cm−1 and appropriate alteration of 3442 cm−1, 1623 to 1024 cm−1. This phenomenon revealed that biomolecules in the Piper betel leaf, such as tannins, polyols, carbohydrates, proteins and flavonoids, which contain C
O groups (1740 cm−1) may play an important role in the bioreduction and stabilization of TiO2 NPs.30,31 The peak at 3390 cm−1 of plant proteins in the NPs (Fig. 4(b)) is much broadens, due to H-bonds can form between the amide groups. Here the amide groups intend to form stronger bonds with Ti atoms, which will break the most of the H-bonds between the N–H groups and lead to blue shifts of the amide bonds. The absorption peaks of TiO2 NPs at 1630, 1490 and 1026 cm−1 were undergone redshift (higher wave number). The strong peak (Fig. 4(b)) at 530 cm−1 is attributed to Ti–O vibrations.29 The reappearance of these groups in the spectrum of TiO2 NPs suggested the attachment of some N–H, N
H, and C
O groups onto TiO2 NPs during the biosynthesis process. Hence, it was deduced that TiO2 NPs might be capped and stabilized by biomolecules (polyols, carbohydrates, proteins and flavonoids).
 |
| Fig. 4 FT-IR spectra for (a) STH, (b) STG and (c) betel leaf. | |
3.4 TEM analysis
TEM analysis was used to examine the surface morphology and nano nature of the samples. Fig. 5(a) shows the TEM image with 10 nm magnification for STG and it confirm the NPs having regular spherical like shape with an average particle size of 8 nm. On the other hand, the SAED pattern of STG [Fig. 5(b)] shows the brighter spot and intense rings. It may indicate that STG NPs are well crystallized and amorphous in nature. The SAED [Fig. 5(b)] pattern rings were correlated with XRD [Fig. 2] lattice planes (110), (401), (602), (221) and (−341) of the monoclinic TiO2. Fig. 6(a) shows the TEM image with 50 nm magnification for STH, this TEM image shows that the TiO2 NPs were irregular and agglomerated with the large particle size of about 75 nm. Reasons for these large size particles is may be due to aggregation of two or more NPs together.32 The SAED [Fig. 6(b)] pattern revealed that diffraction rings having brighter spots and diffuse rings it may indicate that STH NPs are well crystalline and amorphous in nature. The SAED [Fig. 6(b)] pattern rings were correlated with XRD [Fig. 3] lattice planes (110), (101), (111), (210), (211), and (220) of the tetragonal TiO2.
 |
| Fig. 5 (a) TEM image for STG of 10 nm magnification, (b) SAED pattern for STG. | |
 |
| Fig. 6 (a) TEM image for STH of 50 nm magnification, (b) SAED pattern for STH. | |
3.5 EDS analysis
The EDS was employed to examine the chemical compositions in STG and STH. Fig. 7(a) shows the EDS spectrum for STG, from this spectrum it is observed that the particle compositions were indeed Ti and O. The small quantities of additional elements, including C, and N were associated with the residues of proteins and carbohydrates. Fig. 7(b) shows the EDS spectrum for STH, from this spectrum it is observed that the particle compositions having Ti and O, the small quantities of additional elements C, P, and Na were present. The EDS results demonstrate that the TiO2 nanoparticles are entrapped within the cured epoxy network.33
 |
| Fig. 7 EDS spectra for (a) STG and (b) STH. | |
3.6 Antibacterial activity
An antibacterial assay of STG and STH were evaluated against the two human pathogenic bacteria Staphylococcus aureus and Escherichia coli using Agar well diffusion method. Fig. 8(a) and (b), shows an antibacterial activity of STG with Staphylococcus aureus and Escherichia coli respectively. Fig. 8(c) and (d) shows an antibacterial activity of STH with Staphylococcus aureus and Escherichia coli respectively. From these figures, it is observed that STG and STH exhibit good antibacterial activity with the zones of inhibition on the culture plates against Staphylococcus aureus and Escherichia coli. Table 1 shows the zone of inhibition measurements in millimeter for four concentrations (μg mL−1) of STG and STH against Staphylococcus aureus and Escherichia coli bacteria respectively. From Table 1 it is observed that STG shows zone of inhibition for all four concentrations i.e., 25, 50, 75 and 100 μg mL−1 and STH shows the zone of inhibition for 50, 75 and 100 μg mL−1 concentrations but it is failed to shows the zone of inhibition at lower concentration 25 μg mL−1 for both human pathogens. In the earlier case, G. Rajakumar et al.24 reported that MIC for TiO2 is 40 μg mL−1, but in our studies we observe the MIC for STG and STH is 25 μg mL−1 and 50 μg mL−1 respectively. From the Table 1 it may, inferred that STG shows bigger zone of inhibition as compared STH, this indicates that the STG is a potent antibacterial agent carrying considerably greater capacity to kill the microbes as compared to that of the STH. Further, it is observed that STG shows comparatively higher antibacterial activity for the human pathogen Staphylococcus aureus as compared to that of Escherichia coli.
 |
| Fig. 8 Antibacterial activity (a) STG with Staphylococcus aureus, (b) STG with Escherichia coli. (c) STH with Staphylococcus aureus, (d) STH with Escherichia coli. | |
Table 1 Antibacterial activities of STG and STH
Concentration (μg mL−1) |
Staphylococcus aureus (Gram-positive) |
Escherichia coli (Gram-negative) |
STH |
STG |
STH |
STG |
Zone of Inhibition in mm |
25 |
— |
11 |
— |
10 |
50 |
10 |
13 |
10 |
12 |
75 |
12 |
15 |
12 |
14 |
100 |
15 |
19 |
14 |
18 |
4. Conclusion
In summary, we have synthesized TiO2 NPs with the novel green source and nitric acid as capping agents via hydrothermal route. These NPs were characterized using UV-vis spectrophotometer, XRD, FT-IR, TEM, and EDS, results were signified that UV-vis spectroscopy confirms the presence of TiO2 material and from the Tauc's plots it is inferred that STH having lower band gap energy as compared to STG. The XRD data obtained for STG and STH holds in good agreement with the standard JCPDS data and they are having rutile phase with monoclinic and tetragonal structures respectively. FTIR analysis suggests that presence of O–Ti vibrational bands, O–H bands, proteins, tannins, carbohydrates and polyols. TEM images confirm an average particle size of STG is smaller than STH NPs; they are in spherical shape and SAED pattern shows crystalline ring structures which are in good agreement with the crystal planes of STG and STH NPs. EDS analysis confirms the presence of Ti and O compositions. Further, an antibacterial activity of STG and STH NPs as a function of concentration were tested against two different Gram stained bacteria Staphylococcus aureus and Escherichia coli. Comparatively, STG NPs are cost-effective; eco-friendly and biogenic molecules with the capability to serve as antibacterial agents against Staphylococcus aureus and Escherichia coli human pathogens over STH NPs. From our current findings that the synthesized TiO2 NPs showing a zone of inhibitory activities against both Staphylococcus aureus and Escherichia coli human pathogenic bacteria. Furthermore, we may be concluded that these synthesized TiO2 NPs can be used in medicine as the therapeutic agents due to their antibacterial activities against human pathogenic bacteria evaluated in vitro.
Abbreviations
TiO2 | Titanium dioxide |
NPs | Nanoparticles |
HNO3 | Nitric acid |
STG | Synthesis of TiO2 NPs using the green source |
STH | Synthesis of TiO2 NPs using HNO3 |
Acknowledgements
The authors (SMH and VRD) acknowledge the financial support under the UGC-UPE fellowship from Karnatak University Dharwad. Authors are thankful to the director (Prof. N. M. Badiger) and technical staff of USIC, Karnatak University Dharwad for UV-vis and FT-IR measurements.
References
- V. Vamathevan, R. Amal, D. Beydoun, G. Low and S. McEvoy, J. Photochem. Photobiol., A, 2002, 148, 233–245 CrossRef CAS.
- O. K. Varghese, D. Gong, M. Paulose, K. G. Ong and C. A. Grimes, Sens. Actuators, B, 2003, 93, 338–344 CrossRef CAS.
- T. Chen, J. Qiu, K. Zhu and J. Li, Mater. Des., 2016, 90, 1069–1076 CrossRef CAS.
- H. Zhou, X. Gan, J. Wang, X. Zhu and G. Li, Anal. Chem., 2005, 77, 6102–6104 CrossRef CAS PubMed.
- J. Zhang, S. Li, H. Ding, Q. Li, B. Wang, X. Wang and H. Wang, J. Power Sources, 2014, 247, 807–812 CrossRef CAS.
- M. Kirillin, M. Shirmanova, B. Khlebtsov, E. Zagaynova, M. Sirotkina and M. Bugrova, J. Biomed. Opt., 2009, 14, 21017 CrossRef PubMed.
- T. Mokari, S. E. Habas, M. Zhang and P. Yang, Angew. Chem., Int. Ed., 2008, 47, 5605–5608 CrossRef CAS PubMed.
- M. N. Alam, N. Roy, D. Mandal and N. A. Begum, RSC Adv., 2013, 3, 11935 RSC.
- N. Wetchakun and S. Phanichphant, Curr. Appl. Phys., 2008, 8, 343–346 CrossRef.
- R. A. Caruso, J. H. Schattka and A. Greiner, Adv. Mater., 2001, 13, 1577–1579 CrossRef CAS.
- T. N. Made and S. A. Treatment, Adv. Mater., 2002, 14, 2000–2003 Search PubMed.
- S. S. Mali, C. A. Betty, P. N. Bhosale and P. S. Patil, CrystEngComm, 2011, 13, 6349–6351 RSC.
- B. Ding, C. K. Kim, H. Y. Kim, M. K. Se and S. J. Park, Fibers Polym., 2004, 5, 105–109 CrossRef CAS.
- T. A. Arun, A. A. Madhavan, D. K. Chacko, G. S. Anjusree, T. G. Deepak, S. Thomas, S. V. Nair and A. S. Nair, Dalton Trans., 2014, 43, 4830–4837 RSC.
- X. Chen and S. S. Mao, Chem. Rev., 2007, 107, 2891–2959 CrossRef CAS PubMed.
- C. Jiang, M. Y. Leung, W. L. Koh and Y. Li, Thin Solid Films, 2011, 519, 7850–7854 CrossRef CAS.
- D. Pradhan, K. A. Suri, D. K. Pradhan and P. Biswasroy, J. Pharmacogn. Phytochem., 2013, 1, 147–167 Search PubMed.
- P. Raveendran, J. Fu and S. L. Wallen, Green Chem., 2006, 8, 34–38 RSC.
- V. V. Makarov, A. J. Love, O. V. Sinitsyna, S. S. Makarova, I. V. Yaminsky, M. E. Taliansky and N. O. Kalinina, Acta Naturae, 2014, 6, 35–44 CAS.
- R. Sukirtha, K. M. Priyanka, J. J. Antony, S. Kamalakkannan, R. Thangam, P. Gunasekaran, M. Krishnan and S. Achiraman, Process Biochem., 2012, 47, 273–279 CrossRef CAS.
- V. K. Sharma, R. A. Yngard and Y. Lin, Adv. Colloid Interface Sci., 2009, 145, 83–96 CrossRef CAS PubMed.
- V. Ganesh Kumar, S. Dinesh Gokavarapu, A. Rajeswari, T. Stalin Dhas, V. Karthick, Z. Kapadia, T. Shrestha, I. A. Barathy, A. Roy and S. Sinha, Colloids Surf., B, 2011, 87, 159–163 CrossRef PubMed.
- R. Sankar and K. Rizwana, Appl. Nanosci., 2015, 5, 731–736 CrossRef CAS.
- G. Rajakumar, A. A. Rahuman, S. M. Roopan, V. G. Khanna, G. Elango, C. Kamaraj, A. A. Zahir and K. Velayutham, Spectrochim. Acta, Part A, 2012, 91, 23–29 CrossRef CAS PubMed.
- M. Hudlikar, S. Joglekar, M. Dhaygude and K. Kodam, Mater. Lett., 2012, 75, 196–199 CrossRef CAS.
- T. Zhu, W. Li Ong, L. Zhu and G. Wei Ho, Sci. Rep., 2015, 5, 10601 CrossRef CAS PubMed.
- P. B. Patil, V. V. Kondalkar and N. B. Pawar, RSC Adv., 2014, 4, 47278–47286 RSC.
- M. R. Bindhu and M. Umadevi, Spectrochim. Acta, Part A, 2013, 101, 184–190 CrossRef CAS PubMed.
- S. Liufu, H. Xiao and Y. Li, J. Colloid Interface Sci., 2005, 281, 155–163 CrossRef CAS PubMed.
- P. Usha Rani and P. Rajasekharreddy, Colloids Surf., A, 2011, 389, 188–194 CrossRef CAS.
- S. Justin Packia Jacob, J. S. Finub and A. Narayanan, Colloids Surf., B, 2012, 91, 212–214 CrossRef CAS PubMed.
- N. Erdogan, A. Ozturk and J. Park, Ceram. Int., 2016, 42, 5985–5994 CrossRef CAS.
- D. E. Newbury, Scanning, 2009, 31, 91–101 CrossRef CAS PubMed.
|
This journal is © The Royal Society of Chemistry 2016 |
Click here to see how this site uses Cookies. View our privacy policy here.