DOI:
10.1039/C6RA22048G
(Paper)
RSC Adv., 2016,
6, 102406-102412
Synthesis and evaluation of polyaspartic acid/furfurylamine graft copolymer as scale and corrosion inhibitor
Received
2nd September 2016
, Accepted 14th October 2016
First published on 14th October 2016
Abstract
A novel scale and corrosion inhibitor, polyaspartic acid/furfurylamine graft copolymer (PASP/FA), was synthesized using maleic anhydride, urea, and furfurylamine (FA) as raw materials. The structure of PASP/FA was characterized by 1H NMR. PASP/FA exhibits excellent scale inhibition performance at low concentration, and its overall performance was significantly improved as compared with polyaspartic acid. The inhibition efficiency of PASP/FA was close to 100% against CaCO3 with 1 mg L−1 inhibitor at 80 °C and reached up to 100% against CaSO4 at 70 °C when dosage of the inhibitor was 5 mg L−1. The best inhibition efficiency against Ca3(PO4)2 at 80 °C was about 96% when the concentration of inhibitor was 10 mg L−1. The maximum corrosion inhibition efficiency at 45 °C was as high as 30%, when 16 mg L−1 of inhibitor was adopted. When the temperature was 50 °C and a pH = 9, the best dispersion capacity for Fe2O3 (according to 69% of transmittance) was reached when 48 mg L−1 of inhibitor was applied in the tested system. The structure and morphology of CaCO3 and CaSO4 were observed by scanning electron microscopy (SEM) and X-ray powder diffraction (XRD).
1. Introduction
Currently, pollution and shortage of water resources compels people to save water and protect the environment.1 With rapid development of industry, industrial water consumption increases dramatically and the consumption of cooling water accounts for a large proportion of industrial production.2,3 In the recirculation process of cooling water there exist some adverse phenomena, such as scaling and corrosion, and these can lead to reduction of productivity, which directly impacts economic efficiency.4,5 To solve these problems, some scale and corrosion inhibitors were applied to the recirculation system of cooling water.6 However, a series of environmental problems such as eutrophication and gene mutation of aquatic organisms took place because most of the inhibitors were phosphoric and toxic.7,8 In this study many non-toxic, non-phosphorus, efficient, biodegradable green scale and corrosion inhibitors were extensively researched since the 1990s.9,10
Polyaspartic acid (PASP) is a water-soluble polymer which contains a unique peptide bond structure in the molecular chain. It is a widely recognized environmentally-friendly green inhibitor that presents a broad prospect due to its non-toxic, non-phosphate, and biodegradable properties.11,12 With little investment and at low cost, it can effectively address the current problem of low utilization and serious pollution of water resources, and it also does not cause secondary pollution.13,14 Therefore, the study of PASP and its derivatives has great scientific value and practical significance for solving the water crisis and improving economic efficiency.15 PASP exhibits excellent performance against CaCO3 and CaSO4, but is not superior for other properties. Thus, a series of physical and chemical methods were explored in this study to modify PASP and improve its overall performance.16,17
It is well known that furfurylamine (FA) is a potential corrosion inhibitor.18 In this study, furfurylamine was introduced to the side chain of polyaspartic acid by the reaction of ring opening using polysuccinimide (PSI) and furfurylamine. It was anticipated that the modified product, polyaspartic acid/furfurylamine graft copolymer (PASP/FA), would improve the overall properties of PASP. The structure of PASP/FA was characterized by 1H NMR. The scale inhibition and corrosion inhibition performance of PASP/FA were investigated by methods of static testing and a weight loss test, respectively. The performance of dispersing Fe2O3 was made by measuring transmittance of the tested solution. The morphology of CaCO3 and CaSO4 were observed by scanning electronic microscopy (SEM) and X-ray powder diffraction (XRD).
2. Experimental
2.1 Reagents and instruments
Maleic anhydride, antimony potassium tartrate, eriochrome black T and ammonium molybdate tetrahydrate were obtained from Kemiou Chemical Reagent Co., Ltd (Tianjin, P. R. China). Hexamethylenetetramine and furfurylamine were purchased from Aladdin Chemical Reagent Co., Ltd (Shanghai, P. R. China). Urea, ethylenediaminetetraacetic acid disodium salt and ascorbic acid were supplied by Tianjin No. 1 Chemical Reagent Factory (Tianjin, P. R. China).
Instruments used in the research included AVANCE 400 nuclear magnetic resonance (Switzerland), RCC-III rotary coupon corrosion tester (P. R. China), 723N grating spectrophotometer (P. R. China), JSM-7610F scanning electron microscopy (Japan), and D8 Advance X-ray powder diffractometer (Germany).
2.2 Synthesis of polysuccinimide (PSI)
9.8 g of maleic anhydride was mixed with 10 mL of distilled water in a four-neck flask and heated at 80 °C, generating a transparent solution. Subsequently, 4.2 g of urea was added into the above solution and heating was maintained until the temperature reached 160 °C. Then, 1 mL of mixed acid (H3PO4![[thin space (1/6-em)]](https://www.rsc.org/images/entities/char_2009.gif) :
:![[thin space (1/6-em)]](https://www.rsc.org/images/entities/char_2009.gif) H2SO4 = 1
H2SO4 = 1![[thin space (1/6-em)]](https://www.rsc.org/images/entities/char_2009.gif) :
:![[thin space (1/6-em)]](https://www.rsc.org/images/entities/char_2009.gif) 1) was added and dehydrated for 2 h. The dehydrated product was cooled down to room temperature and washed with distilled water and vacuum dried whereby orange solid polysuccinimide (PSI) was obtained. The relevant synthetic reaction is illustrated in Fig. 1.19
1) was added and dehydrated for 2 h. The dehydrated product was cooled down to room temperature and washed with distilled water and vacuum dried whereby orange solid polysuccinimide (PSI) was obtained. The relevant synthetic reaction is illustrated in Fig. 1.19
 |
| | Fig. 1 Synthesis route of PSI. | |
2.3 Synthesis of polyaspartic acid (PASP)
A solution of 0.4 g of polysuccinimide and 5 mL of 0.25 M NaOH solution were mixed in a round-bottom flask and heated at 60 °C for 24 h under stirring. The pH value of the solution was adjusted to 7–8 with hydrochloric acid. Then, the above solution was added into ethanol and left standing to cause precipitation. After vacuum drying a yellow solid of PASP resulted. The relevant synthetic reaction is illustrated in Fig. 2.20
 |
| | Fig. 2 Synthesis route of PASP. | |
2.4 Synthesis of polyaspartic acid/furfurylamine graft copolymer (PASP/FA)
A solution of 0.4 g of polysuccinimide, 0.39 g of furfurylamine, and 5 mL of distilled water were mixed in a round-bottom flask and heated at 60 °C for 24 h under stirring. The pH value of the solution was adjusted to 7–8 with hydrochloric acid. Then, the solution was added into ethanol and left standing to cause precipitation. After vacuum drying, a brown solid PASP/FA resulted. The relevant synthetic reaction is illustrated in Fig. 3.
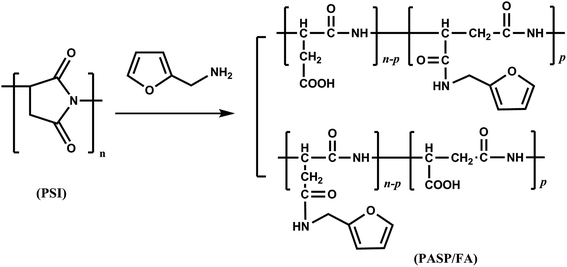 |
| | Fig. 3 Synthesis route of PASP/FA graft copolymer. | |
2.5 Static test for scale inhibition performance
The scale inhibition performance of PASP/FA was evaluated based on the China National Standard (GB/T 16632-2008) by a static test method; the experimental conditions are listed in Table 1. All specimens were cooled down to room temperature after heating. In the experiment against CaCO3 and CaSO4, EDTA was used to titrate and detect remaining Ca2+ in the supernatant.21 In experiments against Ca3(PO4)2, the content of PO43− was evaluated by a phosphomolybdic blue spectrophotometric method.22
Table 1 Experimental conditions of the static test and the inhibition efficiency of calculation formula
| Scale |
Ca2+ (mg L−1) |
HCO3− (mg L−1) |
PO43− (mg L−1) |
SO42− (mg L−1) |
Heating time (h) |
Temperature (°C) |
η |
| Where V0 is the consumed volume of EDTA when no inhibitor was added and the test system was heated; V1 is the consumed volume of EDTA when inhibitor was added and the test system was heated; V2 is the consumed volume of EDTA when no inhibitor was added and the test system was not heated. Where A0 is the absorbance of PO43− when no inhibitor was added and the test system was heated; A1 is the absorbance of PO43− when inhibitor was added and the test system was heated; A2 is the absorbance of PO43− when no inhibitor was added and the test system was not heated. |
| CaCO3 |
250–550 as CaCO3 |
250–550 as CaCO3 |
— |
— |
6–18 |
80 |
(V1 − V0)/(V2 − V0)a |
| CaSO4 |
6800 as CaSO4 |
— |
— |
7100 as Na2SO4 |
6 |
70 |
(V1 − V0)/(V2 − V0)a |
| Ca3(PO4)2 |
250 as CaCO3 |
— |
10 |
— |
10 |
80 |
(A1 − A0)/(A2 − A0)b |
2.6 Weight loss test for corrosion inhibition performance
The corrosion inhibition performance of PASP/FA was evaluated based on the China National Standard (GB/T 18175-2014) by a weight loss method using a rotary coupon corrosion tester. In this test, the temperature was at 45 °C for 72 h. The carbon steel slice had a surface area of 28 cm2 and the density was 7.85 g cm−3. They were soaked in 2 L of mixed solution containing 0.336 g of NaCl, 1.11 g of CaCl2, 0.4815 g of MgSO4, 0.336 g of NaHCO3, and a known amount of inhibitor.23 Corrosion rate and corrosion inhibition efficiency were calculated using formulas (1) and (2).| |
 | (1) |
| |
 | (2) |
where m0 is the mass of the carbon steel slice before test; m1 is the mass of carbon steel slice after test; Δm is the mass loss of the carbon steel slice after washing in acid; S is the surface area of the carbon steel slice (cm2); t is testing time (h); D is the density of carbon steel slice (cm3); ν0 is annual corrosion rate when no inhibitor is added (mm per year); ν is annual corrosion rate when inhibitor is added (mm per year); η is corrosion inhibition efficiency (%).
2.7 Test for performance of dispersing Fe2O3
In a test solution, c(Ca2+) = 150 mg L−1 (as CaCO3), c(Fe2+) = 10 mg L−1, pH = 9, and certain amounts of inhibitor are adopted. The test solution was intensively stirred for 15 min and heated at 50 °C for 5 h before being cooled down to room temperature. The transmittance of supernatant was measured with a 723N grating spectrophotometer at 420 nm.24 The less transmittance, the better the dispersing performance.
3. Results and discussion
3.1 1H NMR spectrum of PASP/FA
Fig. 4 shows the 1H NMR spectrum of PASP/FA in D2O. From the spectrum, 2.65 ppm and 4.39 ppm are attributed to the characteristic peak of –CH2–, 4.25 ppm is ascribed to the peak of –CH– in main chain, 7.35 ppm, 6.30 ppm and 6.19 ppm are assigned to –CH– in furan. Therefore, PASP/FA was synthesized successfully.
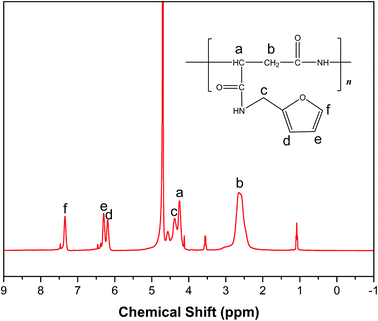 |
| | Fig. 4 1H NMR spectrum of PASP/FA. | |
3.2 The inhibition performance of PASP/FA against CaCO3
3.2.1 Effect of concentration of PASP/FA on inhibition efficiency against CaCO3. The inhibition efficiency against CaCO3 with different concentration of PASP/FA is shown in Fig. 5 (Ca2+: 250 mg L−1, HCO3−: 250 mg L−1, T: 80 °C, t: 6 h). The inhibition efficiency increased with increasing inhibitor concentration. The performance of PASP/FA against CaCO3 was better than PASP within a concentration less than 1.00 mg L−1. This is because the PASP/FA simultaneously contains carboxylic ion and furan ring structures; these structures can more effectively adsorb at the surface of CaCO3 crystal nuclei and delay the generation of precipitation than PASP.25 The inhibition efficiency reached 100% when the inhibitor concentration was greater than or equal to 1.00 mg L−1.
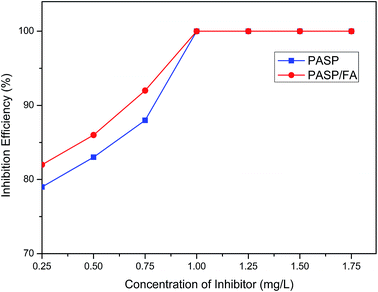 |
| | Fig. 5 The inhibition efficiency of different PASP/FA concentrations against CaCO3 (Ca2+: 250 mg L−1, HCO3−: 250 mg L−1, T: 80 °C, t: 6 h). | |
3.2.2 Effect of concentration of Ca2+ on inhibition efficiency against CaCO3. Fig. 6 shows the relationship between inhibition efficiency and concentration of Ca2+ (Ca2+: 250–550 mg L−1, HCO3−: 250–550 mg L−1, T: 80 °C, t: 6 h, PASP/FA: 1 mg L−1, PASP: 1 mg L−1). The inhibition efficiency declines with the concentration of Ca2+ increasing, but it is always superior to the PASP at the Ca2+ concentration greater than 300 mg L−1. This is because with the increasing of Ca2+ and HCO3−, the equilibrium Ca2+ + 2HCO3− → CaCO3 + CO2 + H2O moves right and is easier to generate CaCO3 precipitates. The introduction of more N atoms on the side chain of the graft copolymer enhances the chelating capability for Ca2+.26 So PASP/FA is more suitable for high hardness water than PASP.
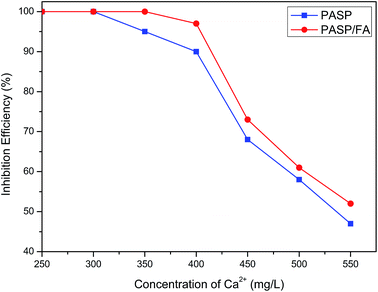 |
| | Fig. 6 Effect of concentration of Ca2+ on inhibition efficiency against CaCO3 (Ca2+: 250–550 mg L−1, HCO3−: 250–550 mg L−1, T: 80 °C, t: 6 h, PASP/FA: 1 mg L−1, PASP: 1 mg L−1). | |
3.2.3 Effect of heating time on inhibition efficiency against CaCO3. Fig. 7 shows the inhibition efficiency for different heating times (Ca2+: 250 mg L−1, HCO3−: 250 mg L−1, T: 80 °C, t: 6–18 h, PASP/FA: 1 mg L−1, PASP: 1 mg L−1). With increasing time, the inhibition efficiency of PASP continuously decreased after 10 h of heating, but PASP/FA maintained almost 100% scale inhibition efficiency within 18 h of testing range. This may be because the PASP/FA and Ca2+ can form a more stable chelating structure than PASP and Ca2+, so even if the heating time was longer, the chelating structure could still remain stable.27
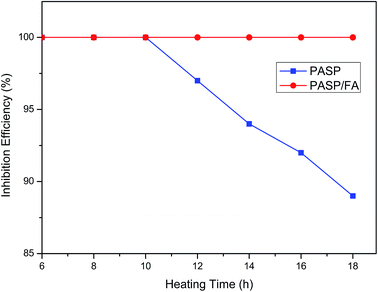 |
| | Fig. 7 Effect of heating time on inhibition efficiency against CaCO3 (Ca2+: 250 mg L−1, HCO3−: 250 mg L−1, T: 80 °C, t: 6–18 h, PASP/FA: 1 mg L−1, PASP: 1 mg L−1). | |
3.3 The inhibition performance of PASP/FA against CaSO4
The inhibition performance of PASP/FA against CaSO4 is shown in Fig. 8 (Ca2+: 6800 mg L−1, SO42−: 7100 mg L−1, T: 70 °C, t: 6 h). The inhibition efficiency increased with an increase of inhibitor concentration. The performance of PASP/FA against CaSO4 was better than PASP within a concentration range of 1–5 mg L−1. When the concentration of inhibitor was 5 mg L−1, the inhibition efficiency was close to 100%. This is because the PASP/FA has more lone pair electrons and they can effectively adsorb at the surface of CaSO4 crystal nuclei and inhibit the growth of crystals by reducing the rate of step movement across a crystal surface.28
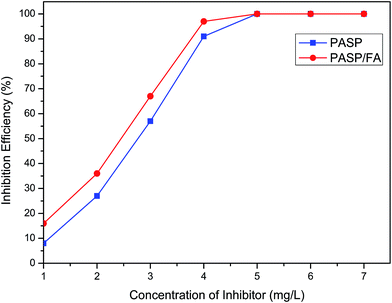 |
| | Fig. 8 Inhibition efficiency of PASP/FA against CaSO4 (Ca2+: 6800 mg L−1, SO42−: 7100 mg L−1, T: 70 °C, t: 6 h). | |
3.4 The inhibition performance of PASP/FA against Ca3(PO4)2
Fig. 9 shows the inhibition performance of PASP/FA against Ca3(PO4)2 (Ca2+: 250 mg L−1, PO43−: 10 mg L−1, T: 80 °C, t: 10 h). As can be seen from Fig. 9, PASP/FA demonstrates significant inhibition performance against Ca3(PO4)2. Its inhibition efficiency gradually increased with increasing concentration of PASP/FA in a 2–10 mg L−1 range. The inhibition efficiency of PASP/FA reached 96% when the concentration was 10 mg L−1, and then it gradually decreased with additional increasing concentration. This is because the PASP/FA contains more N atoms and possesses better chelating capability, thereby preventing deposition of Ca3(PO4)2 crystals. However, when the concentration of PASP/FA increases steric hindrance also increases, resulting in a decline in the stability of the chelates and thus it has a tendency to form precipitates.29
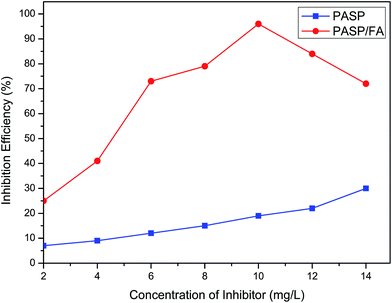 |
| | Fig. 9 Inhibition efficiency of PASP/FA against Ca3(PO4)2 (Ca2+: 250 mg L−1, PO43−: 10 mg L−1, T: 80 °C, t: 10 h). | |
3.5 The corrosion inhibition performance of PASP/FA
Fig. 10 shows the effect of the concentration of PASP/FA on corrosion inhibition efficiency. It can be seen that PASP/FA has excellent corrosion inhibition performance, the maximum corrosion inhibition efficiency was about 30% when the inhibitor concentration was 16 mg L−1, but PASP was only 15% at the same concentration. This is because the PASP/FA possesses a five-member heterocycle structure with π bonds and lone pair electrons on its side chain. The specific structure result is that PASP/FA can be adsorbed at the metallic surface and forms a protective coating, which can hinder ionization process of metals and protect against corrosion and rust.30
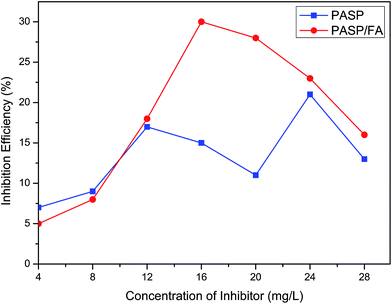 |
| | Fig. 10 Corrosion inhibition efficiency of PASP/FA. | |
3.6 The performance of PASP/FA on dispersing Fe2O3
In a recirculation system of cooling water, iron pipes can be easily oxidized and corroded finally forming Fe2O3. Like other scale, if Fe2O3 is deposited onto the surfaces of the pipes, it will reduce heat transfer efficiency and may cause pipe blockage.31 So, inhibiting or preventing Fe2O3 particles from depositing should be done as far as possible. Fig. 11 shows the performance of PASP/FA on dispersing Fe2O3 (Ca2+: 150 mg L−1, Fe2+: 10 mg L−1, T: 50 °C, t: 5 h). It is seen that the PASP/FA exhibits excellent dispersion capacity for Fe2O3. The best dispersion efficiency was achieved when the concentration of PASP/FA was 48 mg L−1, corresponding to 69% of transmittance in the tested system. However, PASP hardly had any dispersion capacity at the same dosage. This is because PASP/FA has more lone pair electrons that can adsorb at the Fe2O3 surface and these Fe2O3 molecules bring about an electrostatic mutually exclusive interaction to avoid depositing, so the Fe2O3 can disperse in water.32
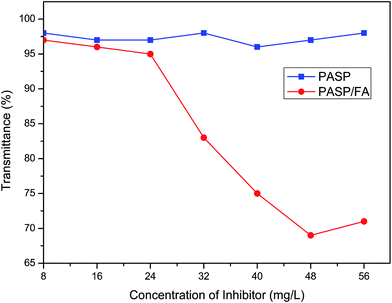 |
| | Fig. 11 Dispersion capacity of PASP/FA for Fe2O3 (Ca2+: 150 mg L−1, Fe2+: 10 mg L−1, T: 50 °C, t: 5 h). | |
3.7 SEM analysis of CaCO3 and CaSO4 crystals
Fig. 12 shows the morphology of CaCO3 and CaSO4 as observed by SEM. CaCO3 particles have regular shape and smooth surface and CaSO4 particles are the regular long strips in the absence of inhibitor (Fig. 12(a) and (c)). When PASP/FA is present in the solution, the structure of CaCO3 and CaSO4 particles are destroyed and then become irregular and fragmentary (Fig. 12(b) and (d)). Consequently, the smaller and floppy scales can be easily washed away and dispersed by water.33
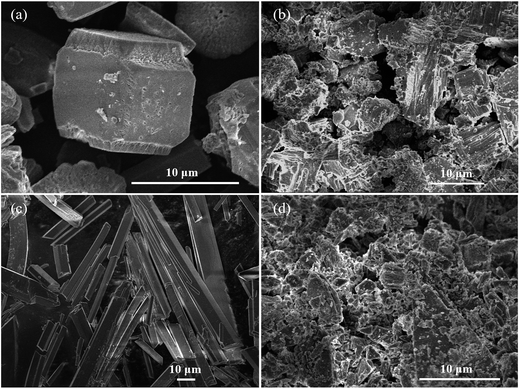 |
| | Fig. 12 SEM images of CaCO3 (a), CaSO4 (c) in the absence of inhibitor, CaCO3 (b), CaSO4 (d) in the presence of PASP/FA. | |
3.8 XRD analysis of CaCO3 and CaSO4 crystals
The XRD patterns of CaCO3 in the absence and presence of PASP/FA are shown in Fig. 13(a) and (b), respectively. We can see diffraction peaks of 26.13°, 27.13°, 33.03°, 37.18°, 37.78°, 38.33°, 41.07°, 42.76°, 45.78°, 48.29°, 50.11°, 52.35°, and 52.81° in Fig. 13(a), which correspond to aragonite, and there are also peaks of 22.98°, 29.28°, 35.86°, 39.33°, 47.42°, and 57.29° for calcite. These results demonstrate that aragonite and calcite are the main crystals formed in the absence of PASP/FA. In Fig. 13(b), except the diffraction peaks of aragonite and calcite as observed, diffraction peaks of 21.02°, 24.94°, 27.05°, 32.82°, 43.89°, 49.15°, 50.13°, and 55.84° correspond to vaterite.34 These changes reflect PASP/FA contributing to distorting the CaCO3 crystals.
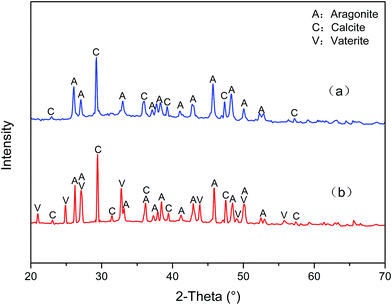 |
| | Fig. 13 XRD patterns of CaCO3 crystals: (a) in the absence of PASP/FA and (b) in the presence of PASP/FA. | |
XRD patterns of CaSO4 in the absence and presence of PASP/FA are shown in Fig. 14(a) and (b). In Fig. 14(a), there are strong characteristic peaks of CaSO4 crystals at 11.62°, 20.71°, 23.41°, 29.13°, 31.11°, and 33.34°. In addition to this, there are some mid-strong characteristic peaks of CaSO4 as well. In Fig. 14(b), these peaks are reduced. This phenomenon indicates that the morphology and crystal sizes of CaSO4 are changed after the addition of PASP/FA.35
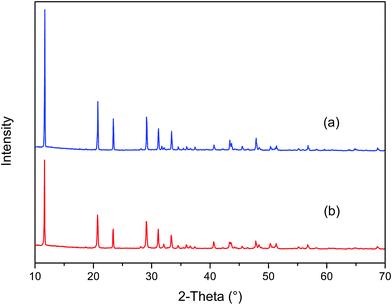 |
| | Fig. 14 XRD patterns of the CaSO4 crystals: (a) in the absence of PASP/FA and (b) in the presence of PASP/FA. | |
4. Conclusion
A novel polyaspartic acid/furfurylamine graft copolymer (PASP/FA) was successfully synthesized by polysuccinimide (PSI) and furfurylamine (FA). The inhibition efficiency against CaCO3 of PASP/FA was close to 100% when the dosage was 1 mg L−1. In addition, under the conditions of high concentration of Ca2+ and long heating time, the inhibition efficiency against CaCO3 is still remarkable. The inhibition efficiency against CaSO4 reached up to 100% when the dosage was 5 mg L−1. The best inhibition efficiency against Ca3(PO4)2 was close to 96% when 10 mg L−1 of inhibitor was adopted. The maximum inhibition corrosion efficiency reached 30% when the dosage was 16 mg L−1. It is worth mentioning that PASP/FA exhibited outstanding capability for dispersing Fe2O3 when 48 mg L−1 of inhibitor was added into the tested system, as shown by a 69% transmittance of the solution. Analysis by SEM and XRD demonstrated that PASP/FA can be adsorbed on crystal active sites and distort the crystal lattice, effectively preventing the formation of scales.
Acknowledgements
The authors gratefully acknowledge the supports of the Science and Technology Development Program of Henan Province (142107000015).
Notes and references
- A. Antony, J. H. Low and S. Gray, J. Membr. Sci., 2012, 383, 1 CrossRef.
- M. Ando and S. Sayato, Water Res., 1984, 18, 315 CrossRef CAS.
- R. Touir, N. Dkhireche and M. Ebn Touhami, Mater. Chem. Phys., 2010, 122, 1 CrossRef CAS.
- I. Drela, P. Falewicz and S. Kuczkowska, Water Res., 1998, 32, 3188 CrossRef CAS.
- M. A. Abu-Dalo, N. A. F. Al-Rawashdeh and A. Ababneh, Desalination, 2013, 313, 105 CrossRef CAS.
- A. A. Al-Hamzah and C. M. Fellows, Desalination, 2015, 359, 22 CrossRef CAS.
- Z. H. Shen, J. S. Li, K. Xu, L. L. Ding and H. Q. Ren, Desalination, 2012, 284, 238 CrossRef CAS.
- H. P. Ding, S. C. Shi, H. T. Shan, Y. H. Cai and Y. Xu, Chem. Res., 2016, 27, 260 Search PubMed.
- A. Ketsetzi, A. Stathoulopoulou and K. D. Demadis, Desalination, 2008, 223, 487 CrossRef CAS.
- I. Andijani and S. Turgoose, Desalination, 1999, 123, 223 CrossRef CAS.
- D. Hasson, H. Shemer and A. Sher, Ind. Eng. Chem. Res., 2011, 50, 7601 CrossRef CAS.
- V. Annibaldi, A. D. Rooney and C. B. Breslin, Corros. Sci., 2012, 59, 179 CrossRef CAS.
- J. H. Guo and S. J. Severtson, Ind. Eng. Chem. Res., 2003, 42, 3480 CrossRef CAS.
- D. Hasson, D. Bramson, B. Limoni-Relis and R. Semiat, Desalination, 1997, 108, 67 CrossRef CAS.
- S. Kumar Shukla and M. A. Quraishi, Corros. Sci., 2009, 51, 1007 CrossRef.
- M. M. Kunjapur, W. H. Hartt and S. W. Smith, Corros. Sci., 1987, 43, 674 CrossRef CAS.
- N. K. Allam, A. A. Nazeer and E. A. Ashour, J. Appl. Electrochem., 2009, 39, 961 CrossRef CAS.
- E. Machnikove, K. H. Whitmire and N. Hackerman, Electrochim. Acta, 2008, 53, 6024 CrossRef.
- R. Ketrane, B. Saidani, O. Gil, L. Leleyter and F. Baraud, Desalination, 2009, 249, 1397 CrossRef CAS.
- Z. Y. Liu, Y. H. Sun and X. H. Zhou, J. Environ. Sci., 2011, 23, 153 CrossRef CAS.
- T. Kumar, S. Vishwanatham and S. S. Kundu, J. Pet. Sci. Eng., 2010, 71, 1 CrossRef CAS.
- Y. Xu, B. Zhang, L. L. Zhao and Y. C. Cui, Desalination, 2013, 311, 156 CrossRef CAS.
- R. Touir, M. Cenoui, M. El Bakri and M. Ebn Touhami, Corros. Sci., 2008, 50, 1530 CrossRef CAS.
- P. Shakkthivel and T. Vasudevan, Desalination, 2006, 197, 179 CrossRef CAS.
- A. Martinod, A. Neville, M. Euvrad and K. Sorbie, Chem. Eng. Sci., 2009, 64, 2413 CrossRef CAS.
- J. X. Chen, L. H. Xu, J. Han, M. Su and Q. Wu, Desalination, 2015, 358, 42 CrossRef CAS.
- B. Zhang, D. P. Zhou, X. G. Lv, Y. Xu and Y. C. Cui, Desalination, 2013, 327, 32 CrossRef CAS.
- Y. Zhang, H. Q. Yin and Q. S. Zhang, Desalination, 2016, 395, 92 CrossRef CAS.
- J. Y. Feng, L. J. Gao and R. Z. Wen, Desalination, 2014, 345, 72 CrossRef CAS.
- Y. H. Gao, L. H. Fan, L. Ward and Z. F. Liu, Desalination, 2015, 365, 220 CrossRef CAS.
- P. Sarin, V. L. Snoeyink and J. Bebee, Water Res., 2004, 38, 1259 CrossRef CAS PubMed.
- Y. Xu, L. L. Zhao, L. N. Wang, S. Y. Xu and Y. C. Cui, Desalination, 2012, 286, 285 CrossRef CAS.
- F. Rahman, Desalination, 2013, 319, 79 CrossRef CAS.
- D. Liu, W. B. Dong and F. T. Li, Desalination, 2012, 304, 1 CrossRef CAS.
- C. Wang, T. T. Shen, S. P. Li and X. K. Wang, Desalination, 2014, 348, 89 CrossRef CAS.
|
| This journal is © The Royal Society of Chemistry 2016 |
Click here to see how this site uses Cookies. View our privacy policy here. ![[thin space (1/6-em)]](https://www.rsc.org/images/entities/char_2009.gif) :
:![[thin space (1/6-em)]](https://www.rsc.org/images/entities/char_2009.gif) H2SO4 = 1
H2SO4 = 1![[thin space (1/6-em)]](https://www.rsc.org/images/entities/char_2009.gif) :
:![[thin space (1/6-em)]](https://www.rsc.org/images/entities/char_2009.gif) 1) was added and dehydrated for 2 h. The dehydrated product was cooled down to room temperature and washed with distilled water and vacuum dried whereby orange solid polysuccinimide (PSI) was obtained. The relevant synthetic reaction is illustrated in Fig. 1.19
1) was added and dehydrated for 2 h. The dehydrated product was cooled down to room temperature and washed with distilled water and vacuum dried whereby orange solid polysuccinimide (PSI) was obtained. The relevant synthetic reaction is illustrated in Fig. 1.19


