High efficiency of bamboo-like carbon nanotubes on functionalized graphite felt as electrode in vanadium redox flow battery

Yu-Chung Changa, Yu-Chen Shiha, Jian-Yu Chenb, Guan-Yi Lina, Ning-Yih Hsub, Yi-Sin Choua and Chen-Hao Wang*a
aDepartment of Materials Science and Engineering, National Taiwan University of Science and Technology, 10607, Taipei, Taiwan. E-mail: chwang@mail.ntust.edu.tw
bInstitute of Nuclear Energy Research, Atomic Energy Council, Executive Yuan, 32546, Taoyuan, Taiwan

Received 2nd September 2016 , Accepted 13th October 2016

First published on 13th October 2016


Abstract

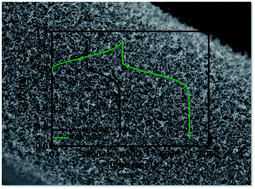
Bamboo-like carbon nanotubes (B-CNT) were directly grown on graphite felt (B-CNT/TA-GF) by chemical vapor deposition for use as positive and negative electrodes in a vanadium redox flow battery (VRFB); the graphite felt was functionalized by acid activation and thermal treatment before the growth of B-CNT. B-CNT/TA-GF shows excellent activity and high reversibility in catalyzing the redox reaction of vanadium ions, in which the ratio of the redox peak current densities is close to 1 and the separation of the redox peak potentials is only 0.181 V. VRFBs using B-CNT/TA-GF show 81.0% energy efficiency, which is superior to those using untreated GF (68.3%), acid-treated GF (77.5%) and acid- and thermal-treated GF (76.1%). Thus, the VRFB using B-CNT/TA-GF yields a low iR drop, high efficiency, and high capacity, which may arise from its large surface area, large amount of oxygen functional groups, low internal resistance, favorable sp2 carbon content, and nitrogen dopant on the surface of the CNTs, all of which make the electrodes in a VRFB efficient.

1. Introduction

Recently, renewable energy generation has been increasing rapidly, as a result of the wide applications of solar cells, wind power generators, and other energy generation systems. However, renewable energy generation depends strongly on weather conditions, making it unstable. Hence, large-scale energy storage supports frequency regulation, which stabilizes the electricity grid during sudden low-loading and over-loading of electrical power. Lithium-ion batteries, nickel metal hydride batteries, lead–acid batteries, and other secondary batteries are promising energy storage devices. However, owing to their specific energy density, cost, lifetime, and safety, secondary batteries are not favored for use as unit cells for large-scale energy storage.1–3 The redox flow battery (RFB) stores energy by the redox reactions of separated reactants in the electrolyte, and its output depends on the number and area of the cells.4 Therefore, the size and design of the stack determine the power of the RFB, while the electrolyte concentration and volume determine the energy capacity of the RFB. These factors can be varied to enable the RFB to store a large amount of energy and provide high power, making it useful for large-scale energy storage.1,5,6 The vanadium redox flow battery (VRFB) establishes vanadium redox couples in sulfuric acid, where the following electrochemical reactions occur in the charging mode:7,8
 
VO2+ + H2O → VO2+ + 2H+ + e, E0 = 1.00 V (1)
 
V3+ + e → V2+, E0 = −0.255 V (2)
 
VO2+ + H2O + V3+ → VO2+ + 2H+ + V2+, E0cell = 1.255 V (3)
where VO2+/VO2+ and V3+/V2+ are established in the positive electrode and the negative electrode, respectively, and the standard cell potential is 1.255 V. Since the VRFB operates in sulfuric acid solution, corrosion is an issue. Carbon-based materials are widely used as electrodes to stabilize the overall reaction; these include graphite felt,9–11 activated carbon,12 carbon paper,13 nanofiber,14 carbon nanowall15 and others.16–20 However, carbon-based materials exhibit poor reversibility and electrochemical activity, and the rate of the VO2+/VO2+ redox reaction dominates the efficiency of the VRFB.7 Therefore, some investigations have attempted to modify carbon-based materials to increase the amount of surface functional groups (–OH and C[double bond, length as m-dash]O) and tune the chemical structure of the carbon surface to accelerate the VO2+/VO2+ redox reaction.11,21 Li et al. immersed conductive carbon paper in a mixed solution of sulfuric acid and nitric acid at 80 °C.13 They found that the O/C ratio of acid-treated carbon paper surface was three times higher than that of untreated carbon paper, and the former provided an energy efficiency of 76%. The –OH functional groups on the surface improve the hydrophilicity of the electrode and cause the electrolyte to flow easily into the electrodes.9 The C[double bond, length as m-dash]O functional groups on the surface also function as active sites where the vanadium redox reaction is catalysed.9,21–23 Doping nitrogen atoms into the carbon material converts the carbon ring structure from hexagonal to a pentagonal or differently shaped carbon–nitrogen ring, forming highly electrochemically active sites.24 Thus, nitrogen-doped carbon-based materials are used in such electrochemical applications as methanol oxidation,25 oxygen reduction,24 lithium-ion batteries26 and biosensors.27

Currently, metallic nanoparticles (e.g. Ir and Bi),28,29 metal oxide nanoparticles (e.g. CeO2, ZrO2 and PdO2),30–32 carbon-related nanostructure materials (e.g. graphene oxide, nanospheres, N-doped graphene),23,33,34 and hybrid materials (e.g. Nb-doped WO3 nanowire and TiO2/carbon black)35,36 have been applied as co-catalyst to modify the carbon-based materials, leading to improvement in the electrochemical activity of the electrode. These metals and metal oxides show the excellent performances. This report focuses on carbon-related materials without any metal deposition, though some cobalt nanoparticles are embedded in CNTs as the catalysts for the CNT growth.

Carbon nanotubes (CNTs) have a high specific ratio of surface area to volume and excellent electrical conductivity. Hence, some investigations have reported that the –OH functional groups of the surfaces and sidewalls of CNTs can improve the performance of VRFBs.11,16,17,21 Wang et al. used nitrogen-doped CNTs on graphite felts in a VRFB and found that nitrogen dopants not only modify the electronic properties of the CNTs but also produce defect sites on their surfaces.37 González et al. investigated the use of pure CNTs (MWCNTs), nitrogen-doped CNTs (CNxMWNTs), and oxygen functionalized CNTs (MWCNT-Cs) as positive electrodes of VRFBs, in which the electrochemical reversibilities that were revealed by the cyclic voltammetry (CV) curves followed the order MWCNT-Cs > CNxMWNTs > MWCNTs, and the energy efficiencies of the corresponding VRFBs were approximately 76%, 70%, and 62%, respectively.38 MWCNT-Cs performed best, because they have the highest sp2 carbon content, rather than either the largest specific surface area or the most functional groups.

In this study, the high electrical conductivity of CNTs is combined with the high redox reversibility of the functional groups, by treating graphite felt by acid activation and thermal oxidation. Subsequently, bamboo-like CNTs (B-CNT) were directly grown on the graphite felt (B-CNT/TA-GF). The thus formed B-CNT/TA-GF exhibited excellent reversibility, according to the CV curves, and provided very high efficiency when used in a VRFB.

2. Experimental method

2.1. Chemicals and materials

Commercial graphite felts were purchased from CeTech. Sulfuric acid and nitric acid were purchased from Scharlau Chemie S.A. and Panreac AppliChem, respectively. All chemicals and solvents were of analytical grade.

2.2. Treatment of graphite felt electrode

For functionalization, the graphite felt was treated in two steps: the first step was acid activation and the second was thermal oxidation. For acid activation, the graphite felt was immersed in a mixed solution of 60 mL sulfuric acid (95 v/v%, Scharlau Chemie) and 20 mL nitric acid (65 v/v%, Scharlau Chemie) for 10 minutes, before being transferred into a Teflon-lined autoclave reactor and heated at 140 °C for 50 min by the hydrothermal method. Afterwards, the graphite felt was washed several times with deionized water and dried at room temperature; the product was denoted A-GF. For thermal oxidation, the A-GF was introduced to the furnace, and treated at 450 °C in an atmosphere of oxygen, yielding TA-GF.

2.3. Process for growing bamboo-like carbon nanotubes

Bamboo-like CNTs were directly grown on the TA-GF in a chemical vapor deposition (CVD) reactor by a catalyst-assisted growth method.39 The TA-GF sample was immersed in a sol–gel solution, which consisted of 2 g of cobalt(III) nitrate (ACROS, 99%), 50 mL of isopropanol (ACROS, 99%) and 2 mL of highly pure titanium tetra-n-butoxide (ACROS, 99%). After it had been fully wetted, the TA-GF was dried at 60 °C in a vacuum oven to remove the residual solvent. Thereafter, the TA-GF was introduced to the CVD reactor. The CVD reactor was fed with H2 at 30 SCCM and then the temperature was increased at 10 °C min−1 to 700 °C. Then, H2/C2H2/NH3 at a flow rate of 30/40/80 SCCM was fed into the CVD reactor for 1 h at 700 °C, causing bamboo-like CNTs to be directly grown on the TA-GF in this step, forming B-CNT/TA-GF.

2.4. Analysis of characteristics

The Brunauer–Emmett–Teller (BET) surface area of the sample was measured using a surface area and porosity analyzer (Micrometry, Tristar 3000). Its chemical composition was measured using an X-ray photoelectron spectroscope (XPS, Thermo, K-Alpha). A field-emission high-resolution transmission electron microscope (HRTEM, JEOL-2100) was used to observe the micro-structure of the sample. The crystalline phase was analyzed by X-ray diffraction spectroscopy (XRD, Bruker D2 PHASER). A morphological image was taken using a high-resolution field emission scanning electron microscope (HRSEM, JEOL-6700F). Raman spectroscopy (Jobin-Yvon LabRAM HR800-confocal micro-Raman spectrometer) was used to identify the D- and G-bands of the sample.

2.5. Electrochemical measurements

Electrochemical measurements and cyclic voltammetry (CV) measurements were made using a three-compartment cell with a potential station (Solartron 1280C). The sample was placed in a PTFE holder as a working electrode. The counter electrode and reference electrode were Pt wire and a mercury/mercurous sulphate electrode (0.658 V vs. NHE), respectively. All potentials were with reference to the normal hydrogen electrode (NHE). All electrochemical measurements were made using an electrolyte of 5 mM V2SO4 in 2 M H2SO4 solution. The potential range was approximately 0.56–1.46 V vs. NHE.

2.6. Vanadium redox flow battery

The VRFB test was performed using a 25 cm2 single cell at a current density of 40 mA cm−2, the single cell design of which is shown in Fig. S1 (see ESI). A Nafion® 117 membrane was used as a separator. The anode and the cathode consisted of as-prepared samples. The compression ratio of carbon felt was fixed at 20% (Fig. S2 of ESI). The electrolyte for both anode and cathode was 80 mL of 1.5 M V2SO4 in 4 M H2SO4 solution, and the VRFB was fully charged to convert vanadium ions into VO2+ and V2+ at the positive and negative electrodes, respectively. Thereafter, the charge–discharge profiles of the VRFB were evaluated between 0.7 and 1.7 V. Finally, a single cell stack was connected to a peristaltic pump (ChromTech, TP-200), which maintained the flow rate of the electrolyte at 12 mL min−1.

3. Results and discussion

Fig. 1a–d show the SEM images of untreated GF, A-GF, TA-GF and B-CNT/TA-GF. Before functionalization, the surface of the untreated GF is smooth, as shown in Fig. 1a. After acid activation, as presented in Fig. 1b, many etching marks, made by acid etching, are visible on the surface of A-GF; these etching marks can increase the number of activation sites on the surface of the graphite felts.17 Fig. 1c indicates that, after oxidation treatment, depressions are present on the edge of the graphite fiber in the TA-GF. When TA-GF was introduced into the CNT growth process, CNTs directly and uniformly grow on the surface of the graphite fiber, yielding B-CNT/TA-GF, as presented in Fig. 1d.
image file: c6ra22035e-f1.tif
Fig. 1 SEM images of (a) untreated GF, (b) A-GF, (c) TA-GF, and (d) B-CNT/TA-GF.

Fig. 2a presents an image that illustrates CNT growth on the graphite felt. The CNT growth begins on the metallic NP surface as shown as Fig. 2c. During the growth process, CNT grows spirally from the bottom to the top. Fig. 2b shows a cross-sectional TEM image of the conjunction of the CNT with the graphite fiber; it indicates that the graphene layers of CNT not only adhere to the carbon cloth but also are directly conjoined with the graphite fiber. Fig. 2c shows that the cobalt catalyst is encapsulated by the amorphous carbon film. This catalyst is assumed to induce the decomposition of C2H2 as the source of carbon for the formation of CNT.39,40 Fig. 2d shows that the as-prepared CNT is a bamboo-like structure with a diameter of 10–20 nm. When an NH3 precursor is used, nitrogen atoms promote the formation of highly curved CNTs with a bamboo-like structure, in which the C–N bonding in a solid graphene layer is inherently non-planar but the C–C bonding therein is inherently planar.39–42 The incorporation of C–N favors the formation of pentagons and heptagons in the graphene layer, which increases the reactivity of the neighboring carbon atoms.43


image file: c6ra22035e-f2.tif
Fig. 2 (a) Scheme of mechanism of CNT growth on the graphite felt; TEM images of (b) conjunction of the CNT and the graphite fiber, (c) a cobalt catalyst encapsulated in the carbon film, and (d) the single CNT.

The unique morphology of B-CNT/TA-GF is associated with its large reaction area. The surface areas of untreated GF, A-GF, TA-GF and B-CNT/TA-GF are 0.13 m2 g−1, 0.45 m2 g−1, 0.48 m2 g−1 and 2.40 m2 g−1, respectively. Hence, B-CNT/TA-GF has not only more active sites on its surface but also a large surface area. Fig. 3 shows the XRD patterns of untreated GF, A-GF, TA-GF and B-CNT/TA-GF. All samples yield characteristic diffraction peaks of graphitic planes of (002) and (100) at about 25° and 44°, respectively. The peaks of the (002) planes of A-GF, TA-GF and B-CNT/TA-GF are shifted to a slightly lower diffraction angle from those of untreated GF because the oxygen atoms bind with the carbon atoms, which form an inner layer structure during the functionalization process.44 The characteristic diffraction peak of B-CNT/TA-GF does not obviously differ from that of TA-GF, and the CNT layer of B-CNT/TA-GF is so thin that the diffraction peak of the graphite fiber overlaps that of the CNT layer.


image file: c6ra22035e-f3.tif
Fig. 3 XRD patterns of untreated GF, A-GF, TA-GF and B-CNT/TA-GF.

Fig. 4 shows the Raman spectra of untreated GF, A-GF, TA-GF and B-CNT/TA-GF, and all spectra include two strong peaks, the D-band peak and the G-band peak, at around 1350 and 1600 cm−1, respectively. The D-band peak indicates defects in the structure of the carbon material, such as caused by the presence of amorphous carbon, functional groups and defects. The G-band peak reveals that the carbon material has a graphitic structure. Therefore, the ratio of the D-band to G-band peak intensities (ID/IG) is used to evaluate the degree of graphitization of the carbon material. A-GF and TA-GF yield higher ID/IG ratios than the untreated GF, which is attributed to the formation of functional groups, disordered carbon structures and defects by the functionalization process. B-CNT/TA-GF has the lowest ID/IG ratio of all, due in part to the highly crystalline carbon structure of the CNTs.


image file: c6ra22035e-f4.tif
Fig. 4 Raman spectra of untreated GF, A-GF, TA-GF and B-CNT/TA-GF.

Fig. 5 shows the XPS O1s spectra of untreated GF, A-GF, TA-GF and B-CNT/TA-GF. The O1s peaks correspond to C[double bond, length as m-dash]O, C–O and H–O–H functional groups at approximately 531.1, 532.7 and 534.2 respectively, as reported in the literature.17 The XPS peaks are fitted using a sufficient number of Gaussian–Lorentzian curves. Fig. 5 plots the fitted curves, and Table 1 presents the corresponding fitted chemical composition. From the untreated GF through A-GF and TA-GF, the percentage of C[double bond, length as m-dash]O binding shows a decrement but the percentage of C–O binding presents an increment, indicating that C[double bond, length as m-dash]O bonds are converted to C–O bonds by the functionalization process. Kim et al. treated carbon felt electrodes by mild oxidation, plasma treatment, and gamma-ray irradiation. They found that the ratio between different surface functional groups was affected by the method of treatment. When the ratio of C–O bonding to C[double bond, length as m-dash]O bonding is 1 to 1.2, the efficiency of the VRFB is enhanced. Notably, the oxygen functional groups promoted the redox reactions of vanadium ions since they provided more reaction sites, increasing the efficiency of the VRFB. Sun and Skyllas-Kazacos performed a series of studies of the effect of acid treatment and thermal treatment on carbon felt for use in a VRFB; they found that the electron transfer step was facilitated by the formation of C–O–V intermediates, which increased the reaction rate.45 In order to understand the content of nitrogen in B-CNT/TA-GF, Fig. S3a (ESI) shows the wide-scan XPS patterns of untreated GF and B-CNT/TA-GF, while Fig. S3b (ESI) shows the evidence of B-CNT/TA-GF containing nitrogen. Based on the element analysis, the nitrogen atomic percent of B-CNT/TA-GF is about 4.3%.


image file: c6ra22035e-f5.tif
Fig. 5 XPS O1s spectra of (a) untreated GF, (b) A-GF, (c) TA-GF, and (d) B-CNT/TA-GF.
Table 1 The fitting results of XPS O1s spectra from Fig. 5
Sample C[double bond, length as m-dash]O C–O H–O–H
Untreated GF 63.3% 36.6% 0
A-GF 57.6% 42.3% 0
TA-GF 43.3% 44.9% 11.6%
B-CNT/TA-GF 39.2% 48.8% 11.8%


CV measurements are used to analyse the electrochemical activity of various samples, as shown in Fig. 6, which plots CV curves of untreated GF, A-GF, TA-GF and B-CNT/TA-GF at 5 mV s−1 in the potential range from 0.56 V to 1.46 V vs. NHE. Table 2 summarizes the peak potentials (Epa and Epc), peak current densities (Ipa and Ipc), ratio of the redox peak currents (Ipa/Ipc), and separation of the redox potentials (ΔEp) of all samples. The CV scan of the untreated GF has no significant redox peak. After acid activation, A-GF has an Epa and Epc of 1.268 V and 0.836 V, respectively, a very low Ipa and Ipc, and a ΔEp of 0.432 V. After thermal oxidation, TA-GF has an Epa and Epc of 1.127 V and 0.930 V, respectively, an Ipa and Ipc that are double those of A-GF and an Ipa/Ipc ratio of 0.8, indicating highly reversible activity. The ΔEp of TA-GF is 0.197 V which is much less than that of A-GF, indicating that the electrochemical activity of TA-GF is significantly improved by acid activation and thermal oxidation. When CNTs are directly grown on TA-GF to form B-CNT/TA-GF, the latter exhibits excellent reversible activity, with a ΔEp of only 0.181 V. The Ipa and Ipc of B-CNT/TA-GF are almost two and four times those of TA-GF and A-GF, respectively, and its Ipa/Ipc is close to one, revealing that B-CNT/TA-GF has outstanding reversibility and very high activity. According to the BET surface areas and the anodic peak current density of all samples, Fig. S4 (ESI) shows the relationship between these two parameters, indicating that the large surface area of the sample provides high peak current density.


image file: c6ra22035e-f6.tif
Fig. 6 CV curves of untreated GF, A-GF, TA-GF, and B-CNT/TA-GF recorded at 5 mV s−1 in 5 mM V2SO4/2 M H2SO4 solution.
Table 2 Some electrochemical information from CV curves of Fig. 6
  Anodic peak Cathodic peak Ipa/Ipc ΔEp (V)
Ipa (mA) Epa (V) Ipc (mA) Epc (V)
Untreated GF
A-GF 2.339 1.268 3.173 0.836 0.737 0.432
TA-GF 5.131 1.261 5.605 0.930 0.915 0.331
B-CNT/TA-GF 12.717 1.120 11.927 0.939 1.066 0.181


Fig. 7a–c show CV curves of A-GF, TA-GF and B-CNT/TA-GF, respectively. The peak current density vs. square root of potential scan rate of each sample, called the Randles–Sevcik plot, is shown in Fig. 7d, which show a semi-infinite diffusion-controlled electrochemical behavior of VO2+/VO2+ redox reaction. B-CNT/TA-GF shows sharper slope than other samples, indicating that the former can perform with better electrochemical efficiency in the VO2+/VO2+ redox reaction than the latter.


image file: c6ra22035e-f7.tif
Fig. 7 CV measurement results of (a) A-GF, (b) TA-GF and (c) B-CNT/TA-GF in various potential sweeps from 5 to 20 mV s−1; (d) Randles–Sevcik plots for A-GF, TA-GF and B-CNT/TA-GF. All experiments were performed in 5 mM V2SO4/2 M H2SO4 solution.

In full cell tests, VFRBs using untreated GF, A-GF, TA-GF and B-CNT/TA-GF as the positive and negative electrodes are evaluated at a charge–discharge current density of 40 mA cm−2 between 1.7 and 0.7 V. Eqn (4)–(6) yield the coulombic efficiency (ηc), voltage efficiency (ηv), and energy efficiency (ηe), respectively.

 
image file: c6ra22035e-t1.tif(4)
 
image file: c6ra22035e-t2.tif(5)
 
image file: c6ra22035e-t3.tif(6)
where td and td0 are the discharge times at time t and zero, respectively: and tc and tc0 are the charging times at time t and zero, respectively. Fig. 8 plots the charge–discharge curves of untreated GF, A-GF, TA-GF and B-CNT/TA-GF. The capacity of the VRFB with B-CNT/TA-GF is about 938 mA h and those of TA-GF, A-GF, and untreated GF are 820 mA h, 687 mA h, and 454 mA h, respectively. B-CNT/TA-GF provides a higher battery capacity than the other materials. An increase in the number of active sites on the electrode is responsible for the increase in the capacity of the battery. After they are fully charged to 1.7 V, all samples exhibit potential drops (iR-drops) with sudden discharge. The iR-drop is attributed to the internal resistance of the cell28 and the overpotential of electrode activation.46 The iR-drops of B-CNT/TA-GF, TA-GF, A-GF, and untreated GF are 0.24 V, 0.27 V, 0.28 V, and 0.30 V, respectively, indicating that B-CNT/TA-GF has a lower internal resistance and a higher electrochemical activity than the other materials. Table 3 shows the ηc, ηv, and ηe of each sample; B-CNT/TA-GF has better ηc, ηv, and ηe values than the other samples. In order to further investigate the effect of the embedded Co nanoparticles of CNTs, as-prepared B-CNT/TA-GF was washed with H2SO4 solution several times and then cleaned with de-ionized water. The results, shown in the ESI, indicate that the embedded Co nanoparticles in CNT can slightly increase the performance of B-CNT/TA-GF.


image file: c6ra22035e-f8.tif
Fig. 8 Charge–discharge curves of untreated GF, A-GF, TA-GF and B-CNT/TA-GF. The charge–discharge curves of VRFBs are tested at a current density of 40 mA cm−2 on a 25 cm2 single cell.
Table 3 The efficiencies of all samples recorded at a current density of 40 mA cm−2 in a 25 cm2 single cell
Sample Coulombic efficiency Voltage efficiency Energy efficiency
Untreated GF 89.8% 76.1% 68.3%
A-GF 94.8% 81.7% 77.5%
TA-GF 93.8% 81.1% 76.1%
B-CNT/TA-GF 95.0% 85.3% 81.0%


To evaluate the stabilities of VRFBs using untreated GF, A-GF, TA-GF and B-CNT/TA-GF, Fig. 9a–c plot the changes in the coulombic efficiency, the voltage efficiency and the energy efficiency, respectively, versus the charge–discharge cycles for all samples at a constant charge–discharge current density of 40 mA cm−2. B-CNT/TA-GF still retains good electrode performance after 70 cycles. Fig. 9d shows the rate performances of various samples with current density increasing from 50 to 80 mA cm−2 and then sharply dropping to 50 mA cm−2 in the last step. The energy efficiency of untreated-GF dropped along with the increase of the current density from 67.1% to 59.1% at 50 mA cm−2 and 80 mA cm−2, respectively. On the other hand, the energy efficiencies of B-CNT/TA-GF are 80.3% and 76.8% at 50 mA cm−2 and 80 mA cm−2, respectively, indicating its excellent performance at a high current density, which corresponds to an enhancement of electrochemical kinetic activity.47


image file: c6ra22035e-f9.tif
Fig. 9 The efficiencies of VRFBs using untreated GF, A-GF, TA-GF and B-CNT/TA-GF in the cycle-lifetime tests at a constant charge–discharge current density of 40 mA cm−2: (a) the coulombic efficiency, (b) the voltage efficiency, (c) the energy efficiency, and (d) the rate performance of energy efficiency with increasing charge–discharge current rate from 50 to 80 mA cm−2.

The observed improvement of electrochemical activity is explained as follows. Large surface areas and many oxygen functional groups promote electrochemical activity. A-GF and TA-GF have similar surface areas, so the oxygen functional groups of C[double bond, length as m-dash]O and C–O are directly related to the electrochemical activity. Most relevant investigations have concluded that the oxygen functional groups provide reaction active sites for the vanadium redox reaction, in which either C–O or C[double bond, length as m-dash]O provides oxygen for the oxidation of VO2+/VO2+.9,21–23 Furthermore, the wettability of the electrode surface is correlated with the amount of oxygen functional groups.36,48,49 When the CNTs were grown directly on TA-GF, B-CNT/TA-GF was obtained, and exhibited much greater electrochemical behaviour than TA-GF and A-GF. The TEM image shows that the graphene sheet of B-CNT is chemically bonded with the graphite felt, indicating that the interfacial resistance between the B-CNT and the graphite felt is very small. The large specific surface area of B-CNT favors its reaction with vanadium ions. The Raman spectra indicate that B-CNT/TA-GF had the lowest ID/IG ratio. Melke et al. used NEXAFS analysis to reveal that the sp2 carbon content on the surface significantly affected the activity of electrochemical redox reaction of vanadium ion.50 Therefore, the high sp2 carbon content of B-CNT/TA-GF favors electron transportation, reducing the iR drop in the charge–discharge curves. The incorporation of nitrogen atoms in B-CNTs forms dislocations, disruptions and an irregular curvature of the graphene stacking in the sidewalls,51 causing more highly active edge planes to be exposed, promoting the redox reaction of vanadium ions.

4. Conclusion

This paper studies the modification of graphite felt by two-step acid activation and thermal oxidation. Bamboo-like CNTs are grown directly on this modified graphite felt. CV scans revealed that B-CNT/TA-GF is more highly reversible and electrochemically active than the other samples. The VRFB with B-CNT/TA-GF electrodes has a low iR drop, high efficiency, and large capacity. The outstanding performance of B-CNT/TA-GF may be attributed to its large surface area, many oxygen functional groups, low internal resistance, favorable sp2 carbon content, and nitrogen dopants on the CNT surface, which make it an efficient electrode for use in a VRFB.

Acknowledgements

The authors would like to thank the Institute of Nuclear Energy Research, Atomic Energy Council for supporting this research. Also, the authors deeply appreciate Prof. Li-Chyong Chen of National Taiwan University and Prof. Kuei-Hsien Chen of Academia Sinica for their great help. Technical support from the Core facilities for nanoscience and nanotechnology at Academia Sinica in Taiwan is acknowledged. Ted Knoy is appreciated for his editorial assistance.

Notes and references

  1. N. Y. Amponsah, M. Troldborg, B. Kington, I. Aalders and R. L. Hough, Renewable Sustainable Energy Rev., 2014, 39, 461–475 CrossRef CAS.
  2. H. Chen, T. N. Cong, W. Yang, C. Tan, Y. Li and Y. Ding, Prog. Nat. Sci., 2009, 19, 291–312 CrossRef CAS.
  3. B. Dunn, H. Kamath and J.-M. Tarascon, Science, 2011, 334, 928–935 CrossRef CAS PubMed.
  4. A. Z. Weber, M. M. Mench, J. P. Meyers, P. N. Ross, J. T. Gostick and Q. Liu, J. Appl. Electrochem., 2011, 41, 1137–1164 CrossRef CAS.
  5. J.-N. Zheng, S.-S. Li, X. Ma, F.-Y. Chen, A.-J. Wang, J.-R. Chen and J.-J. Feng, J. Power Sources, 2014, 262, 270–278 CrossRef CAS.
  6. E. D. Stoutenburg, N. Jenkins and M. Z. Jacobson, Renewable Energy, 2010, 35, 2781–2791 CrossRef.
  7. E. Sum, M. Rychcik and M. Skyllas-kazacos, J. Power Sources, 1985, 16, 85–95 CrossRef CAS.
  8. M. Skyllas-Kazacos, in Encyclopedia of Electrochemical Power Sources, ed. J. Garche, Elsevier, Amsterdam, 2009, pp. 444–453,  DOI:10.1016/b978-044452745-5.00177-5.
  9. W. Zhang, J. Xi, Z. Li, H. Zhou, L. Liu, Z. Wu and X. Qiu, Electrochim. Acta, 2013, 89, 429–435 CrossRef CAS.
  10. W.-C. Fang, C.-L. Sun, J.-H. Huang, L.-C. Chen, O. Chyan, K.-H. Chen and P. Papakonstantinou, Electrochem. Solid-State Lett., 2006, 9, A175–A178 CrossRef CAS.
  11. M. Park, Y.-J. Jung, J. Kim, H. I. Lee and J. Cho, Nano Lett., 2013, 13, 4833–4839 CrossRef CAS PubMed.
  12. G. J. W. Radford, J. Cox, R. G. A. Wills and F. C. Walsh, J. Power Sources, 2008, 185, 1499–1504 CrossRef CAS.
  13. L. Yue, W. Li, F. Sun, L. Zhao and L. Xing, Carbon, 2010, 48, 3079–3090 CrossRef CAS.
  14. C. Flox, C. Fabrega, T. Andreu, A. Morata, M. Skoumal, J. Rubio-Garcia and J. R. Morante, RSC Adv., 2013, 3, 12056–12059 RSC.
  15. Z. Gonzalez, S. Vizireanu, G. Dinescu, C. Blanco and R. Santamaria, Nano Energy, 2012, 1, 833–839 CrossRef CAS.
  16. W. Y. Li, J. G. Liu and C. W. Yan, Carbon, 2011, 49, 3463–3470 CrossRef CAS.
  17. C. Gao, N. Wang, S. Peng, S. Liu, Y. Lei, X. Liang, S. Zeng and H. Zi, Electrochim. Acta, 2013, 88, 193–202 CrossRef CAS.
  18. H.-M. Tsai, S.-Y. Yang, C.-C. M. Ma and X. Xie, Electroanalysis, 2011, 23, 2139–2143 CrossRef CAS.
  19. G. Wei, J. Liu, H. Zhao and C. Yan, J. Power Sources, 2013, 241, 709–717 CrossRef CAS.
  20. Y. Shao, X. Wang, M. Engelhard, C. Wang, S. Dai, J. Liu, Z. Yang and Y. Lin, J. Power Sources, 2010, 195, 4375–4379 CrossRef CAS.
  21. C. Flox, J. Rubio-García, M. Skoumal, T. Andreu and J. R. Morante, Carbon, 2013, 60, 280–288 CrossRef CAS.
  22. S. Zhong, C. Padeste, M. Kazacos and M. Skyllas-Kazacos, J. Power Sources, 1993, 45, 29–41 CrossRef CAS.
  23. W. Li, J. Liu and C. Yan, Carbon, 2013, 55, 313–320 CrossRef CAS.
  24. K. Gong, F. Du, Z. Xia, M. Durstock and L. Dai, Science, 2009, 323, 760–764 CrossRef CAS PubMed.
  25. C. H. Wang, C. C. Chen, H. C. Hsu, H. Y. Du, C. P. Chen, J. Y. Hwang, L. C. Chen, H. C. Shih, J. Stejskal and K. H. Chen, J. Power Sources, 2009, 190, 279–284 CrossRef CAS.
  26. A. L. M. Reddy, A. Srivastava, S. R. Gowda, H. Gullapalli, M. Dubey and P. M. Ajayan, ACS Nano, 2010, 4, 6337–6342 CrossRef CAS PubMed.
  27. Y. Wang, Y. Shao, D. W. Matson, J. Li and Y. Lin, ACS Nano, 2010, 4, 1790–1798 CrossRef CAS PubMed.
  28. W. H. Wang and X. D. Wang, Electrochim. Acta, 2007, 52, 6755–6762 CrossRef CAS.
  29. B. Li, M. Gu, Z. Nie, Y. Shao, Q. Luo, X. Wei, X. Li, J. Xiao, C. Wang, V. Sprenkle and W. Wang, Nano Lett., 2013, 13, 1330–1335 CrossRef CAS PubMed.
  30. H. Zhou, J. Xi, Z. Li, Z. Zhang, L. Yu, L. Liu, X. Qiu and L. Chen, RSC Adv., 2014, 4, 61912–61918 RSC.
  31. H. Zhou, Y. Shen, J. Xi, X. Qiu and L. Chen, ACS Appl. Mater. Interfaces, 2016, 8, 15369–15378 CAS.
  32. X. Wu, H. Xu, L. Lu, H. Zhao, J. Fu, Y. Shen, P. Xu and Y. Dong, J. Power Sources, 2014, 250, 274–278 CrossRef CAS.
  33. L. Wu, Y. Shen, L. Yu, J. Xi and X. Qiu, Nano Energy, 2016, 28, 19–28 CrossRef CAS.
  34. A. Shmeliov, M. Shannon, P. Wang, J. S. Kim, E. Okunishi, P. D. Nellist, K. Dolui, S. Sanvito and V. Nicolosi, ACS Nano, 2014, 8, 3690–3699 CrossRef CAS PubMed.
  35. D. M. Kabtamu, J.-Y. Chen, Y.-C. Chang and C.-H. Wang, J. Mater. Chem. A, 2016, 4, 11472–11480 CAS.
  36. T.-M. Tseng, R.-H. Huang, C.-Y. Huang, C.-C. Liu, K.-L. Hsueh and F.-S. Shieu, J. Electrochem. Soc., 2014, 161, A1132–A1138 CrossRef CAS.
  37. S. Wang, X. Zhao, T. Cochell and A. Manthiram, J. Phys. Chem. Lett., 2012, 3, 2164–2167 CrossRef CAS PubMed.
  38. Z. González, P. Álvarez, C. Blanco, S. Vega-Díaz, F. Tristán-López, L. P. Rajukumar, R. Cruz-Silva, A. L. Elas, M. Terrones and R. Menndez, Sustainable Energy Technologies and Assessments, 2015, 9, 105–110 CrossRef.
  39. C. H. Wang, H. Y. Du, Y. T. Tsai, C. P. Chen, C. J. Huang, L. C. Chen, K. H. Chen and H. C. Shih, J. Power Sources, 2007, 171, 55–62 CrossRef CAS.
  40. L. C. Chen, C. Y. Wen, C. H. Liang, W. K. Hong, K. J. Chen, H. C. Cheng, C. S. Shen, C. T. Wu and K. H. Chen, Adv. Funct. Mater., 2002, 12, 687–692 CrossRef CAS.
  41. C.-H. Wang, H.-C. Shih, Y.-T. Tsai, H.-Y. Du, L.-C. Chen and K.-H. Chen, Electrochim. Acta, 2006, 52, 1612–1617 CrossRef CAS.
  42. R. M. Yadav, P. S. Dobal, T. Shripathi, R. S. Katiyar and O. N. Srivastava, Nanoscale Res. Lett., 2009, 4, 197–203 CrossRef CAS PubMed.
  43. Y. Li, W. Zhou, H. Wang, L. Xie, Y. Liang, F. Wei, J.-C. Idrobo, S. J. Pennycook and H. Dai, Nat. Nanotechnol., 2012, 7, 394–400 CrossRef CAS PubMed.
  44. H. C. Schniepp, J.-L. Li, M. J. McAllister, H. Sai, M. Herrera-Alonso, D. H. Adamson, R. K. Prud'homme, R. Car, D. A. Saville and I. A. Aksay, J. Phys. Chem. B, 2006, 110, 8535–8539 CrossRef CAS PubMed.
  45. B. Sun and M. Skyllas-Kazacos, Electrochim. Acta, 1992, 37, 2459–2465 CrossRef CAS.
  46. R.-H. Huang, C.-H. Sun, T.-M. Tseng, W.-K. Chao, K.-L. Hsueh and F.-S. Shieua, J. Electrochem. Soc., 2012, 159, A1579–A1586 CrossRef CAS.
  47. S. Park and H. Kim, J. Mater. Chem. A, 2015, 3, 12276–12283 CAS.
  48. Z. He, L. Shi, J. Shen, Z. He and S. Liu, Int. J. Energy Res., 2015, 39, 709–716 CrossRef CAS.
  49. Y. Xie, Z. Cheng, B. Guo, Y. Qiu, H. Fan, S. Sun, T. Wu, L. Jin and L. Fan, Ionics, 2014, 21, 283–287 CrossRef.
  50. J. Melke, P. Jakes, J. Langner, L. Riekehr, U. Kunz, Z. Zhao-Karger, A. Nefedov, H. Sezen, C. Woll, H. Ehrenberg and C. Roth, Carbon, 2014, 78, 220–230 CrossRef CAS.
  51. V. V. Strelko, V. S. Kuts and P. A. Thrower, Carbon, 2000, 38, 1499–1503 CrossRef CAS.

Footnote

Electronic supplementary information (ESI) available. See DOI: 10.1039/c6ra22035e

This journal is © The Royal Society of Chemistry 2016