Photodegradation behavior and mechanism of poly(ethylene glycol-co-1,4-cyclohexanedimethanol terephthalate) (PETG) random copolymers: correlation with copolymer composition

Tingting Chenab, Jun Zhang*ab and Hongjun Youa
aCollege of Materials Science and Engineering, Nanjing Tech University, Nanjing, 210009, People's Republic of China. E-mail: zhangjun@njtech.edu.cn; Fax: +86-25-83240205; Tel: +86-25-83587264
bJiangsu Collaborative Innovation Center for Advanced Inorganic Function Composites, Nanjing 210009, People's Republic of China

Received 2nd September 2016 , Accepted 24th October 2016

First published on 24th October 2016


Abstract

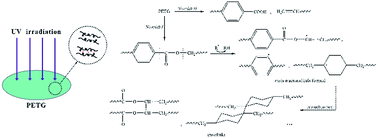
The effect of copolymer composition on the photodegradation behavior and the mechanism of poly(ethylene glycol-co-1,4-cyclohexanedimethanol terephthalate) (PETG) random copolymers with different 1,4-cyclohexanedimethanol (CHDM) content were first investigated. The changes in surface chemical groups of the PETG copolymers after UV irradiation were characterized by X-ray photoelectron spectroscopy (XPS) and attenuated total reflectance Fourier transform-infrared (ATR-FTIR) spectroscopy. Differential scanning calorimetry (DSC) and thermogravimetric analysis (TGA) were used to probe the thermal properties of the PETG copolymers before and after UV irradiation. The crosslinking degree of the PETG copolymers after UV irradiation was evaluated by gel content measurement. The photooxidation rate of the PETG copolymers increased with increasing CHDM content. Namely, the inherent photostability of the PETG copolymers decreased with increasing CHDM content. The PETG copolymers with different compositions exhibited the similar photooxidation mechanism. The presence of CHDM in the PETG molecular chains accelerated the formation of photoproducts. The photoproducts of the PETG copolymers were consisted of aliphatic alcohol, anhydride, benzoic acid, double bond and aliphatic acid as end-groups and molecular terephthalic acid. Moreover, the crosslinking products formed during UV irradiation were not further oxidized in the whole irradiation period (0–800 h). The glass transition temperatures (Tgs) of the PETG copolymers after UV irradiation increased due to the irradiation crosslinking. The increment of Tg increased gradually with increasing CHDM content. Therefore, the higher the CHDM content was, the higher the crosslinking degree obtained.

1. Introduction

The use of semicrystalline poly(ethylene terephthalate) (PET) has greatly increased because of its widespread application in the packaging of food and drinks, due to its excellent thermal and mechanical properties, high chemical resistance and low gas permeability.1,2 However, the tendency of PET to crystallize will decrease its transparency and severely limit the use of this polymer to some fields, in which transparent property is required. To avoid such a crystallization that limits its use, a glycol-modified PET copolymer has been synthesized. Poly(ethylene glycol-co-1,4-cyclohexanedimethanol terephthalate) (PETG) is prepared by partially replacing the ethylene glycol (EG) groups of PET with 1,4-cyclohexanedimethanol (CHDM) groups.3 The crystallization rate of the prepared PETG copolymer is decreased, which accounts for the decrease in the molecular regularity.4 The PETG copolymer is essentially amorphous when the CHDM content is in the range of 32–62%.5 Mechanical properties of the PETG copolymer are close to those of PET.

PETG copolymer has noticeable tensile toughness, transparency, flexibility, high processability, and excellent chemical resistance.6 It can be used for many applications such as transparent decoration part, appliances, water or food storage, medical, automobile, various films and sheets without worries of bisphenol-A.7 Moreover, PETG copolymer also has good impact and tear strength, excellent resistance to stress and bend whitening, and excellent gas barrier properties. These unique properties should make PETG copolymer an outstanding choice for food packaging.8

PETG copolymer is widely used outdoors where toughness and transparency are important, e.g., as street lamp covers, vandal-resistant glazing and transparencies.5,9 Many applications of PETG copolymer, such as packaging materials and garden equipment, require a degree of outdoor stability. Polymers show different inherent photostabilities when they are used as materials. Depending on their resistance to photodegradation, polymers can be divided into groups showing different degrees of stability. Highly photostable polymers are commonly used without any photostabilizer and have an outdoor life of many years. Moderately photostable polymers can be used outdoors without any photostabilizer and have an outdoor life of a few years. Poorly photostable polymers need extensive photostabilization for outdoor use and have an outdoor life of less than a year when compounded without any photostabilizer.10 PET is a moderately photostable polymer. The PET degradation chemistry provoked by light exposure has been studied, and the mechanisms have been reported in the literature.11 On the other hand, few studies on the inherent photostability of PETG copolymer have appeared up to now. T. Grossetête et al. studied the photolysis and the photooxidation of PETG copolymer with a given CHDM content under vacuum irradiation and in the presence of oxygen.12 N. S. Allen et al. investigated on the characterization and identification of fluorescent hydroxylated terephthalate species in the thermal and UV degradation of PETG.13 Therefore, it is of great importance to further investigate the inherent photostability of PETG copolymers.

In our previous work,3,14 PET and a series of PETG random copolymers with different compositions were synthesized and their alkali resistance was systematically investigated. The alkali resistance of the PETG copolymers was enhanced with increasing CHDM content. How will the increasing CHDM content affect the photostability of the PETG copolymers? A well justified study regarding the relationship between photostability and copolymer composition of the PETG copolymers appears to be necessary. In this work, the effect of copolymer composition on the photodegradation behavior and mechanism of the PET homopolymer and PETG random copolymers was systematically studied. The surface chemical groups and thermal properties changes of the irradiated samples were characterized by attenuated total reflectance Fourier transform-infrared (ATR-FTIR) spectroscopy, X-ray photoelectron spectroscopy (XPS), differential scanning calorimetry (DSC) and thermogravimetric analysis (TGA). The crosslinking degree of the samples after UV irradiation was evaluated by gel content measurement. The effect of irradiation time on the photodegradation behavior was also examined.

2. Experimental

2.1. Materials

A series of PETG random copolymers with different compositions were synthesized from terephthalic acid (TPA), EG and CHDM in our laboratory. The PET homopolymer was also synthesized from TPA and EG. The synthesis details for the PETG copolymers were described in our previous paper.3 Their chemical compositions were determined by 1H nuclear magnetic resonance (NMR) spectroscopy. Their number-average molecular weights were determined by the chain-end estimation method using 1H NMR.15 The corresponding results were summarized in Table 1.3 The PETG random copolymers consist of ethylene glycol terephthalate (ET) and 1,4-cyclohexanedimethanol terephthalate (CT) units.14 The chemical structural units of the PETG copolymers are shown in Scheme 1.16
Table 1 Feed compositions, chemical compositions and number-average molecular weights of the PET homopolymer and PETG copolymers
Sample codes Feed compositiona Chemical compositionb [M with combining macron]nb (g mol−1)
EG CHDM EG CHDM
a Molar ratio of EG and CHDM monomers fed in the polymerization.b Measured by 1H NMR spectroscopy.
PET 100 0 100 0 1.4 × 10⁴
PETG(85/15) 85 15 84.4 15.6 1.6 × 10⁴
PETG(70/30) 70 30 70.9 29.1 1.4 × 10⁴
PETG(50/50) 50 50 51.6 48.4 1.3 × 10⁴
PETG(30/70) 30 70 31.6 68.4 1.2 × 10⁴


image file: c6ra21985c-s1.tif
Scheme 1 Chemical structural units of the PETG copolymers.

The solvents phenol, 1,1,2,2-tetrachloroethane (Lingfeng Chemical Reagent Co., Ltd., China) and ethanol (Yasheng Chemical Co., Ltd., China) were of analytical reagent grade and used without further purification. Qualitative filter paper with particle retention size ≈ 20 μm was obtained from Hangzhou Special Paper Industry Co., Ltd., China.

2.2. Sample preparation and accelerated artificial weathering

The synthesized PET homopolymer and PETG copolymers were compression molded into films with 0.4 mm thickness from the molten state. Poly(tetrafluoroethylene) (PTFE) films were used as the mold release film in the compression molding process. To get amorphous polymers as far as possible, films were immediately quenched in iced water.

Accelerated artificial weathering of all samples was conducted in an accelerated weathering chamber (Q-Lab UVA/se, USA). UV exposure was made with 340 nm wavelength UVA light. All samples were irradiated at 0.51 W m−2 with the blackboard temperature of 65 °C. Each sample was irradiated for 200, 400, 600 and 800 h.

2.3. Differential scanning calorimetry (DSC) measurements

A differential scanning calorimeter (TA Q2000, America) was used to investigate the thermal properties of the PET homopolymer and PETG copolymers before and after UV irradiation. Temperature and heat flow were calibrated using a high purity indium standard sample (156.6 °C and 28.45 J g−1). Samples were weighted about 10 mg, sealed into an aluminum pan. All the samples were heated from 40 °C to 300 °C at 10 °C min−1 under a dry nitrogen atmosphere. The first melting trace was recorded. The crystallinity (Xc) was calculated using the following eqn (1):17
 
image file: c6ra21985c-t1.tif(1)
where ΔHm is the melting enthalpy, while ΔHcc is the cold crystallization enthalpy, and image file: c6ra21985c-t2.tif is the melting enthalpy of 100% crystalline PET. The value of image file: c6ra21985c-t3.tif was calculated as 130 J g−1.18 Xc was the crystallinity which obtained by the sample crystallized during the sample preparation and UV irradiation process (not including the DSC measurement process).

2.4. Gel content measurements

To evaluate the crosslinking degree for the samples after UV irradiation, gel content was measured by the weight remaining after dissolving the sample in mixed phenol and 1,1,2,2-tetrachloroethane solvent (1/1, w/w) using the following eqn (2):19
 
Gel content (%) = (Wg/Wo) × 100 (2)
where Wo is the original weight (dry) of the sample, Wg is the weight remaining (dry gel component) of the sample after being dissolved in mixed phenol and 1,1,2,2-tetrachloroethane solvent at room temperature for 48 h.

2.5. Fourier transform infrared spectroscopy (FTIR) measurements

The surface chemical groups were evaluated using a FTIR spectrometer (Thermo Fisher Nicolet IS50, America). An attenuated total reflectance (ATR) accessory with a ruby crystal was utilized to measure the FTIR spectra. The ATR-FTIR spectra of the samples and gel were scanned from 4000 to 600 cm−1 with a resolution of 4 cm−1. The index of carboxyl end-groups was determined as the area of the peaks at 2666 and 2554 cm−1 (assigned to the O–H vibration of the COOH group) and the reference peak for normalizing (taken at 1505 cm−1). The carboxyl index was calculated by the following eqn (3):
 
Carboxyl index = A2700–2400/A1520–1490 (3)
where A2700–2400 and A1520–1490 are the integrated areas of carboxyl end-groups (2700–2400 cm−1) and the ring C–H in-plane bending peak (1520–1490 cm−1), respectively.

2.6. XPS measurements

The surface chemical compositions of the samples before and after UV irradiation were analyzed by an X-ray photoelectron spectrometer (Thermo Scientific ESCALAB 250 Xi, USA) equipped with a monochromatic Al Kα (1486.6 eV) X-ray source. The pass energy for survey spectra was 150 eV with 1 eV step size and for high resolution C1s spectra 20 eV with 0.1 eV step size. The base pressure in the main chamber during analyses was not higher than 10−10 mbar and the analysis area was approximately 500 μm × 500 μm. The spectra were acquired at a take-off angle of 90° relatively to the samples surface. The binding energy scale was calibrated by setting the main component of the C1s peak (C–C/C–H carbon type bonds) at 284.8 eV.

2.7. Thermogravimetric analysis (TGA) measurements

The thermal stability of the samples before and after UV irradiation was studied by TGA. The thermal degradation process was recorded using a TGA thermal analyzer (TA Q500, USA). For each experiment, about 20 mg of the sample was used and a nitrogen flow rate of 50 mL min−1 was adopted. The samples were heated from 40 to 800 °C at a rate of 20 °C min−1.

3. Results and discussion

3.1. DSC analysis

The DSC melting traces of the PET homopolymer and PETG copolymers after UV irradiation for different times are depicted in Fig. 1. The detailed data, glass transition temperature (Tg), melting temperature (Tm), cold crystallization and melting enthalpies (ΔHcc and ΔHm), and crystallinity (Xc) are listed in Table 2. As for the unirradiated samples, a cold crystallization peak and a melting peak are observed in PET, PETG(85/15) and PETG(30/70). The cold crystallization peak is ascribed to the crystallization of the unirradiated samples during the DSC measurement process. The melting peak is attributed to the crystals formed from the crystallization that occurred during the sample preparation process and DSC measurement process.14 However, neither the cold crystallization peak nor the melting peak is found in PETG(70/30) and PETG(50/50), which suggests that these two copolymers are completely amorphous.
image file: c6ra21985c-f1.tif
Fig. 1 DSC melting traces of the PET homopolymer and PETG copolymers after UV irradiation for different times.
Table 2 Thermal properties of the PET homopolymer and PETG copolymers after UV irradiation for different timesa
Samples UV irradiation time (h) Tg (°C) ΔHcc (J g−1) Tm (°C) ΔHm (J g−1) Xc (%)
a Tg: glass transition temperature, ΔHcc: cold crystallization enthalpy, Tm: melting temperature, ΔHm: melting enthalpy, Xc: crystallinity measured in the first heating scan calculated by eqn (1).b Not detected.
PET(100/0) 0 68.0 36.5 241.1 43.2 5
200 69.4 37.7 239.8 44.6 5
400 70.1 38.4 239.6 43.7 4
600 69.9 36.2 240.1 42.1 5
800 70.6 36.35 239.4 42.0 4
PETG(85/15) 0 70.6 12.5 207.9 16.4 3
200 72.4 5.3 204.6 9.6 3
400 72.2 4.8 205.1 9.1 3
600 72.2 1.2 206.8 4.0 2
800 72.2 4.0 206.2 6.6 2
PETG(70/30) 0 73.4 b
200 78.3
400 78.3
600 77.8
800 77.4
PETG(50/50) 0 73.5
200 79.5
400 80.1
600 79.9
800 79.9
PETG(30/70) 0 75.7 23.1 239.4 28.0 4
200 85.9 17.9 233.2 23.5 4
400 86.6 16.8 232.2 22.4 4
600 86.6 15.9 231.7 21.9 5
800 86.3 13.7 229.5 19.5 4


After UV irradiation for different times, either the cold crystallization peak or the melting peak is not observed in PETG(70/30) and PETG(50/50). This result indicates that PETG(70/30) and PETG(50/50) after UV irradiation are amorphous as before. Moreover, the cold crystallization peak is still observed in PET, PETG(85/15) and PETG(30/70) after UV irradiation. And the crystallinities of these samples before and after UV irradiation are almost invariant as shown in Table 2. These results reveal that all the samples could not crystallize during the UV irradiation process, which is due to the irradiation temperature (the blackboard temperature: 65 °C) below their glass transition temperatures.

As shown in Table 2, the Tgs of the samples increase after UV irradiation. With further increasing the irradiation time, the Tgs of the irradiated samples are essentially unchanged. The increments of Tgs for PETG(85/15), PETG(70/30), PETG(50/50) and PETG(30/70) after UV irradiation are about 1.8, 4.9, 6.4 and 10.9 °C, respectively. Therefore, the increment of Tg for the PETG copolymers after UV irradiation increases gradually with increasing CHDM content. Moreover, the Tms of the samples decrease after UV irradiation. The Tms of the irradiated samples are essentially unchanged with further increasing the irradiation time. The increments of Tms for PET, PETG(85/15) and PETG(30/70) after UV irradiation are about 1.7, 3.3 and 9.9 °C, respectively.

3.2. Gel content analysis

The crosslinking degree for the sample after UV irradiation was evaluated through the gel content. The gel contents of the PET homopolymer and PETG copolymers after UV irradiation for different times are shown in Fig. 2. The unirradiated samples are found soluble in the mixed phenol and 1,1,2,2-tetrachloroethane solvent. No gel is observed for all the unirradiated samples. After UV irradiation for 200 h, the gel formation is observed for all the samples. This is explained by the fact that upon UV irradiation they undergo crosslinking and as a result of the network formation in the polymer.20
image file: c6ra21985c-f2.tif
Fig. 2 Gel contents of the PET homopolymer and PETG copolymers after UV irradiation for different times.

With further increasing the irradiation time, the gel content of the samples increases gradually. This implies that the samples in the early irradiation period could not give rise to the insoluble and infusible networks, due to the low crosslinking degree.21 The competitive relationship between the chain scission and crosslinking plays an important role in the gel contents of samples. Attributed to the predominant effect of the chain crosslinking, the gel content of the samples increases with increasing irradiation time.

As shown in Fig. 2, the increase in gel content for the PETG copolymers is enhanced by increasing CHDM content. CHDM has labile hydrogen atoms on the tertiary carbon. The radicals abstract preferentially the hydrogen atoms on the tertiary carbon from the polymer chains.22 The generated free radicals can recombine, leading to the formation of crosslinks.23 Therefore, the higher the CHDM content was, the higher the crosslinking degree obtained, which is in accordance with the DSC results: the increment of Tg for the PETG copolymers after UV irradiation increases gradually with increasing CHDM content (Fig. 1 and Table 2). The increase of Tg for the sample after UV irradiation is ascribed to the irradiation crosslinking.24 The increment of Tg is mainly depended on the crosslinking degree.

Moreover, the gel content for the PETG copolymers is higher than that of the PET homopolymer. Part of the reason for superior crosslinking in the PETG copolymers than the PET homopolymer is due to the existence of labile hydrogen atoms on the tertiary carbon of cyclohexane units in the PETG molecular chains. However, the gel contents of PETG(30/70) after UV irradiation for different times are essentially identical to those of PETG(50/50). The similar gel content can be attributed to the decrease of amorphous phase in PETG(30/70) compared to PETG(50/50). According to the DSC analysis, PETG(30/70) slightly crystallized in the sample preparation process and its crystallinity is about 5% (Table 2). PETG(50/50) is completely amorphous before and after UV irradiation. Patel and Keller found that the irradiation crosslinking occurs mainly within the amorphous regions of polymer.25 Therefore, under the combined effect of the CHDM content and the crystallinity, PETG(50/50) and PETG(30/70) after UV irradiation have similar crosslinking degree.

3.3. ATR-FTIR analysis

The changes in surface chemical groups of the samples after UV irradiation were evaluated by ATR-FTIR spectroscopy. Fig. 3 shows the ATR-FTIR spectra of the PET homopolymer and PETG copolymers after UV irradiation for different times. The broad feature between 3500 and 2500 cm−1 is undoubtedly due to the O–H stretching of the carboxylic acid.26 No other functional group has such a broad and intense band at high wavenumber. Two sharp bands at 2923 and 2852 cm−1, which are superimposed on the O–H stretching, are attributed to the asymmetric and symmetric C–H stretching in methylene group, respectively.26 The intense peak at 1712 cm−1 is associated with the C[double bond, length as m-dash]O stretching of ester group.27 The C–H bending peak of methylene group, C–H stretching peak of cyclohexane ring and C–H out-of-plane bending peak are observed at 1450, 956 and 793 cm−1, respectively.14,28 The bands at 1408 and 873 cm−1 are assigned to the ring C–H in-plane and out-of-plane bending, respectively.29
image file: c6ra21985c-f3.tif
Fig. 3 ATR-FTIR spectra of the PET homopolymer and PETG copolymers after UV irradiation for different times.

The photooxidation of the samples in air causes considerable changes in the ATR-FTIR spectra. New absorption bands appear with increasing irradiation time. And the increase in intensities of new bands is observed with increasing irradiation time. As shown in Fig. 3, the main changes observed in the spectra of the samples after UV irradiation are in the hydroxyl and carbonyl regions. In the hydroxyl region, the changes in the spectra of the PET homopolymer and PETG copolymers after UV irradiation are similar to each other. The appearance of the weak band around 3465 cm−1 is due to the formation of alcohols.30 Two absorption bands appear with maxima around 2666 and 2554 cm−1, which accounts for the formation of carboxylic acid.31,32 The intensities of the O–H stretching bands (3465, 2666 and 2554 cm−1) increase with increasing irradiation time. It reveals that the content of the generated alcohols and acids increases with increasing irradiation time.

In the carbonyl region, for the PETG copolymers, a broadening of the initial ester band between 1750 and 1650 cm−1 is observed at both extremities. This is attributed to the formation of anhydride (1785 cm−1), benzoic acid (1696 cm−1) as end-groups and terephthalic acid (1686 cm−1).12,33,34 In the spectra of irradiated PETG(85/15) and PETG(70/30), the bands at 1696 and 1686 cm−1 appears after UV irradiation for 600 and 800 h, respectively. While in the spectra of irradiated PETG(50/50) and PETG(30/70), the bands at 1696 and 1686 cm−1 emerges after UV irradiation for 400 and 600 h, respectively. These results suggest that the increasing CHDM content will accelerate the formation of the benzoic acid as end-groups and terephthalic acid. For the PET homopolymer, a broadening of the C[double bond, length as m-dash]O stretching band is also observed which is mainly attributed to the formation of anhydride (1785 cm−1) as end-groups. The band at 1696 cm−1 (benzoic acid as end-groups) is not observed until the PET homopolymer irradiated for 800 h. While the band at 1686 cm−1 (terephthalic acid) is not observed in the whole irradiation period (0–800 h). In combination, these results indicate that the photooxidation rate of the PETG copolymers is higher than that of the PET homopolymer. And the photooxidation rate of the PETG copolymers increases with increasing CHDM content. Namely, the inherent photostability of the PETG copolymers decreases with increasing CHDM content.

In the region 1500–700 cm−1, the peaks at 1450 cm−1 (C–H of methylene group) and 793 cm−1 (C–H of benzene ring) remain at the same wavenumber position but gradually weaken with increasing irradiation time. At a given irradiation time, the extent of weakening increases with increasing CHDM content. These results suggest that C–H of methylene group and benzene ring participates in the photooxidation process and the existence of CHDM will accelerate the photooxidation. Moreover, the new bands at 1424 and 781 cm−1 appear with increasing irradiation time, which accounts for the formation of C[double bond, length as m-dash]C and COOH, respectively.35,36 For the PETG copolymers, with increasing irradiation time, the peak at 956 cm−1 (C–H of cyclohexane ring) gradually weakens and disappears after irradiation for 600 h. Meanwhile, the new peak at 937 cm−1 emerges after disappearance of the peak at 956 cm−1. The new band at 937 cm−1 exhibits the existence of the out-of-plane O–H stretching of aliphatic carboxylic acid.26,37 This result reveals that the scission of cyclohexane ring occurs and then generates aliphatic carboxylic acids at advanced stages of photodegradation.

It is well-known that carboxyl end-groups are formed during PET photodegradation and that carboxyl index (CI) is a useful parameter to quantity the extent of PET degradation.38 According to the FTIR analysis above, carboxyl end-groups are also formed during PETG photodegradation. Moreover, carboxyl end-groups act as catalyst to promote further degradation, thus enhancing the importance this parameter. Fig. 4 shows the CI values of the PET homopolymer and PETG copolymers after UV irradiation for different times. The CI values gradually increase with increasing irradiation time, which suggests that the content of the generated carboxyl end-groups increases with increasing irradiation time. Furthermore, the CI values of the irradiated samples at a given irradiation time could be ranked as follows: PETG(30/70) > PETG(50/50) > PETG(70/30) > PETG(85/15) > PET. In other words, the CI values for the irradiated samples increase with increasing CHDM content at a given irradiation time. This result reveals that the presence of CHDM is able to promote the generation of carboxyl end-groups during UV irradiation.


image file: c6ra21985c-f4.tif
Fig. 4 Carboxyl index values of the PET homopolymer and PETG copolymers after UV irradiation for different times.

Besides, the chemical structure of the gel was observed by ATR-FTIR with the unirradiated samples being the control. Fig. 5 depicts the ATR-FTIR spectra of the gel obtained from the irradiated PET homopolymer and PETG copolymers for different times. The spectra of the gel obtained from the irradiated samples are very similar to those of the corresponding unirradiated samples. Because the absorption bands relative to the products formed during the crosslinking process could not be directly detected. Interestingly, no new bands relative to the photooxidation products are observed in the spectra of gel. This indicates that the gel (crosslinking products) formed during UV irradiation is not further oxidized in the whole irradiation period (0–800 h).


image file: c6ra21985c-f5.tif
Fig. 5 ATR-FTIR spectra of the gel obtained from the irradiated PET homopolymer and PETG copolymers for different times.

3.4. XPS analysis

To further study the surface groups of the PET homopolymer and PETG copolymers after UV irradiation for different times, the XPS measurements were performed. The detailed high resolution C1s XPS spectra of the PET homopolymer and PETG copolymers after UV irradiation for different times are shown in Fig. 6. The chemical composition of the functional groups on the surface of the samples are reported in Table 3. For the unirradiated PET homopolymer and PETG copolymers, the C1s spectrum decomposes into four peaks: the peak at a binding energy of 284.8 eV which corresponds to C–C and C–H bond (carbon atoms in phenyl ring), the peak at 286.5 eV which corresponds to C–O bond (methylene carbon atoms singly bonded to oxygen), the peak at 288.9 eV which corresponds to O[double bond, length as m-dash]C–O bond (ester carbon atoms).39
image file: c6ra21985c-f6.tif
Fig. 6 High resolution C1s XPS spectra of the PET homopolymer and PETG copolymers after UV irradiation for different times.
Table 3 Chemical composition of the functional groups on the surface of the PET homopolymer and PETG copolymers after UV irradiation for different times
Sample UV irradiation time (h) C–H/C–C/C[double bond, length as m-dash]C 284.8 eV C–O 286.5 eV O[double bond, length as m-dash]C–O 288.9 eV π–π* 292.0 eV
PET 0 74.2 13.6 10.4 1.8
400 78.0 14.2 6.2 1.6
800 73.3 15.5 7.3 3.9
PETG(85/15) 0 81.8 10.5 5.1 2.6
400 79.7 15.2 5.1
800 69.4 18.4 11.3 0.9
PETG(70/30) 0 73.7 13.3 11.5 1.5
400 77.9 13.9 6.8 1.4
800 62.2 21.9 15.9
PETG(50/50) 0 79.1 12.5 7.6 0.9
400 59.7 23.4 15.7 1.3
800 56.5 25.6 17.9
PETG(30/70) 0 79.7 12.1 6.6 1.6
400 64.6 22.4 13.0
800 60.6 23.2 15.5 1.2


After UV irradiation, the peak position is substantially unchanged, but the peak area changes obviously. This phenomenon should be attributed to the formation of photoproducts during UV irradiation according to the ATR-FTIR analysis above. The formation of C[double bond, length as m-dash]C results in the change of the peak at 284.8 eV. The peak at 286.5 eV change obviously which is ascribed to the formation of C–OH.40 The change in the peak at 288.9 eV is due to the formation of COOH.41 As shown in Table 3, the concentration of C–O and O[double bond, length as m-dash]C–O functional groups on the surfaces of the samples increases with increasing irradiation time. It reveals that the content of the generated photoproducts increases with increasing irradiation time, which is consistent with the ATR-FTIR analysis.

3.5. Photooxidation mechanism

It is well-known that the photooxidation of PET involves a complex mechanism in which several processes interact.11,42,43 PETG copolymer, as a glycol-modified PET, is prepared by incorporating CHDM into the polymeric backbone.44 On the basis of the photooxidation mechanism of PET, a simplified mechanism of PETG photooxidation, limited to the main routes, is given in Scheme 2. From the ATR-FTIR and XPS data here obtained, the possible photo-oxidation reactions undergone by PETG during UV irradiation can be proposed to account for our findings (Scheme 3). In these schemes the radicals R˙ can be generated by Norrish type I reactions or generated in this reaction cycle.
image file: c6ra21985c-s2.tif
Scheme 2 Simplified mechanism of PETG photooxidation.

image file: c6ra21985c-s3.tif
Scheme 3 Possible photo-oxidation reactions undergone by PETG during UV irradiation.

According to the ATR-FTIR analysis, the two Norrish type I and II mechanisms may occur. The intramolecular Norrish type II process leads to the formation of benzoic acid (1696 cm−1) and double bonds (1424 cm−1) as end-groups, both observed by FTIR spectroscopy. The radicals resulting from the three possible Norrish type I photodissociative reactions may react separately by hydrogen abstraction of the polymeric backbone. This would lead to the formation of various photoproducts as end-groups observed by FTIR spectroscopy: aliphatic alcohol (3465 cm−1), anhydride (1785 cm−1), benzoic acid (1696 cm−1) and aliphatic acid (937 cm−1). The identification of molecular terephthalic acid (1686 cm−1) by FTIR spectroscopy is consistent with Norrish type I reactions occurring on both sides of the terephthalate unit followed by hydrogen abstraction process.

Primary macroradicals formed upon direct homolysis of the ester bonds by Norrish type I reactions are able to induce oxidation of the polymer through abstraction of the labile hydrogen atoms of the polymeric backbone. The macroradicals that are formed can recombine, leading to the formation of crosslinks (Scheme 2).43 Among them, just two kinds of crosslinks are given in the Scheme 2. The hydrogen atoms on the tertiary carbon of cyclohexane units are considerably more labile than those on secondary methylene groups in the α-position to ester bonds. As a consequence, the cyclohexane units are anticipated to be more oxidizable than the methylene groups. Subsequent oxygen addition followed by hydrogen abstraction results in the formation of hydroperoxides. The total concentration of hydroperoxides in PETG copolymers increases with increasing CHDM content. The hydroperoxides are photo-unstable, and the homolysis of the O–O bond gives alkoxy macroradicals and hydroxyl radicals (Scheme 3).

The secondary alkoxy macroradicals can be converted into benzoic acid as end-groups (detected by their absorption at 1696 cm−1) through hydrogen abstraction and oxidation, into anhydride (detected by the absorption at 1785 cm−1) through cage reaction (Scheme 3a). The tertiary alkoxy macroradicals may react in two ways as reported in Scheme 3b (oxidation of tertiary alkoxy macroradicals and formation of molecular carboxylic acids). By abstraction of an hydrogen atom to the polymeric backbone, hydroxyl groups are formed. These hydroxyl groups contribute to the development of the IR absorption at 3465 cm−1. The tertiary alkoxy macroradicals can be converted into aliphatic carboxylic acids (detected by their absorption at 937 cm−1) through β-scission.

3.6. TG analysis

Fig. 7 shows the TG and differential thermogravimetric (DTG) curves of the PET homopolymer and PETG copolymers after UV irradiation for different times, which displays the effects of the CHDM content and the irradiation time on the thermal stability. The characteristic parameters, obtained from the TG and DTG curves, are summarized in Table 4. All samples before and after UV irradiation exhibit one-step degradation. The unirradiated samples are stable up to 388 °C, proved by the less than 5% weight loss. Compared with the PET homopolymer, the thermal stability of the PETG copolymers slightly decreases with the increasing CHDM content. Because the chain scission reactions are more favored in the PETG copolymers at high temperatures.
image file: c6ra21985c-f7.tif
Fig. 7 TG and DTG curves of the PET homopolymer and PETG copolymers after UV irradiation for different times. The insets are the same spectra displayed on an expanded y-axis scale. Notice the differences in vertical scale.
Table 4 TG and DTG data of the PET homopolymer and PETG copolymers after UV irradiation for different timesa
Samples UV irradiation time (h) T5% (°C) T10% (°C) T20% (°C) T40% (°C) T60% (°C) T80% (°C) Tp (°C) RPD (% per min)
a T5%: temperature at 5% weight loss, T10%: temperature at 10% weight loss, T20%: temperature at 20% weight loss, T40%: temperature at 40% weight loss, T60%: temperature at 60% weight loss, T80%: temperature at 80% weight loss, Tp: temperature of the maximal degradation rate, RPD: maximal rate of degradation.
PET(100/0) 0 390 404 419 434 445 457 444 1.9
200 390 403 416 429 440 451 439 2.0
400 388 400 414 428 439 450 439 2.0
600 388 402 416 430 441 451 440 2.0
800 382 397 411 425 436 447 435 2.0
PETG(85/15) 0 392 402 412 426 437 448 436 1.9
200 387 399 411 424 435 446 433 1.9
400 384 399 412 425 436 447 434 1.9
600 382 397 410 425 436 447 433 1.9
800 378 395 408 423 434 445 432 1.9
PETG(70/30) 0 388 398 408 421 432 443 432 1.9
200 386 398 409 422 433 444 432 1.9
400 384 396 408 421 432 443 431 1.9
600 383 395 407 420 431 443 430 1.9
800 378 392 404 417 428 440 426 1.9
PETG(50/50) 0 389 398 407 419 430 441 425 1.9
200 375 389 400 414 425 436 422 1.9
400 371 387 399 412 423 435 421 1.9
600 367 386 398 412 423 435 421 1.9
800 363 383 397 411 422 433 420 1.9
PETG(30/70) 0 388 395 404 415 424 434 421 2.2
200 378 389 399 411 421 431 418 2.1
400 376 388 399 411 420 430 418 2.1
600 373 387 398 411 421 432 419 2.0
800 367 381 393 406 416 427 416 2.0


After UV irradiation, the thermal stability of the samples reduces. The extent of reduction in thermal stability increases with increasing irradiation time. After irradiated for 200 h, all parameters of the irradiated samples shift to the low temperature region, due to the significant structure changes. With the further degradation, the characteristic parameters are further decreased. The maximal rate of degradation (RPD) for the samples remains basically unchanged with increasing irradiation time. In combination, these results indicate that the thermal stability of the PETG copolymers decrease with increasing CHDM content.

4. Conclusions

The photodegradation behavior and mechanism of the PET homopolymer and PETG copolymers with different compositions were investigated. The photooxidation rate of the PETG copolymers was higher than that of PET homopolymer. And the photooxidation rate of the PETG copolymers increased with increasing CHDM content. Namely, the inherent photostability of the PETG copolymers decreased with increasing CHDM content. The PETG copolymers with different compositions exhibited the similar photooxidation mechanism. According to the FTIR analysis, the photoproducts of the PETG copolymers were consisted of aliphatic alcohol, anhydride, benzoic acid, double bond and aliphatic acid as end-groups and molecular terephthalic acid. And the crosslinking products formed during UV irradiation were not further oxidized in the whole irradiation period (0–800 h). At a given irradiation time, the CI values of the irradiated PETG copolymers increased with increasing CHDM content. This result indicated that the presence of CHDM in the PETG molecular chains accelerated the formation of photoproducts. The irradiation crosslinking due to the macroradicals recombination led to the increase in Tg of the PETG copolymers after UV irradiation. The increment of Tg increased gradually with increasing CHDM content. Therefore, the higher the CHDM content was, the higher the crosslinking degree obtained. Moreover, the thermal stability of the PETG copolymers slightly decreased with increasing CHDM content. Based on the overall performances, the PETG copolymer with 30 mol% CHDM exhibited a good balance between photostability and amorphous property, suggesting that it was a competitive candidate material for applications involving food packaging.

Acknowledgements

This work was supported by the Innovation Foundation for Graduate Students of Jiangsu Province (KYLX16_0587) and the Priority Academic Program Development of Jiangsu Higher Education Institutions (PAPD). The authors would like also to express their appreciation to Mr Guozhong Xu and Miss Ruidan Chai (Nanjing Huage Electronics & Automobile Plastic Industry Co. Ltd) for their help in the accelerated artificial weathering experiment. Special thanks are given to Mr Dongsheng Zhou for XPS analysis related to this paper.

References

  1. R. Shamsi and G. Mir Mohamad Sadeghi, RSC Adv., 2016, 6, 38399–38415 RSC.
  2. K. Sarkar, S. R. Krishna Meka, A. Bagchi, N. S. Krishna, S. G. Ramachandra, G. Madras and K. Chatterjee, RSC Adv., 2014, 4, 58805–58815 RSC.
  3. T. Chen, G. Jiang, G. Li, Z. Wu and J. Zhang, RSC Adv., 2015, 5, 60570–60580 RSC.
  4. Y. Tsai, C. H. Fan, C. Y. Hung and F. J. Tsai, J. Appl. Polym. Sci., 2008, 109, 2598–2604 CrossRef CAS.
  5. Y. Rao, J. Greener, C. A. Avila-Orta, B. S. Hsiao and T. N. Blanton, Polymer, 2008, 49, 2507–2514 CrossRef CAS.
  6. X. Wang, W. Liu, H. Zhou, B. Liu, H. Li, Z. Du and C. Zhang, Polymer, 2013, 54, 5839–5851 CrossRef CAS.
  7. K. Jang, J. W. Lee, I. K. Hong and S. Lee, Korea Aust. Rheol. J., 2013, 25, 145–152 CrossRef.
  8. A. Ranade, N. D'Souza, C. Thellen and J. A. Ratto, Polym. Int., 2005, 54, 875–881 CrossRef CAS.
  9. D. Feldman, J. Polym. Environ., 2002, 10, 163–173 CrossRef CAS.
  10. B. Rånby, J. Macromol. Sci., Part A: Pure Appl. Chem., 1993, 30, 583–594 CrossRef.
  11. A. Rivaton, Polym. Degrad. Stab., 1993, 41, 283–296 CrossRef CAS.
  12. T. Grossetête, A. Rivaton, J. L. Gardette, C. E. Hoyle, M. Ziemer, D. R. Fagerburg and H. Clauberg, Polymer, 2000, 41, 3541–3554 CrossRef.
  13. N. S. Allen, G. Rivalle, M. Edge, I. Roberts and D. R. Fagerburg, Polym. Degrad. Stab., 2000, 67, 325–334 CrossRef CAS.
  14. T. Chen, W. Zhang and J. Zhang, Polym. Degrad. Stab., 2015, 120, 232–243 CrossRef CAS.
  15. W. Huang, Y. Wan, J. Chen, Q. Xu, X. Li, X. Yang, Y. Li and Y. Tu, Polym. Chem., 2014, 5, 945–954 RSC.
  16. N. González-Vidal, A. Martínez De Ilarduya and S. Muñoz-Guerra, J. Polym. Sci., Part A: Polym. Chem., 2009, 47, 5954–5966 CrossRef.
  17. N. Vasanthan, N. J. Manne and A. Krishnama, Ind. Eng. Chem. Res., 2013, 52, 17920–17926 CrossRef CAS.
  18. R. J. Müller, H. Schrader, J. Profe, K. Dresler and W. D. Deckwer, Macromol. Rapid Commun., 2005, 26, 1400–1405 CrossRef.
  19. S. l. Yang, Z. H. Wu, W. Yang and M. B. Yang, Polym. Test., 2008, 27, 957–963 CrossRef CAS.
  20. J. Sharif, S. H. S. A. Aziz and K. Hashim, Radiat. Phys. Chem., 2000, 58, 191–195 CrossRef CAS.
  21. Z. Liu, S. Chen and J. Zhang, Polym. Degrad. Stab., 2011, 96, 1961–1972 CrossRef CAS.
  22. C. Tzoganakis, Y. Tang, J. Vlachopoulos and A. E. Hamielec, Polym.-Plast. Technol. Eng., 1989, 28, 319–350 CrossRef CAS.
  23. T. Kijchavengkul, R. Auras and M. Rubino, Polym. Test., 2008, 27, 55–60 CrossRef CAS.
  24. M. Sangermano, G. Malucelli, A. Priola and M. Manea, Prog. Org. Coat., 2006, 55, 225–230 CrossRef CAS.
  25. G. N. Patel and A. Keller, J. Polym. Sci., Part B: Polym. Phys., 1975, 13, 323–331 CrossRef CAS.
  26. N. Wu, L. Fu, M. Su, M. Aslam, K. C. Wong and V. P. Dravid, Nano Lett., 2004, 4, 383–386 CrossRef CAS.
  27. K. S. Chen, Y. A. Ku, H. R. Lin, T. R. Yan, D. C. Sheu and T. M. Chen, J. Appl. Polym. Sci., 2006, 100, 803–809 CrossRef CAS.
  28. S. W. Lee, W. Huh, Y. S. Hong and K. M. Lee, Korea Polym. J., 2000, 8, 261–267 Search PubMed.
  29. K. C. Cole, J. Guèvremont, A. Ajji and M. M. Dumoulin, Appl. Spectrosc., 1994, 48, 1513–1521 CrossRef CAS.
  30. G. G. Zhang, S. J. Song, J. Ren and S. X. Xu, J. Herb. Pharmacother., 2002, 2, 35–40 CrossRef CAS PubMed.
  31. A. Sharma, S. K. Mehta, S. Singh and S. Gupta, J. Appl. Electrochem., 2015, 46, 27–38 CrossRef.
  32. A. C. Lua and T. Yang, J. Colloid Interface Sci., 2004, 274, 594–601 CrossRef CAS PubMed.
  33. M. Sclavons, P. Franquinet, V. Carlier, G. Verfaillie, I. Fallais, R. Legras, M. Laurent and F. C. Thyrion, Polymer, 2000, 41, 1989–1999 CrossRef CAS.
  34. Y. Park, D. S. Shin, S. H. Woo, N. S. Choi, K. H. Shin, S. M. Oh, K. T. Lee and S. Y. Hong, Adv. Mater., 2012, 24, 3562–3567 CrossRef CAS PubMed.
  35. A. A. M. Farag, Opt. Laser Technol., 2007, 39, 728–732 CrossRef CAS.
  36. E. Podstawka, Y. Ozaki and L. M. Proniewicz, Appl. Spectrosc., 2005, 59, 1516–1526 CrossRef CAS PubMed.
  37. L. Zhang, R. He and H. C. Gu, Appl. Surf. Sci., 2006, 253, 2611–2617 CrossRef CAS.
  38. G. J. M. Fechine, M. S. Rabello, R. M. Souto Maior and L. H. Catalani, Polymer, 2004, 45, 2303–2308 CrossRef CAS.
  39. A. Vesel, M. Mozetic and A. Zalar, Vacuum, 2007, 82, 248–251 CrossRef CAS.
  40. J. H. T. Luong, S. Hrapovic, Y. Liu, D. Q. Yang, E. Sacher, D. Wang, C. T. Kingston and G. D. Enright, J. Phys. Chem. B, 2005, 109, 1400–1407 CrossRef CAS PubMed.
  41. C. C. Huang and Y. J. Su, J. Hazard. Mater., 2010, 175, 477–483 CrossRef CAS PubMed.
  42. F. B. Marcotte, D. Campbell, J. A. Cleaveland and D. T. Turner, J. Polym. Sci., Part A-1: Polym. Chem., 1967, 5, 481–501 CrossRef CAS.
  43. A. Rivaton, Polym. Degrad. Stab., 1993, 41, 297–310 CrossRef CAS.
  44. T. Chen and J. Zhang, Polym. Test., 2015, 48, 23–30 CrossRef CAS.

This journal is © The Royal Society of Chemistry 2016
Click here to see how this site uses Cookies. View our privacy policy here.