DOI:
10.1039/C6RA21962D
(Paper)
RSC Adv., 2016,
6, 97931-97940
Solution blending preparation of polycarbonate/graphene composite: boosting the mechanical and electrical properties†
Received
1st September 2016
, Accepted 7th October 2016
First published on 7th October 2016
Abstract
We report on the preparation of polycarbonate-based graphene (PC/G) composites, by using a simple and scalable solution blending method to disperse single- (SLG) and few-layer (FLG) graphene flakes, prepared by liquid phase exfoliation (LPE), in the polymer matrix. A solvent-exchange process is carried out to re-disperse the exfoliated SLG/FLG flakes in an environmentally friendly solvent, i.e. 1,3-dioxolane, which is also used to dissolve the polycarbonate pellets, thus facilitating the mixing of the polymer dispersion with the SLG/FLG flakes. The loading of SLG/FLG flakes improves the mechanical and thermal properties, as well as the electrical conductivity of the polymer, reaching a +26% improvement of the elastic modulus at 1 wt% loading, and an electrical conductivity 10−3 S m−1 at 10 wt% with a percolation threshold achieved at 0.55 vol%. The as-prepared PC/G composite with the aforementioned reinforced properties can be a promising material for 3D printing-based applications.
Introduction
One of the main and most promising applications involving graphene – the two dimensional allotrope of carbon – is as filler in polymer nanocomposites.1–6 In fact, the unique physical properties of graphene,7–9 i.e. mechanical (Young's modulus of 1 TPa and tensile strength of 130 GPa),10 electrical (conductivity up to 108 S m−1),11 and thermal (conductivity of ∼5 × 10³ W m−1 K−1)12 properties, coupled with a large specific surface area (theoretically predicted 2630 m2 g−1),13 make it appealing for the composite materials production.4,14 In fact, graphene-based polymer composites have already shown enhanced mechanical,15,16 thermal,17 and electrical18 properties with respect to pristine polymer matrices.
However, large quantities of graphene are needed for its exploitation in the composite field,1,4 especially in view of industrial scalability. Although several techniques are available for the production of high-quality graphene monolayers on a substrate,19 such as micromechanical cleavage,9 chemical vapour deposition (CVD),20 and growth on SiC substrate,21 those approaches are clearly not suitable for composite applications. Nowadays, large-scale production of single- (SLG) and few- (FLG) layers graphene flakes by liquid phase exfoliation (LPE) of pristine graphite22–24 is amongst the preferred production routes for the use of graphene as filler in nanocomposites.19,24 In fact, the method allows to obtain SLG and FLG flakes dispersed in a solvent or in powder form and it is also offering the possibility of scaling up.4,19,24
In a LPE process, graphene flakes are produced by exfoliation of natural graphite,4,22 or graphite oxide,19 or graphite intercalated compounds (GICs),19,25 in a solvent medium by an external driving force, such as ultra-sonication.19,26 The choice of the solvent for the exfoliation process is crucial.22,24,27 Suitable solvents have to minimize the interfacial tension between the liquid itself and the graphene flakes, i.e. solvents with surface tension of ∼40 mN m−1 (ref. 4, 19, 22, 26 and 28) such as N-methyl-2-pyrrolidone (NMP),22,29 N,N-dimethylformamide (DMF),22,30 and ortho-dichlorobenzene (DCB).22,31 However, these solvents are toxic32 and have high boiling point, i.e. more than 150 °C.33 An alternative route to the solvent exfoliation24 relies on the use of either surfactants34,35 or polymers,36,37 which aid the exfoliation of graphite in water26 or low boiling-point solvents, such as ethanol,38 tetrahydrofuran (THF),39 and chloroform,39 stabilizing the exfoliated flakes against re-aggregation.4,26,34–37 However, the residual of either surfactants or polymer increases the inter-flake contact resistance.4 After the ultra-sonication process, an ultra-centrifugation step is required to remove thick flakes and un-exfoliated bulk graphite29,40,41 from the as-prepared dispersion. The most common procedure is the sedimentation-based separation (SBS),29,41–44 which separates flakes on the basis of their sedimentation rate, i.e. the tendency of a particle (or a flake) to settle out in the solvent, in response to the centrifugal force acting on them.45
The possibility to use a purified dispersion, i.e. either graphene flakes of well-defined morphology, such as lateral size and thickness, or without the presence of thicker and/or un-exfoliated graphitic flakes is beneficial for its use in various polymer matrices.4,22,24 Summarizing, the growing demand of the polymer-based graphene composites needs an efficient and scalable production route, requirements which are satisfied by using the LPE approach. However, the as-produced dispersion by LPE has to be purified to obtain a high percentage of SLG. This requires an ultra-centrifugal step. Considering these facts and the up-scalability difficulties of ultra-centrifugation, dispersions containing pristine SLG flakes have limited availability on the commercial market, opening the avenues for novel developments in the scalable production techniques of graphene.
Another key requirement, apart from the graphene flakes morphology, to improve the properties of the final composite material with respect pristine polymer, relies on the optimal dispersion of the graphene flakes in the polymer matrices. The molecular interactions between the graphene flakes and polymer chains are due to weak van der Waals forces,28 π–π stacking,6,28 and hydrophobic–hydrophobic interactions.28 These interactions hinder efficient connections between the pristine graphene flakes and the polymer chains, so graphene flakes usually do not form homogeneous composites.1,2,14 In contrast, the epoxide, hydroxyl, carbonyl, and carboxyl groups present on the basal plane of graphene oxide (GO)46,47 and also partially in reduced graphene oxide (RGO)48,49 can interact with the polymer chains. Therefore, their use as a filler in the polymer-based composites is widely reported in literature.1,3,4,14 Nevertheless, the presence of these groups acts as defects, in addition to the structural defects due to the oxidation process in the structure of the flakes.48,50 The presence of such defects reduces the mechanical and electrical properties of GO and RGO flakes respect to graphene flakes,48,50 e.g. GO is an insulator and has a Young's modulus ranging between 200 and 600 GPa.1,50,51 Besides, the dispersion of the flakes inside the polymer matrix is strongly dependent on the processing techniques used for the production of the composite itself. Some of the most common processes for polymer composite preparation are melt blending,52,53 solution blending,54,55 and in situ polymerization.56 Melt blending is industrially attractive due to its scalability and low-cost, while solution blending provides better mixing than melt blending between the exfoliated graphitic flakes and polymer matrix.57–59
Polycarbonate (PC) is a thermoplastic polymer with high mechanical stiffness (2.0–2.4 GPa)60 and optical transparency (over 80% in visible spectrum, with a refractive index of 1.59),60 and can be used in a wide range of applications: ranging from automotive and aeronautic industries,60 to data storage (DVDs and CDs),61 replacing glass,61 and photonics.62,63 Polycarbonate could also be used as 3D printer filament,64 with higher mechanical and thermal properties with respect to polylactic acid (PLA)65 and acrylonitrile–butadiene–styrene (ABS),66 which are the reference materials used in these applications.64 For instance, the heat deflection temperature, i.e. the temperature at which a polymer deforms under a specified load, for PC is in the 135–145 °C range,61 whereas for PLA is ∼60 °C,65 while for ABS is ∼100 °C.67 This makes PC suitable for high-temperature required applications. Moreover, the exploitation of ABS or PLA filaments for 3D printing technology has also environmentally implications,68,69 as ultrafine, <100 nm, particle emissions from melt during a 3D printing process is reported.69 3D printable graphene-based composites have been firstly reported in the case of PLA70 and ABS.70 In order to exploit the aforementioned properties of PC-based graphene composites for their use in 3D printing, further studies are needed. Currently, to the best of our knowledge, there is not reported any PC/graphene (PC/G) composite where LPE of natural graphite has been exploited, whereas primarily graphene derivatives such as GO or RGO have been previously used.53,71–74 In particular, for what concerns the solution blending approach, the solvents used for the dissolution of PC are chloroform72 and THF,71 both suspected of being carcinogenic substances.75,76
In this work, we developed a simple solution blending process, to produce PC/G composite pellets using a 1,3-dioxolane-based dispersion, having a twofold function, acting as a dispersant for the graphene flakes and able to dissolve the PC for the realization of the final polymer composite. Structural characterization is carried out on both graphene flakes dispersion and PC/G composite samples using atomic force, transmission and scanning electron microscopies, and Raman spectroscopy. The LPE process produced prevalently SLG and FLG flakes with lateral size in the 200–600 nm range, and thickness in the 0.7–1.4 nm range for 60–70% of the flakes, respectively. Mechanical tests and electrical conductivity measurements are carried out to investigate the effect of different loadings of SLG and FLG flakes on the composite's physical properties. If compared to the bare polymer, the as-produced PC/G composite shows a 26% increment in Young's modulus at 1 wt% loading and an electrical conductivity of ∼10−3 S m−1 at 10 wt%, the latter representing a seven order of magnitude increment with respect to the pristine polymer.
Experimental
Materials
Polycarbonate pellets (MAKROLON®2405), natural graphite flakes (+100 mesh, 75% min), N-methyl-2-pyrrolidone (NMP, Reagent Plus®, 99%) 1,3-dioxolane (Reagent Plus®, 99%) and acetone (ACS Reagent, ≥99.5%) are purchased from Sigma-Aldrich and used as received.
Production of the graphene dispersion in 1,3-dioxolane
Graphene dispersion is produced by LPE of natural graphite. 500 mg of graphite flakes are dispersed in 50 mL of NMP and exfoliated in a sonic bath (VWR Ultrasonic Cleaner USC-THD) for 6 hours. Then, the dispersion is ultra-centrifuged at 10
000 rpm (∼17
000g), using SBS to remove un-exfoliated and thicker graphite flakes, for 30 min at 15 °C with an ultra-centrifuge (Beckman Coulter Optima™ XE-90, equipped with a SW32 Ti rotor). Finally, the supernatant is collected by pipetting. A solvent exchange process is carried out for the re-dispersion of the exfoliated flakes in 1,3-dioxolane, a non-toxic and low boiling point (78 °C)77 solvent, using a Heidolph Hei-Vap rotary evaporator. After the evaporation process of NMP, the graphitic material is collected and washed three times with acetone to remove the NMP residual using a compact centrifuge (Sigma-Aldrich). The washing step is repeated and the flakes are eventually dispersed in 50 mL of 1,3-dioxolane, adjusting its concentration at 10 mg mL−1.
Graphene dispersion characterization
Graphene dispersion is characterized morphologically (measuring lateral size and thickness) performing Transmission Electron Microscopy, TEM (Joel JEM 1101) and Atomic Force Microscopy, AFM (Bruker Innova®) on the samples once drop-casted onto holey carbon coated copper grids and Si/SiO2 wafers, respectively. Lateral size and thickness statistics are performed measuring ∼100 flakes from both TEM and AFM images, respectively. Statistical analysis are fitted with log-normal distributions.78,79 Raman spectra of SLG and FLG dispersion, drop casted onto Si/SiO2 wafers, are carried out using a Renishaw inVia confocal Raman microscope, with an excitation line of 532 nm (2.33 eV), a 50× objective and an incident power of 1 mW. For the statistical analysis 15 spectra have been collected and peaks are fitted with the Lorentzian function.
Composite preparation
The PC/G composite is produced by exploiting the solution blending technique. Fig. 1 shows a schematic representation of the composite preparation following a three-step procedure. In the first step, PC pellets are dissolved in 1,3-dioxolane (15 wt/vol%) by stirring for 3 h using a magnetic stirrer and then mixed with SLG and FLG dispersion in the same solvent (Fig. 1a). As second step, SLG and FLG dispersion in 1,3-dioxolane (10 mg mL−1) is added at different weight fractions, namely between 0.0 wt% and 3.0 wt% with respect to PC weight. The resulting dispersions are then mixed by means of ultra-sonication for 2 h, maintaining the temperature in the range 25–40 °C, in order to obtain a thorough mixing. In the third-step the composite dispersion is coagulated/precipitated forming pellets by pouring water (Fig. 1b), and then dried in a vacuum oven (Binder VDL 115) at 80 °C for 12 h.
 |
| Fig. 1 (a) Scheme of solution blending of PC/G composites. (b) Photograph of PC/G composite pellets at different loading of graphene-based flakes. | |
Finally, the pellets, previously heated up to 225 °C and pressed at 2 ton for 5 min, are compression moulded to form films, using a Madatec Atlas T8 press.
Characterization of the composite material
The composite morphology is investigated by using Scanning Electron Microscopy (SEM) with a FE-SEM Joel GSM-7500FA. Raman spectra of composite material samples are acquired using a Renishaw inVia confocal Raman microscope, using an excitation line of 532 nm (2.33 eV) with a 50× objective and an incident power of 1 mW. Peaks are fitted with Lorentzian functions. Thermogravimetric analysis (TGA) is carried out with a TGA Q500-TA Instrument. During TGA, samples are heated from 30 °C to 800 °C at a heating rate of 10 °C min−1 under nitrogen atmosphere set at a flow rate of 50 mL min−1. Mechanical properties of composite films are measured using an Instron dual column table top universal testing System 3365, with 5 mm min−1 cross-head speed. The tensile measurements are carried out on five different specimens for each film according to ASTM D882 Standard Test Methods for tensile properties of thin plastic sheeting. The electrical conductivity (EC) is measured on 1 cm × 0.5 cm pieces of the compression moulded films. The sheet resistance and as-calculated DC conductance values of the pristine polymer and composite materials is recorded using a four-point probe and source meter (Keithley, 2612A) in DC regime (samples are placed crossing on four parallel palladium wires spaced by 1 mm).
Results and discussion
Characterization of graphene dispersion in 1,3-dioxolane
In order to achieve a homogeneous dispersion of exfoliated graphene flakes into PC matrix, we exploited solution-blending technique for the production of PC/G composite.57,58 In a common solution-blending process, both matrix and filler have to be dissolved in the same solvent and then mixed. For the production of graphene-based composites exploiting this technique, PC is usually dissolved in THF72 or chloroform,71 i.e. solvents having as a downside the toxicity.75,76 Therefore, we selected 1,3-dioxolane as solvent for PC, because its low-toxicity, i.e. it is not a carcinogenic reagent if compared with NMP (see safety data sheet, SDS).80 To the best of our knowledge this is the first time that both PC and graphene flakes are dispersed in 1,3-dioxolane for their solution blending. However, 1,3-dioxolane is not a suitable solvent for the direct LPE of graphite because its surface tension, 32.6 mN m−1,81 does not match the surface energy of graphene.22,29 Thus, LPE of graphite is carried out in NMP,22 by means of low-power ultra-sonication. N-Methyl-2-pyrrolidone is one of the best solvent used for the dispersion of graphitic flakes because its surface tension is 41 mN m−1,82 close to the surface energy of graphene.22,29 The result of the exfoliation process is a heterogeneous dispersion of thin/thick and small/large graphitic flakes.19 This dispersion is then purified exploiting the SBS process.41,44
In order to re-disperse the graphitic flakes, previously exfoliated in NMP, into 1,3-dioxolane, we performed a solvent-exchange process via rotary evaporation, see Experimental section. Graphene dispersion in 1,3-dioxolane is morphologically characterized by TEM and AFM (Fig. 2) and Raman spectroscopy (Fig. S1†). TEM image of graphene flakes in 1,3-dioxolane is depicted in Fig. 2a. The electron diffraction pattern (DP) image (inset to Fig. 2a) confirms the typical lattice reflections of graphene, the expected honeycomb lattice, and crystallinity.83 The statistical analysis of lateral sizes (Fig. 2b) shows a distribution in the 200–600 nm range. The statistic is fitted by a log-normal distribution with a most probable value of lateral size peaked at 295 nm and standard deviation of 0.34. A representative AFM image and statistical analysis of graphene dispersion casted on a Si/SiO2 wafer (see Experimental) are shown in Fig. 2c and d, respectively. More than 70% of the measured flakes have thicknesses in the range 0.7–1.4 nm, corresponding to 1–3 layers of graphene flakes, considering that the first layer on SiO2 substrate has a height of ∼0.7 nm.84,85 The most probable value occurs at 1.05 nm (with a standard deviation of 0.35). The presence of defect-free SLG/FLG flakes is also confirmed by Raman spectroscopy (see ESI, Fig. S1†).
 |
| Fig. 2 Morphological characterization of graphene dispersion in 1,3-dioxolane. (a) TEM image of graphene dispersion in 1,3-dioxolane; the electron DP image of a graphene flake is depicted in the upper inset. (b) Statistical analysis from TEM images of the flakes lateral size. (c) AFM image of graphene flakes casted from dispersion in 1,3-dioxolane; the upper inset shows a higher magnification image of a graphene flake (scale bar corresponds to 100 nm). (d) Statistical analysis of the flakes thickness. | |
Morphological characterization of composite
Blend compatibility (i.e. expecting macroscopically uniform physical properties), filler dispersion, and the interfacial bond between the polymer matrix and the SLG–FLG flakes are investigated by means of SEM measurements on both the pristine PC and PC/G composite.
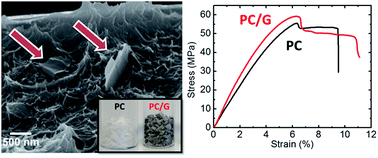
Scanning electron microscopy images of the cross section of pristine PC are shown in Fig. 3, at low (Fig. 3a) and high (Fig. 3b) magnifications, and PC/G composite of 3 wt%, at low (Fig. 3c) and high (Fig. 3d) magnifications, respectively. Graphene flakes (the brighter, angular shaped objects, marked by red arrows) can be clearly seen as uniformly dispersed in the polymer matrix, which is also confirmed by Raman characterization of the PC/G composite. Fig. 4a shows representative Raman spectra of graphene dispersion (trace black), polycarbonate (trace red) and PC/G composite dispersion after blending (trace blue). The Raman spectrum of the PC/G 3 wt% of graphene loading reveals a thorough mixing of the graphene flakes within the polymer matrix; indeed, there is the presence of peaks related to both SLG/FLG and the PC. The vertical dotted lines referred as (i), (ii) and (iii) correspond to C–CH3 (∼889 cm−1), C–O (∼1235 cm−1) and ring stretches (∼1606 cm−1) of PC,86 respectively. Statistical analysis on Pos(2D) (Fig. 4b) shows a slight blue shift of the composite with respect to the one in pristine PC. In fact, Pos(2D) is in the range 2688–2700 cm−1 for the dispersion and 2692–2702 cm−1 for the PC/G composite. The blue shift is attributed to π–π interactions between the graphene flakes and the polymer.1,87 However, the 2D peak in the composite still shows a Lorentzian line-shape differently from graphite (see FWHM(2D) distribution, Fig. 4c, indicating that FLG flakes are electronically decoupled).41,44 The lack of correlation between ID/IG and FWHM(G) (Fig. 4d) in the PC/G composite, as for the case of the graphene dispersion (see also Fig. S1f†), suggests that no defects in the SLG and FLG flakes are introduced by the solution blending process.88 More details of the Raman spectroscopy results and statistical analyses obtained investigating graphene dispersion in 1,3-dioxolane are found in ESI.†
 |
| Fig. 3 SEM images of cross section area of pristine PC, at (a) low and (b) high magnification, and PC/G composite of 3 wt% graphene loading, at (c) low and (d) high magnification. The red arrows mark the graphene flakes. | |
 |
| Fig. 4 (a) Raman spectra of graphene dispersion (trace black), pristine PC (trace red) and polycarbonate/graphene dispersion at 3% of loading (trace blue), (b–d) statistical analysis on Raman spectra of graphene dispersion and composite samples: (b) Pos(2D), (c) FWHM(2D), (d) ID/IG respect to FWHM(G). | |
Composite enhanced performances
The thermal behaviour of a composite material in view of applications, such as for example 3D printing, has to be known.70 Therefore, considering the application of the PC/G composite material for 3D printing using Fused Deposition Modelling (FDM) technology, these thermal behaviours are investigated. The FDM is an additive manufacturing technology commonly used for modelling, prototyping, and production of polymer-based objects, and it is one of the most common used techniques for 3D printing.89,90 Using the FDM process, the thermoplastic polymer filament is heated above its glass transition temperature (Tg) and extruded through the nozzle of the 3D printer, then the printed material is cooled down to room temperature forming the product. The TGA and differential TGA (DTGA) analyses on PC (black curve) and PC/G at 1 wt% (red curve) are depicted in Fig. 5 and b, respectively. The first loss of weight in the case of both pristine PC and composite material occurs in the 100–150 °C range, corresponding to ∼5 wt% loss. This decrease is attributed to the evaporation of residual solvents and/or small organic groups.91 The pyrolysis, corresponding to the main loss of weight, starts for pristine PC at ∼370 °C and is due to the cleavage of the carbonate groups.91 In the composite, loaded with 1 wt% of SLG–FLG flakes, because fillers reduce mobility of polymer chains, the degradation temperature, evaluated as the peak in the DTGA curve, increases of ∼86 °C. The peak of DTGA, corresponding indeed to the maximum reaction speed in which the sample is degraded, is at ∼421 °C for the pristine polymer and at ∼507 °C for the PC/G composite 1 wt% loaded. Thus, the presence of graphene flakes increases the thermal stability of the polymer. At 800 °C, residual chars of 20 wt% of PC and 21 wt% of composite are found, in agreement with the loading of filler.
 |
| Fig. 5 (a) TGA analysis of pristine PC (black curve) and PC/G 1 wt% (red curve). (b) DTGA analysis of pristine PC (black curve) and PC/G 1 wt% (red curve). | |
Stress vs. strain curves of pristine PC (black curve) and PC/G composite at 1 wt% (red curve) graphene loadings are shown in Fig. 6a. The Young's modulus (E) (Fig. 6b), defined as the slope of the stress vs. strain curve in the elastic region, reaches a maximum value for the 1 wt% content of SLG/FLG flakes of 1455 ± 28 MPa. The increment with respect to pristine PC, having a measured E value of 1151 ± 44 MPa, is ∼26%. Increasing the content of filler above 1 wt%, the E value decreases, reaching a minimum value of ∼1353 MPa at 1.5 wt%, which, however, still corresponds to ∼17% improvement with respect to pristine PC (1151 ± 44 MPa). The decreases of E with a loading of SLG and FLG flakes superior to 1 wt%, could be associated to the occurrence of agglomeration of the flakes,55,92,93 although further studies to ascertain this phenomenon are needed. The presence of SLG and FLG flakes also improve the tensile strength at yield (σy, defined as the stress at which a material begins to deform plastically, Fig. 6c) and ultimate tensile strength (σu, defined as the higher stress value reached in the stress vs. strain curve, Fig. 6d) of the polymer. Contrariwise to the results obtained for E, where exceeding the 1 wt% of loading there is a sudden decrease, σy and σu remain almost constant, as a ‘saturation/like’ behaviour. This opposite trend is rooted in the linear elastic deformation of plastics, as the E corresponds to the stiffness, rigidity of a sample, while the σy and σu are the capacity of the material to withstand loads tending to elongate, and the stress at which plastic deformation begins, respectively. The full mechanical characterization data are summarized in Table S1 (see ESI†).
 |
| Fig. 6 Mechanical properties of composites and pristine materials: (a) stress vs. strain curves, (b) Young's modulus (E), (c) tensile strength at yield (σy), and (d) ultimate tensile strength (σu). | |
The increments in the mechanical properties that we obtained are higher with respect to other works involving the use of PC. For example, Kim et al.53 reported a ∼6.7% and ∼20.7% increments of E at 1 wt% and 2.5 wt% of functionalized graphene sheets (thermally exfoliated graphite oxide) loading, respectively, while Shen et al.,94 reported a 6.8% increment of E at 10 wt% of RGO loading. The same group95 also reported a 72.1% increment of E using epoxy-functionalized GO, in which GO flakes were dispersed in DMF and PC dissolved in THF. However, both solvents have toxicity issues, as discussed above. Mittal et al.96 reported enhancement of ∼23% in E but with 7 wt% of RGO flakes loading.
We anticipate that the mechanical properties of our composite material could be additionally enhanced by optimizing the aspect ratio of the graphene flakes (lateral size vs. thickness), as reported in the case of PVA,93 where the reported aspect ratio of flakes is ∼1900 and the enhancement of E with respect pristine PVA is ∼66% at 0.36 vol% (∼0.65 wt%) of loading (as comparison, the aspect ratio of the graphene flakes used in this work is ∼280). Considering the work of Coleman and co-workers,93 it seems that the resulting mechanical enhancement of the polymer-based graphene composites, is rooted on the differences in the structural and morphological properties of the graphene flakes. However, further systematic studies are needed to verify this hypothesis.
Finally, static electrical conductivity measurements (DC regime) on composite, as function of SLG/FLG content in the composite material (PC/G), are presented in Fig. 7. The PC/G composites with SLG and FLG concentrations up to 10 wt% are prepared for this characterization. The pristine polymer matrix exhibits DC conductivity of the order of 10−11 S m−1, reaching ∼10−7 S m−1 for 2 wt% and almost 10−3 S m−1 at 10 wt% of loading. The improvement on DC electrical conductivity of the composite follows a percolation behaviour,18,71,97 with a percolation threshold (ϕc) of ∼1 wt% (∼0.55 vol%). This value is in line with what achieved by other works involving PC/G composites.53,71 The percolation threshold corresponds to the critical volume of nanoparticles, in this case SLG and FLG flakes, such that they are able to generate a conductive path for charge carriers.98 When the content of filler exceeds ϕc, there is a suddenly increase in DC electrical conductivity of the PC/G composite. According to the percolation theory, electrical conductivity of composite is related to volume fraction ϕ of filler by eqn (1):
|
σDC = σ0[(ϕ − ϕc)/(1 − ϕc)]t
| (1) |
for
ϕ >
ϕc, where
σDC is the DC electrical conductivity,
σ0 is referred as the conductivity of fillers,
ϕc is the percolation volume fraction, and
t is the critical exponent, which depends on the percolation model.
98,99 From the linear fit of lg(
σDC)
vs. lg[(
ϕ −
ϕc)/(1 −
ϕc)], shown as inset to
Fig. 7, we found that,
σ0 = 10
(2.152±0.823) S m
−1 = 141.91 ± 6.65 S m
−1 and
t = 4.027 ± 0.411. The percolation threshold could be further lowered increasing the aspect ratio of the filler, facilitating the formation of a conductive path at a lower volume loading.
18,100,101
 |
| Fig. 7 Electrical conductivity (σDC) of composite vs. SLG/FLG flakes content showing percolation behaviour. The plot of log(σDC) vs. lg[(ϕ − ϕc)/(1 − ϕc)], where ϕ is the volume content and ϕc the percolation threshold, with a linear fit of experimentally measured points is shown in the inset. | |
Conclusions
In this study we proposed a scalable method for the production of a PC/G composite. Single and few-layers graphene flakes, used as filler, are obtained by means of LPE of pristine graphite.
Exfoliation is carried out in NMP and then, by exploiting a solvent exchange process, the graphene flakes are dispersed in 1,3-dioxolane, which is a non-toxic, environmentally-friendly and low-boiling point solvent. The final composite is then obtained by mixing the graphene-based dispersion and the polymer solution in 1,3-dioxolane, by means of solution blending. Raman spectroscopy and SEM microscopy have shown the homogeneous dispersion of the single- and few-layer graphene flakes in the PC matrix.
The thermal stability of the PC/G containing 1 wt% of SLG and FLG flakes filler compared to the pristine PC is assessed by TGA analysis demonstrating an upshift of the degradation temperature of ∼86 °C. Furthermore, a 26% improvement of Young's modulus with respect to pristine PC is reached for 1 wt% content of SLG and FLG flakes. The presence of the fillers also enhances the yield- and ultimate-tensile strength. The PC/G composite electrical percolation threshold is found at ∼1 wt% of graphene loading, reaching electrical conductivity of ∼10−3 S m−1 at 10 wt%.
The as-produced PC/G composite can be the ideal starting material for 3D printing applications in constructing 3D electronics, due to its increased mechanical and electrical properties and thermal stability coupled with the environmentally-friendly approach here proposed.
Acknowledgements
The authors acknowledge the funding support from the European Union Seventh Framework Programme under grant agreement no. 604391 Graphene Flagship. E. L. also thanks the Educational Fund (Italia) for a PhD scholarship.
References
- J. R. Potts, D. R. Dreyer, C. W. Bielawski and R. S. Ruoff, Polymer, 2011, 52, 5–25 CrossRef CAS.
- H. Kim, A. A. Abdala and C. W. Macosko, Macromolecules, 2010, 43, 6515–6530 CrossRef CAS.
- S. Stankovich, D. A. Dikin, G. H. B. Dommett, K. M. Kohlhaas, E. J. Zimney, E. A. Stach, R. D. Piner, S. T. Nguyen and R. S. Ruoff, Nature, 2006, 442, 282–286 CrossRef CAS PubMed.
- A. C. Ferrari, Nanoscale, 2014, 7, 4598–4810 RSC.
- V. Palermo, I. A. Kinloch, S. Ligi and N. M. Pugno, Adv. Mater., 2016, 28, 6232–6238 CrossRef CAS PubMed.
- M. Zhang, Y. Li, Z. Su and G. Wei, Polym. Chem., 2015, 6, 6107–6124 RSC.
- A. H. Castro Neto, N. M. R. Peres, K. S. Novoselov and A. K. Geim, Rev. Mod. Phys., 2009, 81, 109–162 CrossRef CAS.
- F. Bonaccorso, L. Colombo, G. Yu, M. Stoller, V. Tozzini, A. C. Ferrari, R. S. Ruoff and V. Pellegrini, Science, 2015, 347, 1246501 CrossRef PubMed.
- K. S. Novoselov, A. K. Geim, S. V. Morozov, D. Jiang, M. I. Katsnelson, I. V. Grigorieva, S. V. Dubonos and A. A. Firsov, Nature, 2005, 438, 197–200 CrossRef CAS PubMed.
- C. Lee, X. Wei, J. W. Kysar and J. Hone, Science, 2008, 321, 385–388 CrossRef CAS PubMed.
- A. K. Geim and K. S. Novoselov, Nat. Mater., 2007, 6, 183–191 CrossRef CAS PubMed.
- A. A. Balandin, S. Ghosh, W. Bao, I. Calizo, D. Teweldebrhan, F. Miao and C. N. Lau, Nano Lett., 2008, 8, 902–907 CrossRef CAS PubMed.
- A. Peigney, C. Laurent, E. Flahaut, R. R. Bacsa and A. Rousset, Carbon, 2001, 39, 507–514 CrossRef CAS.
- T. Ramanathan, A. A. Abdala, S. Stankovich, D. A. Dikin, M. Herrera-Alonso, R. D. Piner, D. H. Adamson, H. C. Schniepp, X. Chen, R. S. Ruoff, S. T. Nguyen, I. A. Aksay, R. K. Prud’Homme and L. C. Brinson, Nat. Nanotechnol., 2008, 3, 327–331 CrossRef CAS PubMed.
- R. J. Young, I. A. Kinloch, L. Gong and K. S. Novoselov, Compos. Sci. Technol., 2012, 72, 1459–1476 CrossRef CAS.
- P. Cataldi, I. S. Bayer, G. Nanni, A. Athanassiou, F. Bonaccorso, V. Pellegrini, A. E. del Rio Castillo, F. Ricciardella, S. Artyukhin, M.-A. Tronche, Y. Gogotsi and R. Cingolani, Carbon, 2016, 109, 331–339 CrossRef CAS.
- C.-C. Teng, C.-C. M. Ma, C.-H. Lu, S.-Y. Yang, S.-H. Lee, M.-C. Hsiao, M.-Y. Yen, K.-C. Chiou and T.-M. Lee, Carbon, 2011, 49, 5107–5116 CrossRef CAS.
- P. Cataldi, I. S. Bayer, F. Bonaccorso, V. Pellegrini, A. Athanassiou and R. Cingolani, Adv. Electron. Mater., 2015, 1, 1500224 CrossRef.
- F. Bonaccorso, A. Lombardo, T. Hasan, Z. Sun, L. Colombo and A. C. Ferrari, Mater. Today, 2012, 15, 564–589 CrossRef CAS.
- X. Li, W. Cai, J. An, S. Kim, J. Nah, D. Yang, R. Piner, A. Velamakanni, I. Jung, E. Tutuc, S. K. Banerjee, L. Colombo and R. S. Ruoff, Science, 2009, 324, 1312–1314 CrossRef CAS PubMed.
- C. Berger, Z. Song, X. Li, X. Wu, N. Brown, C. Naud, D. Mayou, T. Li, J. Hass, A. N. Marchenkov, E. H. Conrad, P. N. First and W. A. de Heer, Science, 2006, 312, 1191–1196 CrossRef CAS PubMed.
- Y. Hernandez, V. Nicolosi, M. Lotya, F. M. Blighe, Z. Sun, S. De, I. T. McGovern, B. Holland, M. Byrne, Y. K. Gun’Ko, J. J. Boland, P. Niraj, G. Duesberg, S. Krishnamurthy, R. Goodhue, J. Hutchison, V. Scardaci, A. C. Ferrari and J. N. Coleman, Nat. Nanotechnol., 2008, 3, 563–568 CrossRef CAS PubMed.
- J. N. Coleman, M. Lotya, A. O'Neill, S. D. Bergin, P. J. King, U. Khan, K. Young, A. Gaucher, S. De, R. J. Smith, I. V Shvets, S. K. Arora, G. Stanton, H.-Y. Kim, K. Lee, G. T. Kim, G. S. Duesberg, T. Hallam, J. J. Boland, J. J. Wang, J. F. Donegan, J. C. Grunlan, G. Moriarty, A. Shmeliov, R. J. Nicholls, J. M. Perkins, E. M. Grieveson, K. Theuwissen, D. W. McComb, P. D. Nellist and V. Nicolosi, Science, 2011, 331, 568–571 CrossRef CAS PubMed.
- F. Bonaccorso, A. Bartolotta, J. N. Coleman and C. Backes, Adv. Mater., 2016, 28, 6136–6166 CrossRef CAS PubMed.
- P. K. Ang, S. Wang, Q. Bao, J. T. L. Thong and K. P. Loh, ACS Nano, 2009, 3, 3587–3594 CrossRef CAS PubMed.
- A. Ciesielski and P. Samorì, Chem. Soc. Rev., 2014, 43, 381–398 RSC.
- V. Nicolosi, M. Chhowalla, M. G. Kanatzidis, M. S. Strano and J. N. Coleman, Science, 2013, 340, 1226419 CrossRef.
- J. N. Israelachvili, Intermolecular and Surface Forces, Academic Press, 3rd edn, 2011 Search PubMed.
- A. Capasso, A. E. Del Rio Castillo, H. Sun, A. Ansaldo, V. Pellegrini and F. Bonaccorso, Solid State Commun., 2015, 224, 53–63 CrossRef CAS.
- C. Liu, G. Hu and H. Gao, J. Supercrit. Fluids, 2012, 63, 99–104 CrossRef CAS.
- S. Haar, M. El Gemayel, Y. Shin, G. Melinte, M. A. Squillaci, O. Ersen, C. Casiraghi, A. Ciesielski and P. Samorì, Sci. Rep., 2015, 5, 16684 CrossRef CAS PubMed.
- H. M. Solomon, B. A. Burgess, G. L. Kennedy and R. E. Staples, Drug Chem. Toxicol., 1995, 18, 271–293 CrossRef CAS PubMed.
- W. M. Haynes, D. R. Lide and T. J. Bruno, Handbook of Chemistry and Physics, CRC Press, 96th edn, 2015 Search PubMed.
- R. Narayan and S. O. Kim, Nano Convergence, 2015, 2, 20 CrossRef.
- M. Lotya, Y. Hernandez, P. J. King, R. J. Smith, V. Nicolosi, L. S. Karlsson, F. M. Blighe, S. De, Z. Wang, I. T. McGovern, G. S. Duesberg and J. N. Coleman, J. Am. Chem. Soc., 2009, 131, 3611–3620 CrossRef CAS PubMed.
- J.-W. T. Seo, A. A. Green, A. L. Antaris and M. C. Hersam, J. Phys. Chem. Lett., 2011, 2, 1004–1008 CrossRef CAS.
- P. May, U. Khan, J. M. Hughes and J. N. Coleman, J. Phys. Chem. C, 2012, 116, 11393–11400 CAS.
- Y. T. Liang and M. C. Hersam, J. Am. Chem. Soc., 2010, 132, 17661–17663 CrossRef CAS PubMed.
- L. Xu, J. W. McGraw, F. Gao, M. Grundy, Z. Ye, Z. Gu and J. L. Shepherd, J. Phys. Chem. C, 2013, 117, 10730–10742 CAS.
- O. M. Maragó, F. Bonaccorso, R. Saija, G. Privitera, P. G. Gucciardi, M. A. Iatì, G. Calogero, P. H. Jones, F. Borghese, P. Denti, V. Nicolosi and A. C. Ferrari, ACS Nano, 2010, 4, 7515–7523 CrossRef PubMed.
- J. Hassoun, F. Bonaccorso, M. Agostini, M. Angelucci, M. G. Betti, R. Cingolani, M. Gemmi, C. Mariani, S. Panero, V. Pellegrini and B. Scrosati, Nano Lett., 2014, 14, 4901–4906 CrossRef CAS PubMed.
- H. Sun, A. E. Del Rio Castillo, S. Monaco, A. Capasso, A. Ansaldo, M. Prato, D. A. Dinh, V. Pellegrini, B. Scrosati, L. Manna and F. Bonaccorso, J. Mater. Chem. A, 2016, 4, 6886–6895 CAS.
- S. Casaluci, M. Gemmi, V. Pellegrini, A. Di Carlo and F. Bonaccorso, Nanoscale, 2016, 8, 5368–5378 RSC.
- F. Torrisi, T. Hasan, W. Wu, Z. Sun, A. Lombardo, T. S. Kulmala, G.-W. Hsieh, S. Jung, F. Bonaccorso, P. J. Paul, D. Chu and A. C. Ferrari, ACS Nano, 2012, 6, 2992–3006 CrossRef CAS PubMed.
- T. Svedberg and K. O. Pedersen, The Ultracentrifuge, Oxford Univ. Press, London, 1940 Search PubMed.
- D. R. Dreyer, S. Park, C. W. Bielawski and R. S. Ruoff, Chem. Soc. Rev., 2010, 39, 228–240 RSC.
- D. A. Dikin, S. Stankovich, E. J. Zimney, R. D. Piner, G. H. B. Dommett, G. Evmenenko, S. T. Nguyen and R. S. Ruoff, Nature, 2007, 448, 457–460 CrossRef CAS PubMed.
- S. Stankovich, D. A. Dikin, R. D. Piner, K. A. Kohlhaas, A. Kleinhammes, Y. Jia, Y. Wu, S. T. Nguyen and R. S. Ruoff, Carbon, 2007, 45, 1558–1565 CrossRef CAS.
- G. Eda, G. Fanchini and M. Chhowalla, Nat. Nanotechnol., 2008, 3, 270–274 CrossRef CAS PubMed.
- C. Gómez-Navarro, R. T. Weitz, A. M. Bittner, M. Scolari, A. Mews, M. Burghard and K. Kern, Nano Lett., 2007, 7, 3499–3503 CrossRef PubMed.
- J. W. Suk, R. D. Piner, J. An and R. S. Ruoff, ACS Nano, 2010, 4, 6557–6564 CrossRef CAS PubMed.
- H.-B. Zhang, W.-G. Zheng, Q. Yan, Y. Yang, J.-W. Wang, Z.-H. Lu, G.-Y. Ji and Z.-Z. Yu, Polymer, 2010, 51, 1191–1196 CrossRef CAS.
- H. Kim and C. W. Macosko, Polymer, 2009, 50, 3797–3809 CrossRef CAS.
- S. Vadukumpully, J. Paul, N. Mahanta and S. Valiyaveettil, Carbon, 2011, 49, 198–205 CrossRef CAS.
- E. L. Papadopoulou, F. Pignatelli, S. Marras, L. Marini, A. Davis, A. Athanassiou and I. S. Bayer, RSC Adv., 2016, 6, 6823–6831 RSC.
- Z. Xu and C. Gao, Macromolecules, 2010, 43, 6716–6723 CrossRef CAS.
- L. Gong, B. Yin, L. Li and M. Yang, Composites, Part B, 2015, 73, 49–56 CrossRef CAS.
- H. Kim, S. Kobayashi, M. A. AbdurRahim, M. J. Zhang, A. Khusainova, M. A. Hillmyer, A. A. Abdala and C. W. Macosko, Polymer, 2011, 52, 1837–1846 CrossRef CAS.
- H. Kim, Y. Miura and C. W. MacOsko, Chem. Mater., 2010, 22, 3441–3450 CrossRef CAS.
- G. D. Legrand and G. T. Bendler, Handbook of Polycarbonate Science and Technology, CRC Press, 1999 Search PubMed.
- G. Abts, T. Eckel and R. Wehrmann, Polycarbonates, Ullmann's Encyclopedia of Industrial Chemistry, Wiley, Weinheim, Germany, 2014 Search PubMed.
- D. Li, A. E. Del Rio Castillo, H. Jussila, G. Ye, Z. Ren, J. Bai, X. Chen, H. Lipsanen, Z. Sun and F. Bonaccorso, Applied Materials Today, 2016, 4, 17–23 CrossRef.
- T. Hasan, Z. Sun, F. Wang, F. Bonaccorso, P. H. Tan, A. G. Rozhin and A. C. Ferrari, Adv. Mater., 2009, 21, 3874–3899 CrossRef CAS.
- F. Fischer, Thermoplastics: The Best Choice for 3D Printing, White Pap. Strat., Inc., Edn Prairie, MN, 2011 Search PubMed.
- Y. Wang, S. M. Chiao, T.-F. Hung and S.-Y. Yang, J. Appl. Polym. Sci., 2012, 125, E402–E412 CrossRef CAS.
- R. Greco, M. F. Astarita, L. Dong and A. Sorrentino, Adv. Polym. Technol., 1994, 13, 259–274 CrossRef CAS.
- O. Olabisi and K. Adewale, Handbook of thermoplastics, CRC Press, 1997, vol. 41 Search PubMed.
- J. V. Rutkowski and B. C. Levin, Fire Mater., 1986, 10, 93–105 CrossRef CAS.
- B. Stephens, P. Azimi, Z. El Orch and T. Ramos, Atmos. Environ., 2013, 79, 334–339 CrossRef CAS.
- X. Wei, D. Li, W. Jiang, Z. Gu, X. Wang, Z. Zhang and Z. Sun, Sci. Rep., 2015, 5, 11181 CrossRef PubMed.
- M. Yoonessi and J. R. Gaier, ACS Nano, 2010, 4, 7211–7220 CrossRef CAS PubMed.
- P. K. Sain, R. K. Goyal, Y. V. S. S. Prasad, K. B. Sharma and A. K. Bhargava, J. Appl. Polym. Sci., 2015, 132, 42443 CrossRef.
- M. Wegrzyn, A. Ortega, A. Benedito and E. Gimenez, J. Appl. Polym. Sci., 2015, 132, 42536 Search PubMed.
- B. Y. Lee, J. Y. Park and Y. C. Kim, Polym. Adv. Technol., 2015, 26, 1241–1246 CrossRef CAS.
- R. J. Golden, S. E. Holm, D. E. Robinson, P. H. Julkunen and E. A. Reese, Regul. Toxicol. Pharmacol., 1997, 26, 142–155 CrossRef CAS PubMed.
- R. S. Chhabra, M. R. Elwell, B. Chou, R. A. Miller and R. A. Renne, Toxicol. Sci., 1990, 14, 338–345 CrossRef CAS.
- D. R. Lide, Handbook of organic solvents, CRC Press, 1995 Search PubMed.
- K. Kouroupis-Agalou, A. Liscio, E. Treossi, L. Ortolani, V. Morandi, N. M. Pugno and V. Palermo, Nanoscale, 2014, 6, 5926 RSC.
- A. V. Alaferdov, A. Gholamipour-Shirazi, M. A. Canesqui, Y. A. Danilov and S. A. Moshkalev, Carbon, 2014, 69, 525–535 CrossRef CAS.
- 1,3-Dioxolane SDS, Sigma-Aldrich Co. Ltd., http://www.sigmaaldrich.com/MSDS/MSDS/PrintMSDSAction.do?name=msdspdf_1609271112102698.
- E. Calvo, M. Pintos, A. Amigo and R. Bravo, J. Colloid Interface Sci., 2004, 272, 438–443 CrossRef CAS PubMed.
- M. D. Lechner, C. Wohlfarth and B. Wohlfarth, Surface Tension of Pure Liquids and Binary Liquid Mixtures, Springer, 2015 Search PubMed.
- J. C. Meyer, A. K. Geim, M. I. Katsnelson, K. S. Novoselov, T. J. Booth and S. Roth, Nature, 2007, 446, 60–63 CrossRef CAS PubMed.
- A. Gupta, G. Chen, P. Joshi, A. S. Tadigadapa and P. C. Eklund, Nano Lett., 2006, 6, 2667–2673 CrossRef CAS PubMed.
- P. Nemes-Incze, Z. Osváth, K. Kamarás and L. P. Biró, Carbon, 2008, 46, 1435–1442 CrossRef CAS.
- J. Dybal, P. Schmidt, J. Baldrian and J. Kratochvíl, Macromolecules, 1998, 31, 6611–6619 CrossRef CAS.
- Q. Su, S. Pang, V. Alijani, C. Li, X. Feng and K. Müllen, Adv. Mater., 2009, 21, 3191–3195 CrossRef CAS.
- T. Tsukamoto, K. Yamazaki, H. Komurasaki and T. Ogino, J. Phys. Chem. C, 2012, 116, 4732–4737 CAS.
- R. Anitha, S. Arunachalam and P. Radhakrishnan, J. Mater. Process. Technol., 2001, 118, 385–388 CrossRef.
- S. Masood and W. Song, Mater. Des., 2004, 25, 587–594 CrossRef CAS.
- B. S. Banerjee, S. S. Khaira and B. K. Balasubramanian, RSC Adv., 2014, 4, 63380–63386 RSC.
- M. Karevan, S. Eshraghi, R. Gerhardt, S. Das and K. Kalaitzidou, Carbon, 2013, 64, 122–131 CrossRef CAS.
- P. May, U. Khan, A. O'Neill and J. N. Coleman, J. Mater. Chem., 2012, 22, 1278–1282 RSC.
- B. Shen, W. Zhai, M. Tao, D. Lu and W. Zheng, Compos. Sci. Technol., 2013, 86, 109–116 CrossRef CAS.
- B. Shen, W. Zhai, M. Tao, D. Lu and W. Zheng, Compos. Sci. Technol., 2013, 77, 87–94 CrossRef CAS.
- V. Mittal and A. U. Chaudhry, Macromol. Mater. Eng., 2015, 300, 510–521 CrossRef CAS.
- E. Tkalya, M. Ghislandi, R. Otten, M. Lotya, A. Alekseev, P. van der Schoot, J. Coleman, G. de With and C. Koning, ACS Appl. Mater. Interfaces, 2014, 6, 15113–15121 CAS.
- S. Kirkpatrick, Rev. Mod. Phys., 1973, 45, 574–588 CrossRef.
- J. W. Essam, Rep. Prog. Phys., 1980, 43, 833–912 CrossRef CAS.
- L. He and S. C. Tjong, Nanoscale Res. Lett., 2013, 8, 132 CrossRef PubMed.
- J. Liang, Y. Wang, Y. Huang, Y. Ma, Z. Liu, J. Cai, C. Zhang, H. Gao and Y. Chen, Carbon, 2009, 47, 922–925 CrossRef CAS.
Footnote |
† Electronic supplementary information (ESI) available. See DOI: 10.1039/c6ra21962d |
|
This journal is © The Royal Society of Chemistry 2016 |
Click here to see how this site uses Cookies. View our privacy policy here.