Karoon Sadorn*a,
Siriporn Saepuab,
Nattawut Boonyuenb,
Pattiyaa Laksanacharoenb,
Pranee Rachtaweeb and
Pattama Pittayakhajonwutb
aDepartment of Chemistry, Faculty of Science, King Mongkut's Institute of Technology Ladkrabang, Chalongkrung Road, Ladkrabang, Bangkok 10520, Thailand. E-mail: karoon.sa@kmitl.ac.th; Fax: +66-2-329-8428; Tel: +66-2-329-8400 ext. 290
bNational Center for Genetic Engineering and Biotechnology (BIOTEC), National Science and Technology Development Agency (NSTDA), Thailand Science Park, Paholyothin Road, Klong Luang, Pathumthani 12120, Thailand
First published on 29th September 2016
Twelve new compounds, including (−)-oudemansin A acid (1), (−)-oudemansin A ethyl ester (3) and (−)-oudemansin X ethyl ester (5), (+)-oudemansin A lactone (6) and (+)-oudemansin X lactone (7), (+)-dihydrooudemansinol (8), (−)-11-epidihydrooudemansinol (9), (+)-xeruhydrofuranol (10), (+)-9-epixeruhydrofuranol (11), xerucitrinic acids A (14) and B (15), and (2R,3R,8aR)-2-(E-hept-5-en-1-yl)-3-methyltetrahydro-2H-pyrrolo[2,1-b][1,3]oxazin-4(3H)-one (16) and one naturally new compound, strobilurin A acid (12), together with nine known compounds such as (−)-oudemansins A (2) and X (4), (3Z,5E)-3-methyl-6-phenylhexa-3,5-dien-1-ol (13), 2-(E-hept-5-en-1-yl)-3-methyl-6,7,8,8a-tetrahydro-4H-pyrrolo[2,1-b][1,3]oxazin-4-one (17), scalusamides A–C (18–20), phenol A acid (21), and dihydrocitrinone (22), were isolated from the mushroom Xerula sp. BCC56836. Their chemical structures were established based on the information from NMR spectroscopic and mass spectrometric analyses, specific rotation values, and chemical means. A plausible biosynthesis of xerucitrinic acids A (14) and B (15), the first citrinin dimers with spiro skeletons, was also proposed. In addition, the isolated compounds were evaluated for antimicrobial activity, including antimalarial, antifungal, and antibacterial activities, and their cytotoxicity against both cancerous (MCF-7, KB, NCI-H187) and non-cancerous (Vero) cells. Compounds 2, 4, and 5 possessed antimalarial activity against Plasmodium falciparum, K1 strain (IC50 1.19–13.70 μM) and compounds 3–5, 12–14, and 17 exhibited anti-Bacillus cereus activity (MIC 12.5–25.0 μg mL−1). Most isolated compounds showed low cytotoxicity against both cancerous and non-cancerous cells.
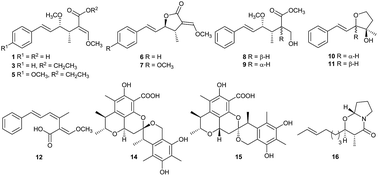
In our continuing screening programme in the search for bioactive compounds from Thai microorganisms, we came across the crude extracts from broth and cells of Xerula sp. BCC56836, exhibiting antimalarial activity against Plasmodium falciparum K1 strain, multidrug-resistant strain, with IC50 values in a range of 3.47 to >10 μg mL−1 and also giving prolific chemical profiles from HPLC analysis. Therefore, the chemical constituents from the crude extracts were conducted. The investigation led to the isolation of twelve new compounds, which included (−)-oudemansin A acid (1), (−)-oudemansin A ethyl ester (3) and (−)-oudemansin X ethyl ester (5), (+)-oudemansin A lactone (6) and (+)-oudemansin X lactone (7), (+)-dihydrooudemansinol (8), (−)-11-epidihydrooudemansinol (9), (+)-xeruhydrofuranol (10), (+)-9-epixeruhydrofuranol (11), xerucitrinic acids A (14) and B (15), (2R,3R,8aR)-2-(E-hept-5-en-1-yl)-3-methyltetrahydro-2H-pyrrolo[2,1-b][1,3]oxazin-4(3H)-one (16), and one naturally new compound, strobilurin A acid (12), along with nine known compounds, which were (−)-oudemansins A (2) and X (4), (3Z,5E)-3-methyl-6-phenylhexa-3,5-dien-1-ol (13), 2-(E-hept-5-en-1-yl)-3-methyl-6,7,8,8a-tetrahydro-4H-pyrrolo[2,1-b][1,3]oxazin-4-one (17), scalusamides A–C (18–20), phenol A acid (21), and dihydrocitrinone (22). The isolated compounds were then evaluated for antimicrobial activity, including antimalarial (against Plasmodium falciparum, K1 – multidrug resistant strain), antibacterial (against Bacillus cereus), antifungal (against Candida albicans), anti-phytopathogenic fungal (against Alternaria brassicicola, Colletotrichum capsici, C. gloeosporioides) activities, as well as cytotoxicity against both cancerous (MCF-7, KB, NCI-H187) and non-cancerous (Vero) cells.
Compound 1 was obtained as a yellow oil. Its molecular formula was deduced to be C16H20O4 from the mass ion peak at m/z 299.1259 [M + Na]+ by HRESIMS data. The IR spectrum showed a broad hydroxyl absorption at ν 2500–3600 cm−1 and a strong absorption at νmax 1676 cm−1 for a conjugated carboxylic acid carbonyl. Thus, the carbonyl signal resonating at δC 167.9 in the 13C NMR spectrum must be a carboxylic carbon. The 1H and 13C NMR spectroscopic data (Table 1) of compound 1 were similar to those of previously identified oudemansin A (2),10,11 except that one methoxy signal was absent in compound 1. The HMBC spectrum showing correlations from H-10 to C-11, C-12, C-13, and C-14; from H-12 to C-10, C-11, C-13, and C-15; and from H-15 to C-12 indicated the presence of a β-methoxyacrylate moiety linking to C-10 at the α-position of the carboxylic group. The spectroscopic evidence suggested that a methyl ester of oudemansin A (2) was replaced with an acid group. The rest of the molecule was also reassured by 2D NMR spectroscopic analyses including HMQC, HMBC, and COSY data. The configurations of two double bonds at C-7 and C-11 were assigned as E, indicated by a large coupling constant of 15.9 Hz between H-7 and H-8 and by comparison of the chemical shift with the previously reported data for oudemansins, respectively.8,10–13 Moreover, the specific rotation value of compound 1 ([α]26D −27.0) were in good agreement with that of (−)-oudemansin A ([α]22D −17.0),10,11 (−)-oudemansin B ([α]22D −8.3),8 and (−)-oudemansin X ([α]25D −20.0).12,13 Therefore, the absolute configurations at C-9 and C-10 was assigned as 9S, 10S, same as those assigned for (−)-oudemansins. Compound 1 possess the chemical structure as shown in Fig. 1 and is given the trivial name of (−)-oudemansin A acid.
Position | 1a | 3b | 5c | |||
---|---|---|---|---|---|---|
δC, type | δH, mult. (J in Hz) | δC, type | δH, mult. (J in Hz) | δC, type | δH, mult. (J in Hz) | |
a Recorded in acetone-d6, 400 MHz for 1H NMR and 100 MHz for 13C NMR.b Recorded in CDCl3, 400 MHz for 1H NMR and 100 MHz for 13C NMR.c Recorded in acetone-d6, 500 MHz for 1H NMR and 125 MHz for 13C NMR.d Data given from 1H decoupling experiment recorded in acetone-d6. | ||||||
1,5 | 126.3, CH | 7.38, d (7.3) | 126.4, CH | 7.42, d (6.9) | 127.5, CH | 7.30, d (8.7) |
2,4 | 128.4, CH | 7.30(3), t (7.3) | 128.4, CH | 7.38, dd (6.9, 7.0) | 113.9, CH | 6.87, d (8.7) |
3 | 127.2, CH | 7.22, t (7.3) | 127.3, CH | 7.30, t (7.0) | 159.4, C | |
6 | 137.3, C | 137.2, C | 129.7, C | |||
7 | 132.2, CH | 6.47, d (15.9) | 132.4, CH | 6.50, d (15.9) | 132.0, CH | 6.38, d (15.9) |
8 | 129.9, CH | 5.93, dd (15.9, 8.5) | 129.8, CH | 6.01, dd (15.9, 8.6) | 127.3, CH | 5.74, dd (15.9, 8.7) |
9 | 84.7, CH | 3.99, dd (9.7, 8.5)d | 85.1, CH | 4.04, dd (9.7, 8.6)d | 85.0, CH | 3.92, dd (9.7, 8.7)d |
10 | 35.8, CH | 2.94, dq (9.7, 6.9) | 35.8, CH | 3.08, dq (9.7, 6.9) | 35.7, CH | 2.94, dq (9.7, 6.9) |
11 | 112.0, C | 112.8, C | 112.4, C | |||
12 | 159.6, CH | 7.30, s | 159.1, CH | 7.26, s | 159.2, CH | 7.24, s |
13 | 167.9, C | 167.8, C | 167.0, C | |||
14 | 15.1, CH3 | 1.23, d (6.9) | 15.7, CH3 | 1.35, d (6.9) | 15.3, CH3 | 1.22, d (6.9) |
15 | 60.8, CH3 | 3.85, s | 61.2, CH3 | 3.85, s | 60.9, CH3 | 3.83, s |
3-OCH3 | 54.7, CH3 | 3.77, s | ||||
9-OCH3 | 55.7, CH3 | 3.26, s | 56.5, CH3 | 3.40, s | 55.5, CH3 | 3.24, s |
16 | 59.6, CH2 | 4.20, q (7.1) | 59.0, CH2 | 4.05, q (7.1) | ||
17 | 14.3, CH3 | 1.30, t (7.1) | 13.8, CH3 | 1.16, t (7.1) |
Compound 3 was obtained as a pale yellow oil. The 1H and 13C NMR spectra were similar to those of compound 1, apart from two additional signals of a methyl at δH 1.30 (t, J = 7.1 Hz) and of two methylene protons at δH 4.20 (q, J = 7.1 Hz). The IR spectrum indicated the presence of an ester carbonyl at νmax 1700 cm−1 and the extra methylene signal attributed in HMQC spectrum to the carbon at δC 59.6, indicating the attachment to an oxygen. The spectroscopic information suggested that the acid in compound 1 was replaced with an ethyl ester group. HRESIMS spectrum confirmed the molecular formula of C18H24O4 by showing the mass ion peak at m/z 327.1579 [M + Na]+. In addition, the negative specific rotation observed for compound 3 confirmed the absolute configuration at C-9 and C-10 as 9S, 10S, as shown in the Fig. 1. Compound 3 is given the trivial name of (−)-oudemansin A ethyl ester.
Compound 5 was obtained as a pale yellow oil and revealed the molecular formula C19H26O5 by showing the mass ion peak at m/z 357.1670 [M + Na]+ in HRESIMS spectrum. The 1H and 13C NMR spectroscopic data (Table 1) of compound 5 were similar to those of oudemansin X (4),12,13 except the absence of a methoxy signal and the presence of a triplet methyl at δH 1.16 and a quartet methylene protons at δH 4.05. The similar pattern of the additional signals to those appeared for compound 3 together with the negative specific rotation ([α]25D −16.8) indicated that compound 5 had the absolute configuration at C-9 and C-10 as “S” and “S”, respectively (Fig. 1). Thus, compound 5 is named (−)-oudemansin X ethyl ester.
Compound 6 was obtained as a pale yellow oil and gave the molecular formula C15H16O3, determined from the mass ion peak at m/z 267.0992 [M + Na]+ in HRESIMS spectrum. The IR spectrum showed a strong carbonyl absorption at νmax 1746 cm−1, suggesting a presence of a γ-lactone ring. The 1H and 13C NMR spectroscopic data (Table 2) were almost identical to those of γ-lactone of noroudemansin A, which was previously synthesized by Engler-Lohr and coworkers.19 The extensive 2D NMR spectroscopic analyses, including HMQC, HMBC, and COSY data, confirmed the structural identity of compound 6 to that of documented γ-lactone derived from noroudemansin A, except that the smaller coupling constant of J9H,10H (5.1 Hz) was observed, compared with the reported data (J9H,10H = 7.3 Hz) for noroudemansin A.19 The evidence suggested the difference of the stereogenic centers at C-9 and C-10 in the γ-lactone moiety. Moreover, NOESY spectrum showed the cross-peak correlations from H-8 to H-10 and from H-9 to H-7 and H3-14, indicating the cis-relationship between H-9 and H3-14. Compound 6 should derive from the same biosynthetic pathway as those of compounds 1–5, the absolute configuration at C-10 was then assigned as “S”. The absolute configuration at C-9 was then determined to be “R”, suggested by aforementioned NOESY spectroscopic data. Thus, the chemical structure of compound 6 with absolute configurations at C-9 and C-10 as 9R, 10S was depicted in the Fig. 1. As suggested by chemdraw, the dihedral angle of approx. 125 degree between H-9 and H-10 of compound 6 resulted in a smaller coupling constant than that of γ-lactone from noroudemansin A, which had approx. 25 degree of dihedral angle. The result was assured by the Karplus equation20 and the conformational study on α-methylene-γ-butyrolactones.21 In addition, the positive specific rotation ([α]28D +96.9) was observed for compound 6, while the negative specific rotation ([α]25D −56.5) was reported for γ-lactone derived from noroudemansin A with the absolute configurations at C-9 and C-10 as S and S, respectively.19 Therefore, compound 6 is given the trivial name of (+)-oudemansin A lactone and could possibly derive from compound 1.
Position | 6a | 7a | 8a | 9b | ||||
---|---|---|---|---|---|---|---|---|
δC, type | δH, mult. (J in Hz) | δC, type | δH, mult. (J in Hz) | δC, type | δH, mult. (J in Hz) | δC, type | δH, mult. (J in Hz) | |
a Recorded in acetone-d6, 400 MHz for 1H NMR and 100 MHz for 13C NMR.b Recorded in acetone-d6, 500 MHz for 1H NMR and 125 MHz for 13C NMR.c Data given from 1H decoupling experiment recorded in acetone-d6. | ||||||||
1,5 | 127.6, CH | 7.50, d (7.3) | 127.9, CH | 7.43, d (8.7) | 127.4, CH | 7.48, d (7.4) | 126.5, CH | 7.49, d (7.6) |
2,4 | 129.5, CH | 7.35, dd (7.7, 7.3) | 114.1, CH | 6.91, d (8.7) | 129.5, CH | 7.34, t (7.4) | 128.5, CH | 7.34, t (7.6) |
3 | 128.9, CH | 7.28, t (7.7) | 159.9, C | 128.5, CH | 7.25, t (7.4) | 127.6, CH | 7.25, t (7.6) | |
6 | 137.3, C | 129.0, C | 137.9, C | 136.9, C | ||||
7 | 132.9, CH | 6.71, d (15.9) | 131.8, CH | 6.64, d (15.8) | 133.4, CH | 6.60, d (16.0) | 132.9, CH | 6.64, d (16.0) |
8 | 128.6, CH | 6.35, dd (15.9, 7.1) | 125.2, CH | 6.17, dd (15.8, 7.4) | 129.7, CH | 6.21, dd (16.0, 7.3) | 128.5, CH | 6.21, dd (16.0, 7.6) |
9 | 85.6, CH | 4.59, dd (7.1, 5.1)c | 85.0, CH | 4.54, ddd (7.4, 5.3, 0.9)c | 85.1, CH | 3.69, dd (7.3, 4.3) | 83.9, CH | 3.80, dd (7.6, 4.6)c |
10 | 39.2, CH | 3.00, ddq (6.9, 5.1, 2.4)c | 38.3, CH | 2.97, ddq (6.9, 5.3, 2.4)c | 39.3, CH | 2.09, ddq (7.5, 7.0, 4.3)c | 38.0, CH | 2.02, ddq (7.0, 6.5, 4.6)c |
11 | 109.3, C | 108.5, C | 51.5, CH | 2.68, dt (7.5, 6.6)c | 50.8, CH | 2.75, dt (6.5, 6.4)c | ||
12 | 158.2, CH | 7.29, d (2.4) | 157.1, CH | 7.28, d (2.4) | 62.0, CH2 | 3.78, d (6.6) | 61.7, CH2 | 3.77–3.82, m |
13 | 171.7, C | 170.8, C | 175.5, C | 173.9, C | ||||
14 | 17.5, CH3 | 1.30, d (6.9) | 16.4, CH3 | 1.28, d (6.9) | 12.3, CH3 | 0.99, d (7.0) | 11.5, CH3 | 0.95, d (7.0) |
15 | 62.5, CH3 | 3.94, s | 61.5, CH3 | 3.93, s | ||||
3-OCH3 | 54.7, CH3 | 3.80, s | ||||||
9-OCH3 | 57.0, CH3 | 3.23, s | 55.9, CH3 | 3.27, s | ||||
13-OCH3 | 51.5, CH3 | 3.63, s | 50.4, CH3 | 3.63, s |
Compound 7 was obtained as a colorless solid and had a melting point of 94.0–95.8 °C. HRESIMS data established the molecular formula C16H18O4, corresponding to the mass ion peak at m/z 297.1093 [M + Na]+. The IR spectrum also displayed a strong carbonyl absorption of a γ-lactone ring at νmax 1745 cm−1. The 1H and 13C NMR spectroscopic data (Table 2) were similar to those of compound 6, apart from the pattern of para-substituted benzyl ring and an extra methoxy signal at δH 3.80 (δC 54.7). The HMBC spectrum showed correlation from the additional methoxy signal to one of the aromatic carbon at δC 159.9 (C-3). The cis-relationship between H-9 and H3-14 of compound 7 was disclosed by a cross peak correlation in the NOESY spectrum. In addition, compound 7 showed similar CD spectrum to that of compound 6 and gave the specific rotation of +133.0, versus specific rotation of +96.9 reported for the absolute configuration as 9R, 10S of lactone 6. Thus, the absolute configurations at C-9 and C-10 of compound 7 were assigned to be the same as those for compound 6 (9R and 10S). (+)-Oudemansin X lactone is given as the trivial name for compound 7.
Compounds 8 and 9 were obtained as pale yellow oil. Both gave the same molecular formula C16H22O4, established by HRESIMS data. Their 1H NMR spectra were almost identical, except that of the methylene protons (H2-12) in compound 8 which appeared as a doublet, whereas those in 9 were shifted slightly downfield and superimposed with H-9. From HPLC analyses, compound 8 possessed higher polarity than compound 9 in the same solvent system. Both 1H and 13C NMR spectroscopic data (Table 2) were similar to those of oudemansin A (2), except for the absence of an olefinic methine proton and a methoxyl signal and the presence of an additional sp3 methine proton and oxymethylene protons. The additional signals attributed in HMQC spectrum to methine (δC 51.5 and 50.8, C-11) and methylene carbons (δC 62.0 and 61.7, C-12). In the COSY spectrum, the methine at H-11 was coupled to H-10 and H2-12. The HMBC spectrum showed partial correlations from H-11 to C-9, C-10, C-12, C-13, and C-14; from H2-12 to C-10, C-11, and C-13; and from H3-14 to C-9, C-10, and C-11. The spectroscopic information suggested that compounds 8 and 9 were reduced forms of oudemansin A (2). The methine signal at H-10 in compounds 8 and 9 resonated at higher field than that of compound 2 because H-10 in compound 2 was at the allylic position. The configuration of double bond at C-7 of both compounds was trans- because of the same coupling constant of 16.0 Hz. The significant difference between compounds 8 and 9 was that the coupling constant between H-10 and H-11 as verified by the 1H decoupling experiment at H-12. The coupling constants between H-10 and H-11 in compounds 8 and 9 were 7.5 Hz and 6.5 Hz, indicating trans- and cis-relationship, respectively, due to a result of small difference in the dihedral angles. Reaction of both compounds (8 and 9) with p-TsCl in a presence of NEt3 and DMAP, and then followed by treatment with DBU yielded compound 23 (Scheme 1), confirmed by 1H NMR and HRESIMS data. Compound 23 gave the negative specific rotation ([α]25D −43.5), indicating that the absolute configurations at C-9 and C-10 were both S, same as those reported for (−)-oudemansins.8,10–13 In addition, the opposite specific rotations given by compounds 8 ([α]26D +12.1) and 9 ([α]26D −11.9) were observed for the difference of stereochemistry at C-11. Together with the difference in the coupling constants between H-10 and H-11 of both compounds, the absolute configurations at C-11 in compounds 8 (J = 7.5 Hz) and 9 (J = 6.5 Hz) were assigned as “S” and “R”, respectively. Therefore, the chemical structures of compounds 8 and 9 with the absolute configurations were assigned as 9S, 10S, 11S and 9S, 10S, 11R (Fig. 1). (+)-Dihydrooudemansinol and (−)-11-epidihydrooudemansinol are given as trivial names for compounds 8 and 9, respectively.
Compound 10 was obtained as a colorless oil. HRESIMS established the molecular formula C13H16O2, deduced from the mass ion peak at m/z 227.1054 [M + Na]+ in HRESIMS spectrum. The 1H NMR spectrum gave signals of a methyl at δH 1.33 (s), a methylene at δH 2.02 (dd, J = 8.1, 6.7 Hz), two non-equivalent oxymethylene protons at δH 3.81 (dt, J = 13.6, 6.7 Hz) and 4.04 (dt, J = 13.6, 8.1 Hz), an oxymethine at δH 4.02 (d, J = 7.2 Hz), two methine at δH 6.35 (dd, J = 16.0, 7.2 Hz) and 6.62 (d, J = 16.0 Hz), and five aromatic protons at δH 7.23 (1H, t, J = 7.6 Hz), 7.32 (2H, t, J = 7.6 Hz), and 7.45 (2H, d, J = 7.6 Hz). The 13C NMR spectrum (Table 3) gave 11 signals, which differentiated by DEPT-135 spectrum, consisting of one methyl, two methylene, one oxymethine, five sp2 methine, and two quaternary carbons. The COSY spectrum showed three spin systems from H-1–H-5, H-7–H-9, and H2-11–H2-12. The HMBC spectrum showed the correlations from H-8 to C-6, C-9, and C-10; from H-9 to C-7, C-12, and C-14; from H2-11 to C-9, C-10, C-12, and C-14; from H2-12 to C-9, C-10, and C-11; from H3-14 to C-9, C-10, and C-11; and from 10-OH to C-9, C-10, C-11, and C-14. The coupling constant of 16.0 Hz between H-7 and H-8 indicated the configuration of the double bond as trans-. The relative stereochemistry of compound 10 was proposed based on the NOEDIFF experiments; the signals of the olefinic proton at H-7 and methyl protons at H3-14 were enhanced upon irradiation at H-9, indicating H3-14 and H-7 were syn-facial. Therefore, compound 10 has the chemical structure as shown in Fig. 1 and is named (+)-xeruhydrofuranol.
Position | 10a | 11a | ||
---|---|---|---|---|
δC, type | δH, mult. (J in Hz) | δC, type | δH, mult. (J in Hz) | |
a Recorded in acetone-d6, 400 MHz for 1H NMR and 100 MHz for 13C NMR.b Data given from 1H decoupling experiment recorded in acetone-d6. | ||||
1,5 | 127.4, CH | 7.45, d (7.6) | 127.3, CH | 7.44, d (7.5) |
2,4 | 129.4, CH | 7.32, t (7.6) | 129.4, CH | 7.32, t (7.5) |
3 | 128.2, CH | 7.23, t (7.6) | 128.2, CH | 7.23, t (7.5) |
6 | 138.4, C | 138.3, C | ||
7 | 133.1, CH | 6.62, d (16.0) | 131.4, CH | 6.59, d (15.9) |
8 | 127.9, CH | 6.35, dd (16.0, 7.2) | 129.4, CH | 6.24, dd (15.9, 6.5) |
9 | 88.3, CH | 4.02, d (7.2) | 89.0, CH | 4.21, d (6.5) |
10 | 79.2, C | 80.1, C | ||
11 | 42.2, CH2 | 2.02, dd (8.1, 6.7)b | 41.5, CH2 | 2.05 (overlapped with acetone-d6 signal), 1.98, dt (11.8, 8.2)b |
12 | 66.4, CH2 | 4.04, dt (13.6, 8.1)b, 3.81, dt (13.6, 6.7)b | 66.6, CH2 | 3.95, dd (8.2, 6.0)b |
14 | 24.4, CH3 | 1.33, s | 24.1, CH3 | 1.26, s |
10-OH | 3.63, s | 3.98, s |
Compound 11 was obtained as a colorless oil and had the same molecular formula as that of compound 10 by revealing the mass ion peak of m/z 227.1047 [M + Na]+ in the HRESIMS spectrum. The 1H NMR spectrum (Table 3) was similar to that of compound 10, except that the pattern of methylene signals of H2-11 and H2-12 was significantly different. From HPLC analyses, compound 10 was slightly more polar than compound 11 in the same solvent system. However, the spectroscopic evidences, including COSY, HMQC, and HMBC data, confirmed the structural identity of compounds 10 and 11. From NOEDIFF experiment, upon irradiation at H-9, the signals at H-7 and 10-OH were enhanced, while H-8 was affected when H3-14 was irradiated. The latter indicated the different stereogenic center at C-9. Therefore, compound 11 was an epimer of compound 10 and was given the trivial name of (+)-9-epixeruhydrofuranol.
Compound 12 was obtained as a yellow oil. Its molecular formula was determined to be C15H16O3 based on the mass ion peak at m/z 267.0994 [M + Na]+ in HRESIMS spectrum. The spectroscopic data were in a good agreement with the data previously reported for synthetic strobilurin A acid.22 However, this is the first report of compound 12 isolated from a natural source.
Compound 14 was obtained as a yellow oil. The molecular formula was determined to be C26H30O8, deduced from the mass ion peak at m/z 493.1843 [M + Na]+ in the HRESIMS spectrum. The IR spectrum showed broad hydroxyl absorption at ν 2500–3600 cm−1 and a carbonyl absorption at νmax 1681 cm−1, suggesting a presence of carboxylic group. The 1H NMR spectrum (Table 4) showed signals of six methyl, two sp3 methine, two sp3 oxymethine, one methylene, one oxymethylene, and three hydroxyl protons. Moreover, twelve quaternary, one sp3 oxygenated quaternary, and one carbonyl carbons were observed in the 13C NMR spectrum, which differentiated by DEPT-135 spectrum. The COSY spectrum showed cross-peak correlations of four isolated spin-systems, which included H-1/H2-11, H-3/3-CH3, H-4/4-CH3, and H-7′/7′-CH3. The HMBC spectrum showed correlations from H-3 to C-1, 3-CH3, 4-CH3, and C-4a; from H-4 to 3-CH3, 4-CH3, C-4a, C-5, and C-8a; from 3-CH3 to C-3 and C-4; from 4-CH3 to C-3, C-4, and C-4a; from 5-CH3 to C-4a, C-5, and C-6; from 6-OH to C-5, C-6, and C-7; from H2-11 to C-1, C-8a, and C-10; from H2-2′ to C-2′a, C-3′, C-6′a, and C-10; from 4′-CH3 to C-3′, C-4′, and C-5′; from 6′-CH3 to C-5′, C-6′, and C-6′a; from H-7′ to C-6′, C-6′a, 7′-CH3, and C-10; from 7′-CH3 to C-6′a, C-7′, and C-10; from 3′-OH to C-2′a and C-4′; and from 5′-OH to C-4′ and C-6′ (Fig. 2). The spectroscopic data suggested that there were two subunits linking at C-10, one of which was closely related to penicitrinol K, isolated from a marine-derived Penicillium sp.23 The remaining carboxylic carbon (δC 171.0) was placed at C-7 by comparison with the spectroscopic data of penicitrinol K.23 The zero coupling constant between H-3 and H-4 (J = 0 Hz) indicated a dihedral angle of 90 degree (Fig. 3). In addition, the key NOESY correlations (Fig. 3) from 3-CH3 to H-1 and H-4; from H-1 to H-11α; and from H-7′ to H-11β and 6′-CH3 led to the relative configurations at C-1, C-3, C-4, C-10, and C-7′. Furthermore, the co-metabolite 21 (phenol A acid) was isolated from this mushroom and could be a precursor of compound 14. The absolute configurations at C-2 and C-3 of compound 21 were identically assigned to those of the related compound, threo(2R,3S)-phenol A, by comparison of 1H NMR spectroscopic data and the specific rotations ([α]21D −14.6 of compound 21 versus [α]23D −36.8 of phenol A).17 Therefore, the complete stereochemical assignment for compound 14 could be established as 1R, 3R, 4S, 10S, 7′S (Fig. 1). The absolute configurations at C-3, C-4, and C-7′ were identical with those of previously reported citrinin and redoxcitrinin, respectively.24 Compound 14 is given the trivial name of xerucitrinic acid A.
Position | 14a | 15a | 16b | |||
---|---|---|---|---|---|---|
δC, type | δH, mult. (J in Hz) | δC, type | δH, mult. (J in Hz) | δC, type | δH, mult. (J in Hz) | |
a Recorded in acetone-d6, 500 MHz for 1H NMR and 125 MHz for 13C NMR.b Recorded in acetone-d6, 400 MHz for 1H NMR and 100 MHz for 13C NMR.c Exchangeable. | ||||||
1 | 58.6, CH | 4.91, dd (12.3, 4.7) | 66.9, CH | 4.74, dd (11.4, 6.2) | ||
2 | 78.7, CH | 3.41, dt (9.0, 6.8) | ||||
3 | 73.9, CH | 4.14, q (6.8) | 79.4, CH | 3.76, q (6.2) | 40.3, CH | 2.35, quint (6.8) |
4 | 34.9, CH | 2.83, q (6.9) | 38.8, CH | 2.85–2.92, m | 170.1, C | |
4a | 144.0, C | 146.7, C | ||||
5 | 117.1, C | 118.2, C | ||||
6 | 160.4, C | 162.0, C | 44.2, CH2 | 3.67, dt (11.1, 6.0), 3.19, dt (11.1, 6.1) | ||
7 | 97.7, C | 98.2, C | 21.5, CH2 | 1.84–1.92, m, 1.74–1.84, m | ||
8 | 148.6, C | 148.1, C | 32.2, CH2 | 2.13–2.22, m, 1.84–1.92, m | ||
8a | 110.7, C | 113.1, C | 83.0, CH | 5.22, dd (4.9, 3.4) | ||
9 | ||||||
10 | 105.7, C | 105.3, C | ||||
11 | 35.9, CH2 | 2.58, dd (12.3, 4.7), H-11α, 2.00, dd (12.3, 12.3), H-11β | 35.3, CH2 | 2.72, dd (13.0, 6.2), H-11β, 1.91, dd (13.0, 11.4), H-11α | ||
1′ | 33.5, CH2 | 2.13–2.22, m, 1.52–1.67, m | ||||
2′ | 61.6, CH2 | 4.97, d (15.3), 4.85, d (15.3) | 62.5, CH2 | 4.93, d (15.3), 4.70, d (15.3) | 25.1, CH2 | 1.52–1.67, m |
2′a | 110.7, Cc | 111.3, C | ||||
3′ | 148.1, C | 149.5, C | 29.0, CH2 | 1.31–1.44, m | ||
4′ | 110.4, Cc | 111.1, C | 32.5, CH2 | 1.96–2.03, m | ||
5′ | 152.9, C | 153.8, C | 131.3, CH | 5.35–5.47, m | ||
6′ | 113.7, C | 114.5, C | 124.4, CH | 5.35–5.47, m | ||
6′a | 131.7, C | 132.6, C | ||||
7′ | 38.4, CH | 3.32, q (6.9) | 38.5, CH | 3.32, q (7.0) | 17.0, CH3 | 1.61, br s |
3-CH3 | 17.6, CH3 | 1.36, d (6.8) | 21.8, CH3 | 1.35, d (6.2) | 12.0, CH3 | 1.07, d (6.8) |
4-CH3 | 21.2, CH3 | 1.22, d (6.9) | 19.5, CH3 | 1.24, d (7.0) | ||
5-CH3 | 9.2, CH3 | 2.08, s | 11.2, CH3 | 2.11, s | ||
6-OH | 12.32, s | 12.4, s | ||||
7-COOH | 171.0, C | 172.0, C | ||||
3′-OH | 7.36c, s | 7.32c, s | ||||
4′-CH3 | 8.3, CH3 | 2.19, s | 9.2, CH3c | 2.17(5), s | ||
5′-OH | 7.25c, s | 7.25c, s | ||||
6′-CH3 | 9.6, CH3 | 2.16, s | 10.5, CH3c | 2.17(9), s | ||
7′-CH3 | 16.8, CH3 | 1.24, d (6.9) | 17.4, CH3 | 1.26, d (7.0) |
Compound 15 was obtained as a yellow oil. HRESIMS spectrum revealed the same mass ion peak as that of compound 14. Compound 15 had a lower polarity than compound 14 in the same solvent system. The 1H NMR spectrum (Table 4) was almost identical to that of compound 14, except the upfield methine at δH 3.76 (H-3), 4.74 (H-1), and a slight shift of the non-equivalent methylene signals at δH 1.91 and 2.72. The evidences suggested they were distinct. However, 2D NMR spectroscopic data including COSY, HMQC, and HMBC provided the same information to those of compound 14 as well as the cross-peak correlations in NOESY spectrum from H-3 to 4-CH3 and from H-4 to 3-CH3. Moreover, the different cross-peak correlations in the NOESY spectrum from H-3 to H-1; and from H-11β to H-1 and 7′-CH3 suggested the different stereogenic centers at C-1 and C-10 (Fig. 3). Thus, the chemical structure of compound 15 could be depicted as 1S, 3R, 4S, 7′S, 10R (Fig. 1). Compound 15 was given a trivial name of xerucitrinic acid B. However, it should be noted that compounds 14 and 15 were not quite stable, they slowly decomposed.
A plausible biosynthetic pathway of compounds 14 and 15 was proposed via citrinin biosynthesis (Scheme 2).25–29 A biogenetic precursor of citrinin, known as redoxcitrinin,28,30 would presumably be involved in the biosynthesis by a conjugate addition with citrinin to provide intermediate A. Redoxcitrinin was earlier isolated as co-metabolite from the marine fungus Penicillium sp., along with citrinin and phenol A acid.30 Then, intermediate A underwent aldehyde reduction (intermediate B) and ring cyclization31 to form spiroketal compounds 14 and 15, which explained the possibility of having different configurations at C-1 and C-10 of both compounds. Both compounds 14 and 15 can be categorized in the azaphilones family that has citrinin as a core structure. Azaphilones containing citrinin moiety have been widely produced from various fungal genera such as Penicillium, Monascus, and Aspergillus.32
Compound 16 was obtained as a yellow oil. HRESIMS data revealed the mass ion peak at m/z 274.1767 [M + Na]+ for the molecular formula to be C15H25NO2. The 1H and 13C NMR spectroscopic data (Table 4) of compound 16 were similar to those of 2-(E-hept-5-en-1-yl)-3-methyl-6,7,8,8a-tetrahydro-4H-pyrrolo[2,1-b][1,3]oxazin-4-one (17),15 apart from the absence of a singlet methyl signal and the presence of a double methyl signal at δH 1.07, a quintet methine at δH 2.35, and a doublet of triplets oxymethine signal at δH 3.41. In the HMQC spectrum, two extra methine signals attributed to the carbons at δC 40.3 and 78.7. The spectroscopic information indicated the absence of double bond at C-2/C-3 in compound 17. The rest of the structure was secured by 2D NMR spectroscopic analyses (COSY, HMQC, and HMBC). The E-configuration of the double bond at C-5′ was suggested by the chemical shift of an allylic carbon at C-7′ (δC 17.0), compared to the previously reported data for trans-allylic carbons.16,33,34 The NOESY spectrum showed cross-peak correlations from H-2 to 3-CH3; and from H-8a to H-3 and H2-1′. Therefore, the relative stereochemistry of compound 16 was assigned as 2R*, 3R*, 8aR* (Fig. 1). Thus, compound 16 was (2R,3R,8aR)-2-(E-hept-5-en-1-yl)-3-methyltetrahydro-2H-pyrrolo[2,1-b][1,3]oxazin-4(3H)-one.
Compounds | Anti-P. falciparumb (IC50, μM) | Anti-B. cereusc (MIC, μg mL−1) | Anti-C. albicansd (IC50, μM) | Anti-phytopathogenicd (MIC, μg mL−1) | Cytotoxicityd (IC50, μM) | |||||
---|---|---|---|---|---|---|---|---|---|---|
A. brassicicola | C. capsici | C. gloeosporioides | MCF-7 | KB | NCI-H187 | Vero | ||||
a Antimicrobial activity against other organisms using a different method was reported in the literature.b Maximum tested concentration was done at 10 μg mL−1.c Maximum tested concentration was done at 25 μg mL−1.d Maximum tested concentration was done at 50 μg mL−1. | ||||||||||
2a | 9.23 | >25 | 137.45 | 50.00 | 25.00 | >50 | 120.13 | 160.18 | 63.30 | 26.73 |
3 | >32.85 | 25.00 | >164.26 | >50 | 25.00 | >50 | >164.26 | >164.26 | 57.03 | 108.18 |
4a | 1.19 | 25.00 | 129.78 | 25.00 | 25.00 | >50 | >156.06 | >156.06 | 99.07 | 85.90 |
5 | 13.70 | 25.00 | >149.52 | 50.00 | 12.50 | 25.00 | >149.52 | >149.52 | 65.46 | 67.19 |
6 | >40.93 | >25 | >204.67 | >50 | >50 | >50 | >204.67 | >204.67 | 198.33 | >204.67 |
10 | >48.95 | >25 | >244.77 | >50 | >50 | >50 | >244.77 | >244.77 | 203.85 | >244.77 |
12 | >40.93 | 25.00 | >204.67 | >50 | >50 | >50 | >204.67 | >204.67 | >204.67 | >204.67 |
13 | >53.12 | 25.00 | >265.58 | >50 | >50 | >50 | >265.58 | 231.10 | >265.58 | >265.58 |
14 | >21.25 | 12.50 | >106.27 | >50 | >50 | >50 | >106.27 | >106.27 | >106.27 | >106.27 |
17 | >40.10 | 25.00 | 191.62 | >50 | >50 | >50 | >200.52 | >200.52 | 191.26 | 117.71 |
Dihydroartemisinin | 2.83 × 10⁻³ | — | — | — | — | — | — | — | — | — |
Mefloquine | 0.04 | — | — | — | — | — | — | — | — | — |
Vancomycin | — | 2.00 | — | — | — | — | — | — | — | — |
Amphotericin B | — | — | 0.21 | 1.56 | 1.56–3.13 | 1.56–3.13 | — | — | — | — |
Ellipticine | — | — | — | — | — | — | — | 5.48 | 7.23 | 5.56 |
Doxorubicin | — | — | — | — | — | — | 13.56 | 0.96 | 0.20 | — |
Tamoxifen | — | — | — | — | — | — | 18.06 | — | — | — |
Compounds 1, 7–9, 11, 16, and 18–22 were inactive in our biological assays at maximum tested concentration. Compounds 2, 4, and 5 exhibited anti-P. falciparum with IC50 values in a range of 1.19–13.70 μM and showed anti-phytopathogenic activity against A. brassicicola and C. capsici with MIC values ranging from 12.5–50.0 μg mL−1. Compound 3 was active against C. capsici, while compound 5 was active against C. gloeosporioides with the same MIC value of 25.0 μg mL−1. Compounds 2, 4, and 17 displayed weak antifungal activity against C. albicans with IC50 values in a range of 129.78–191.62 μM (Table 5). All compounds (except compounds 2, 6, and 10) exhibited anti-B. cereus with MIC values ranging from 12.5–25.0 μg mL−1 and showed weak cytotoxicity against both cancerous and non-cancerous cells (Table 5).
(−)-Oudemansin A (2) and (−)-oudemansin X (4) were originally isolated from Basidiomycete Oudemansiella mucida10 and O. radicata,12 respectively. The biological activity of both compounds was suggested to be due to the presence of an (E)-β-methoxyacrylate moiety. Both compounds exhibited a broad range of antifungal properties towards several fungi such as Paecilomyces variotii, Rhodotorula glutinis, Saccharomyces cerevisiae.10,12 (3Z,5E)-3-Methyl-6-phenylhexa-3,5-dien-1-ol (13) was formerly isolated from the fungus Bolinea lutea and proposed to be a precursor or a side-product during the biosynthesis of strobilurin A.14 2-(E-Hept-5-en-1-yl)-3-methyl-6,7,8,8a-tetrahydro-4H-pyrrolo[2,1-b][1,3]oxazin-4-one (17) was previously isolated from Penicillium brevicompactum Dierckx.15 Compound 17 displayed insecticidal activity against the fourth-instar milkweed bug, Oncopeltus fasciatus (Dallas), with a LD50 value of 20 μg mL−1 and also inhibited more than 40% mycelial growth at 100 μg mL−1 of various plant phytopathogens e.g., Fusarium culmorum, Colletotrichum coccodes, Alternaria tenuis, Penicillium italicum.35 Scalusamides A–C (18–20) were originally isolated from the marine-derived fungus Penicillium citrinum N055.16 Only scalusamide A had antifungal against Cryptococcus neoformans and antibacterial against Micrococcus luteus activities with MIC values of 16.7 and 33.3 μg mL−1, respectively.16 Moreover, phenol A acid (21) and dihydrocitrinone (22) were previously isolated from Penicillium citrinum MST-F1013036 and Aspergillus terreus Thom,37 respectively. Compounds 21 and 22 displayed enzyme-inhibitory activity against cathepsin B with IC50 values of 20.4 ± 1.9 and 28.5 ± 1.7 μM, respectively, while compound 21 also exhibited antifouling activity against Bugula neritina larvae settlement with an EC50 value of 14.35 ± 1.72 μg mL−1.38
After the cultivation period, the broth and cells were separated by simple filtration. The culture broth was then extracted three times with equal volume of EtOAc. The combined organic layer was dried over Na2SO4 and evaporated to dryness to provide a brown gum (3.4 g). The cells were macerated in MeOH (1 L) for 3 days and then in CH2Cl2 (1 L) for 3 days. Organic solvents were combined and concentrated under reduced pressure. Water (100 mL) was added and the mixture was then extracted three times with equal volume of EtOAc. The combined organic layer was dried over Na2SO4 and then evaporated in vacuo to give a brown gum (2.1 g).
The crude extract from broth (3.4 g) was passed through a Sephadex LH20 column (4.5 cm × 40 cm) using 100% MeOH as an eluent to give 8 fractions. The first and sixth–eighth fractions were discarded due to an absence of organic material of interest. The second fraction (1.6 g) was further fractionated by a Sephadex LH20 column (4.5 cm × 40 cm) eluted with 100% MeOH to provide 8 subfractions (2.1–2.8). Purification of subfraction 2.4 (0.6 g) by a preparative HPLC using a linear gradient elution of 30–70% aqueous MeCN over 40 min obtained compounds 18 (0.2 g), 19 (17.5 mg), and 17 (11.0 mg), respectively. Subfraction 2.5 (0.3 g) was purified by a preparative HPLC using a linear gradient elution of 30–70% aqueous MeCN over 40 min to give compounds 18 (67.0 mg), 19 (7.0 mg), 8 (3.4 mg), 20 (8.7 mg), 16 (6.1 mg), 17 (11.0 mg), 2 (2.5 mg), and 3 (10.4 mg), respectively. The third fraction (2.2 g) was passed through a Sephadex LH20 column (4.5 cm × 40 cm) eluted with 100% MeOH to yield 7 subfractions (3.1–3.7). Subfraction 3.3 (0.5 g) was further purified by a preparative HPLC using a linear gradient elution of 30–70% aqueous MeCN over 40 min to obtain compounds 18 (0.2 g), 19 (13.8 mg), 20 (14.7 mg), 16 (7.7 mg), 17 (17.8 mg), 2 (4.7 mg), and 3 (10.4 mg), respectively. Subfraction 3.4 (1.2 g) was subjected to a Sephadex LH20 column (4.5 cm × 40 cm) eluted with 100% MeOH to give 3 subfractions (3.4.1–3.4.3). Compound 18 (0.1 g) was obtained from subfraction 3.4.2 and subfraction 3.4.3 (1.0 g) was further purified by a preparative HPLC using a linear gradient elution of 30–70% aqueous MeCN over 45 min to provide 25 subfractions (3.4.3.1–3.4.3.25), from which compounds 8 (37.4 mg), 9 (53.7 mg), 1 (12.9 mg), 17 (28.0 mg), 2 (91.9 mg), and 3 (43.7 mg) were obtained in subfractions 3.4.3.12, 3.4.3.13, 3.4.3.14, 3.4.3.17, 3.4.3.18, and 3.4.3.21, respectively. Subfraction 3.4.3.8 (76.8 mg) was then purified by a preparative thin layer chromatography (PLC) eluted with 25% EtOAc in n-hexane to afford compounds 10 (33.5 mg) and 11 (7.3 mg). Subfractions 3.5 (0.4 g) was separated by a preparative HPLC using a linear gradient elution of 30–70% aqueous MeCN over 40 min to give 37 subfractions (3.5.1–3.5.37). Compounds 8 (7.1 mg), 9 (10.2 mg), 13 (8.3 mg), 7 (26.7 mg), 6 (13.7 mg), and 2 (8.1 mg) were obtained from the subfractions 3.5.17, 3.5.18, 3.5.22, 3.5.24, 3.5.25, and 3.5.30, respectively. Subfraction 3.5.10 (19.8 mg) was further purified by a PLC eluted with 25% EtOAc in n-hexane to furnish compounds 10 (8.8 mg) and 11 (4.7 mg), respectively. The fourth fraction (0.3 g) was applied to a preparative HPLC using a linear gradient elution of 30–70% aqueous MeCN over 40 min to provide 24 subfractions (4.1–4.24). Compounds 12 (9.1 mg) and 13 (6.7 mg) were obtained from subfractions 4.15 and 4.17, respectively. Purification of subfraction 4.8 (11.3 mg) by a PLC eluted with 25% EtOAc in n-hexane furnished compounds 10 (2.7 mg) and 11 (1.9 mg). After purification by a PLC eluted with 20% EtOAc in n-hexane, compounds 6 (2.6 mg) and 7 (5.6 mg) were respectively obtained from subfraction 4.18 and compound 2 (1.5 mg) was obtained from subfraction 4.22. The fifth fraction (0.1 g) was subjected to the same protocol as for the fourth fraction to provide compounds 7 (1.4 mg), 14 (6.3 mg), and 15 (1.9 mg), respectively. The sixth fraction (54.7 mg) was purified by a preparative HPLC using a linear gradient elution of 5–70% aqueous MeCN over 40 min to furnish compounds 21 (5.9 mg), 22 (1.9 mg), and 14 (1.3 mg), respectively.
The crude extract from cells (2.1 g) was passed through a Sephadex LH20 column (4.5 cm × 40 cm) eluted with 100% MeOH to afford 9 fractions. Fractions 1–6 were discarded due to no compounds of interest. The seventh fraction (0.6 g) was applied to a preparative HPLC using a linear gradient elution of 30–70% aqueous MeCN over 40 min to provide 14 subfractions (7.1–7.14). Compounds 18 (9.9 mg), 8 (2.2 mg), 9 (3.4 mg), 17 (3.3 mg), 4 (6.4 mg), 2 (32.7 mg), and 3 (33.5 mg) were given from subfractions 7.4, 7.5, 7.6, 7.8, 7.9, 7.10, and 7.12, respectively. Subfraction 7.11 (17.8 mg) was further purified by a PLC eluted with 15% EtOAc in n-hexane to give 5 (7.4 mg). After purification of the eighth fraction (0.5 g) by a preparative HPLC using a linear gradient elution of 30–70% aqueous MeCN over 40 min, compounds 18 (5.6 mg), 8 (4.9 mg), 9 (3.9 mg), 1 (2.6 mg), 7 (2.5 mg), 4 (23.3 mg), 2 (73.3 mg), 5 (16.5 mg), and 3 (32.7 mg) were respectively obtained. The ninth fraction (0.3 g) was subjected to the same protocol as for the eighth fraction to furnish compounds 8 (2.1 mg), 9 (1.9 mg), 1 (2.0 mg), 7 (18.1 mg), 4 (10.3 mg), 2 (30.8 mg), 5 (5.3 mg), and 3 (15.4 mg), respectively.
aThe coupling constants were determined by 1H decoupling experiments recorded in acetone-d6.
Compound 23 was also prepared from compound 9 by using the same protocol as for compound 8.
Footnote |
† Electronic supplementary information (ESI) available: 1D, 2D NMR and mass spectra of all new isolated compounds (1, 3, 5−12, and 14–16). See DOI: 10.1039/c6ra21898a |
This journal is © The Royal Society of Chemistry 2016 |