DOI:
10.1039/C6RA21692G
(Paper)
RSC Adv., 2016,
6, 95879-95887
Evaluation of Fe3+ fixation into montmorillonite clay and its application in the polymerization of ethylenedioxythiophene†
Received
30th August 2016
, Accepted 1st October 2016
First published on 3rd October 2016
Abstract
Modification of natural montmorillonite can be achieved efficiently through Fe3+ fixation using solutions of Fe(ClO4)3 in NaClO4. An analysis of the process by a pseudo-second order model allowed us to establish that Fe3+ sorption into montmorillonite is a chemical process that involves an exchange of cations from the montmorillonite interstitial space between layers. The presence of Fe3+ on the interstitial space between layers was determinated by XPS (X-ray photoelectron spectroscopy). The oxidant properties of the modified montmorillonite were evaluated by the polymerisation of ethylenedioxythiophene (EDOT) to generate polyethylenedioxythiophene (PEDOT)–clay, which is a semiconductor material.
1. Introduction
Clay is a soil mineral fraction with particle size <2 μm,1 which can contain the following: (i) minerals, such as smectite or montmorillonite, vermiculite, kaolinite, and illite; (ii) tectosilicates, such as quartz and feldspar, (iii) metal oxides and (iv) hydroxides, among others. Montmorillonite is extracted from different regions all over the world, and, chemically, it is described as a 2![[thin space (1/6-em)]](https://www.rsc.org/images/entities/char_2009.gif) :
:![[thin space (1/6-em)]](https://www.rsc.org/images/entities/char_2009.gif) 1 clay, meaning that it has two (SiO4)4− tetrahedral sheets sandwiching a central octahedral layer of aluminium hydroxide Al2(OH)6. The structure contains an interstitial space between the layers, where mobile hydrated cations or water can be incorporated (Fig. 1).
1 clay, meaning that it has two (SiO4)4− tetrahedral sheets sandwiching a central octahedral layer of aluminium hydroxide Al2(OH)6. The structure contains an interstitial space between the layers, where mobile hydrated cations or water can be incorporated (Fig. 1).
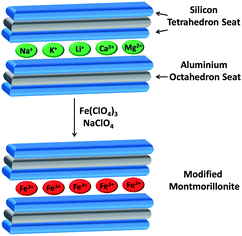 |
| | Fig. 1 Schematic representation of incorporation of Fe3+ into montmorillonite clay. | |
Montmorillonite has been recognized for exchanging cations from its layered matrix and its capacity for incorporating cations not present in the natural structure with a high efficiency rate.2 The cation exchange results in charge asymmetry due to replacements of Al3+ for Si4+ in the tetrahedral layer and Mg2+ for Al3+ in the octahedral layer, producing a net negative charge on the clay surfaces compensated by the cations. Montmorillonite's interstitial space between layers normally contains Na+, K+, Li+, Ca2+ and Mg2+ as charge compensating cations.3 Dry clay contains these cations on the hexagonal cavities of silica layers, but when treated with water, they reallocate into the interlaminar region and can be easily exchanged by different metallic and non-metallic cations, such as H3O+, NH4+, Al3+, Fe3+, R4N+, and R4P+, giving rise to cation modified montmorillonites,3,4 which have been employed in the treatment of metal contaminated water, degradation of organic molecules,5 design of electrochemical biosensors incorporating electrodes modified with clay minerals and as heterogeneous catalysts for organic reactions.6,7
In the present work, we report a detailed study of Fe3+ fixation into natural montmorillonite. Then, we focused on the polymerisation of ethylenedioxythiophene (EDOT) in the presence of modified clay to generate a semiconductor material that has a structure formed by montmorillonite clay and poly(3,4-ethylenedioxythiophene) (PEDOT). Semiconducting polymer modified clays8 have been synthesized to enhance the stability of the organic molecules or ameliorate the conductivity.9 PEDOT is an electrical conducting polymer that has demonstrated great stability, a moderate band gap, low redox potential and high optical transparency.10 The classical synthesis of nanocomposite montmorillonite–PEDOT11 consists of a chemical12 or electrochemical13 oxidative polymerization of the corresponding monomer in the presence of clay using iron salts as catalysts. Despite the astonishing development in the field of polymerisation of EDOT onto clays in the presence of an external source of iron, the use of clay enriched with iron to trigger the polymerisation has not been explored. In this work, we choose to use an internal source of Fe3+ to trigger the polymerisation of EDOT.14
2. Results and discussion
2.1 Kinetic study of iron fixation onto montmorillonite
First, we evaluated the maximum sorption of Fe3+ into montmorillonite at a constant temperature (20 °C) using different cation concentrations to clarify the nature of the process. The sorption experiments were confined to a pH of 1.5 to avoid precipitation of Fe3+–hydroxide. Fig. 2 represents a plot of the amount of iron metal ion sorbed (mg g−1) versus contact time for different initial metal ion concentrations (50, 530, 6320, and 75![[thin space (1/6-em)]](https://www.rsc.org/images/entities/char_2009.gif) 500 mg L−1). From these plots, it is found that the amount of sorbate (iron cation) per gram of sorbent (montmorillonite) increases with contact time at all initial metal ion concentrations, and equilibrium is attained after 4 h. Because of these results, we postulated that the initial rapid uptake is most likely to take place at the active sites on the surface; however, as the surface sites become saturated with Fe3+, the ions slowly diffuse into the interior resulting in a gradual approach towards equilibrium.
500 mg L−1). From these plots, it is found that the amount of sorbate (iron cation) per gram of sorbent (montmorillonite) increases with contact time at all initial metal ion concentrations, and equilibrium is attained after 4 h. Because of these results, we postulated that the initial rapid uptake is most likely to take place at the active sites on the surface; however, as the surface sites become saturated with Fe3+, the ions slowly diffuse into the interior resulting in a gradual approach towards equilibrium.
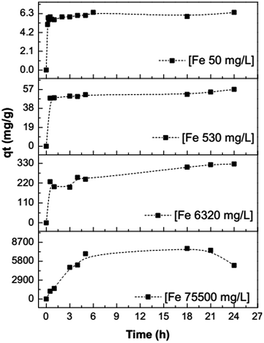 |
| | Fig. 2 The experiments used to evaluate the maximum sorption of Fe3+ into montmorillonite. | |
Iron sorption kinetics at different concentrations adjusted well (R2 ≈ 1) to a pseudo-second order model (Fig. 3), showing that there is a chemisorption process of Fe3+ into the montmorillonite at concentrations of 50, 530, and 6320 mg L−1. At a concentration of 75![[thin space (1/6-em)]](https://www.rsc.org/images/entities/char_2009.gif) 500 mg L−1, the R2 coefficient is low (0.90), which could indicate that iron fixation at this concentration begins via a chemisorption mechanism; however, once the montmorillonite interstitial layer is saturated, iron suffers physical sorption on the layer cavities because there is iron desorption after 18 h. The constants calculated for the pseudo-second order model of the sorption of Fe3+ ions on montmorillonite are provided in Table 1.
500 mg L−1, the R2 coefficient is low (0.90), which could indicate that iron fixation at this concentration begins via a chemisorption mechanism; however, once the montmorillonite interstitial layer is saturated, iron suffers physical sorption on the layer cavities because there is iron desorption after 18 h. The constants calculated for the pseudo-second order model of the sorption of Fe3+ ions on montmorillonite are provided in Table 1.
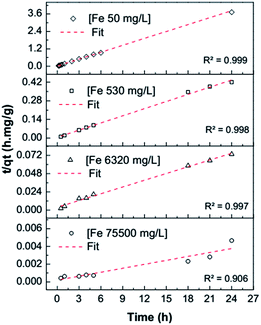 |
| | Fig. 3 Pseudo-second order model adjustment at different concentrations of Fe3+. | |
Table 1 Pseudo-second order model for sorption of Fe3+ ions on montmorillonite
| Fe3+ concentration (mg L−1) |
K2 (g mg−1 h−1) |
qe (mg g−1) |
h (mg g−1 h−1) |
R2 |
| 50 |
1.7314 |
6.3058 |
68.8 |
0.999 |
| 530 |
0.0554 |
55.69 |
171.92 |
0.998 |
| 6320 |
0.0025 |
333.17 |
279.50 |
0.997 |
75![[thin space (1/6-em)]](https://www.rsc.org/images/entities/char_2009.gif) 500 500 |
0.0001 |
6729.04 |
5140.92 |
0.906 |
The pseudo-second order model describes the chemisorption between minerals and metals, and the model was based on equilibrium sorption.15 A linear equation that describes this model is:
| |
 | (1) |
where
qt = [Fe
3+] sorbed by montmorillonite (mg g
−1),
t = time in hours,
qe = capacity of sorption equilibrium (mg g
−1),
K2 = constant of speed reaction (g mg
−1 h
−1).
The equilibrium sorption capacity (qe) and second order constant (K2) can be determined from the slope and intercept of plot t/qt versus t (eqn (1)). The constant K2 is used to calculate the initial sorption rate h at t → 0 as follows:
Thus, the rate constant K2, the initial adsorption rate h and the capacity of sorption equilibrium qe can be calculated from the plot of t/qt versus time (t) using eqn (1), where h is the initial sorption rate that is taken into the slope between zero time and equilibrium time.
After evaluating sorption at different concentrations, a 530 mg L−1 of Fe3+ concentration was selected to study in detail the thermodynamic aspects of the sorption process due to its high stability in the kinetic studies and best fit to the pseudo-second order model. The enthalpy variation (ΔH) was determined using the Ea value obtained from the Arrhenius equation linearization (eqn (3) and (4));16 both parameters allow the differentiation between a chemical or physical sorption process. Thus, the chart ln![[thin space (1/6-em)]](https://www.rsc.org/images/entities/char_2009.gif) K2 vs. T−1 allowed us to calculate from the slope the activation energy (Ea) and from the intercept the frequency factor (Ao).
K2 vs. T−1 allowed us to calculate from the slope the activation energy (Ea) and from the intercept the frequency factor (Ao).
| |
 | (3) |
| |
 | (4) |
where
K2 = constant of sorption velocity (g mg
−1 h
−1) calculated with pseudo second order
eqn (1),
Ea = activation energy necessary for sorption (kJ mol
−1),
A0 = factor of molecular collision frequency (g mg
−1 h
−1),
R = constant for gases, 8.314 (J mol
−1 K
−1),
T = absolute solution temperature (K).
Arrhenius activation energy can relate to the energy variation; although it cannot be directly deducted, a relationship can be defined using an analogy of thermodynamic arguments. The enthalpy variations for solids and liquids are obtained from eqn (5), and, for the entropy, we used eqn (6) (Eyring–Polanyi). The chart ln(K2/T) vs. T−1 allowed us to calculate from the slope the enthalpy variation (ΔH) and from intercept the entropy variation (ΔS). Finally, Gibbs free energy was calculated using eqn (7).17
| |
 | (6) |
where
K2 = constant of sorption velocity (g mg
−1 h
−1) calculated with pseudo second order
eqn (1),
T = absolute solution temperature (K),
Kb = Boltzmann constant, 1.381 × 10
−23 J K
−1,
h = Planck's constant, 6.626 × 10
−34 Js, Δ
S = entropy variation, kJ mol
−1 K
−1, Δ
H = enthalpy variation, kJ mol
−1,
R = constant for gases, 8.314 J mol
−1 K
−1.
The experiments were carried out over an interval from 0.5 h to 24 h at 20, 40 and 60 °C. Fig. 4 shows that the removal efficiency increases as the temperature rises, where the maximum adsorption (97%) is achieved at 60 °C. The augmentation of the removal efficiency by increasing the temperature is due to two factors. First, the higher temperature activates the metal ions for enhancing the sorption of the coordinating sites of the sorbent, and the metal cation moves faster. Second, there is an acceleration of some originally slow step(s) and a creation of some new activation sites on the sorbent surface.18 Fig. 5 show an adjustment to the pseudo-second order model (R2 ≈ 1); therefore, it is possible to obtain the velocity constants (K2), initial adsorption rate (h) and equilibrium sorption capacity (qe) from eqn (1). The constants calculated at various temperatures (20, 40 and 60 °C) for the pseudo-second order model of sorption of Fe3+ ions into montmorillonite are provided in Table 2.
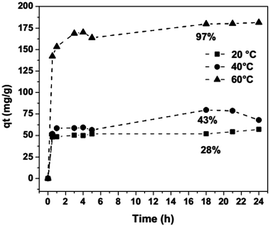 |
| | Fig. 4 Iron sorption kinetics onto montmorillonite at different temperatures, [Fe3+] = 530 mg L−1, clay 20 g L−1, pH 1.5, [NaClO4] = 0.5 M. | |
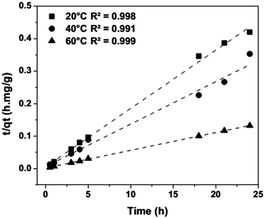 |
| | Fig. 5 Pseudo-second order model adjustment at different temperatures, [Fe3+] = 530 mg L−1, clay 20 g L−1, pH 1.5, [NaClO4] = 0.5 M. | |
Table 2 Pseudo-second order model for sorption of Fe3+ ions at different temperatures
| Temperature (°C) |
K2 (g mg−1 h−1) |
qe (mg g−1) |
h (mg g−1 h−1) |
R2 |
| 20 |
0.0554 |
55.69 |
171.92 |
0.998 |
| 40 |
0.0259 |
75.41 |
147.10 |
0.991 |
| 60 |
0.0190 |
182.90 |
636.64 |
0.999 |
The thermodynamic parameters also change with increases in the temperature; therefore, we calculated the values of ΔH, ΔS and ΔG to evaluate the sorption process (Table 3). From the logarithm of the activation energy (Ea) and using the linear Arrhenius equation treatment (eqn (4)), we calculated the enthalpy variation (ΔH). The resulting activation energy was −21.884 kJ mol−1, and ΔH was calculated to be −24.488 kJ mol−1 (Fig. 6), which indicates that the sorption process results in an exothermic chemical reaction. Thus, the Fe3+–montmorillonite sorption complex is more stable than either the montmorillonite or Fe3+ ions in an aqueous medium in isolation, indicating the formation of moderately strong bonding between Fe3+ ions and clay sorbents leading to a decrease in the overall energy of the system. Since the predictions for ΔH and ΔS are negative, ΔG will be negative at low temperatures, and the reaction proceeds spontaneously. At high temperatures, the reverse reaction becomes spontaneous. Therefore, an increase in temperature will result in a process of desorption.
Table 3 Thermodynamic parameters of Fe3+ ions sorption into montmorillonite
| Ea (kJ mol−1) |
ΔH (kJ mol−1) |
ΔS (J mol−1 K−1) |
T (K) |
ΔG (kJ mol−1) |
| −21.884 |
−24.488 |
−155.254 |
333.15 |
27.234 |
| |
|
|
313.15 |
24.129 |
| |
|
|
293.15 |
21.024 |
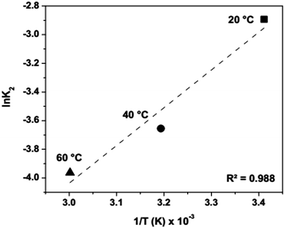 |
| | Fig. 6 Linear Arrhenius equation adjustment. | |
2.2 Characterization of the material
The chemical formula of a montmorillonite is (Na0.75Ca0.25)0.3(Al0.75Mg0.25)2Si4O10(OH)2·nH2O. The chemical compositions of natural and modified montmorillonite (Table 4) were determined by XPS (X-ray Photoelectron Spectroscopy). The obtained XPS patterns for natural (Fig. 7a) and modified montmorillonites with 530 mg L−1 of Fe3+ (Fig. 7b) are shown below.
Table 4 Atomic composition of natural and modified montmorillonites determined by XPS
| Elements |
Montmorillonite (% atomic) |
Montmorillonite hydrated with NaClO4 (% atomic) |
Montmorillonite modified with Fe3+ 50 mg L−1 (% atomic) |
Montmorillonite modified with Fe3+ 530 mg L−1 (% atomic) |
Montmorillonite modified with Fe3+ 6320 mg L−1 (% atomic) |
Montmorillonite modified with Fe3+ 75![[thin space (1/6-em)]](https://www.rsc.org/images/entities/char_2009.gif) 500 mg L−1 (% atomic) 500 mg L−1 (% atomic) |
Formula (% atomic) |
| Al 2p |
6.44 |
2.30 |
6.50 |
6.73 |
6.16 |
5.77 |
8.20 |
| Ca 2p |
1.06 |
0.96 |
0.82 |
0.68 |
0.55 |
0.49 |
0.41 |
| Fe 2p |
0.01 |
0.04 |
0.08 |
0.19 |
0.47 |
1.47 |
0.00 |
| Mg 1s |
3.20 |
1.38 |
1.93 |
0.54 |
2.04 |
0.58 |
2.73 |
| Na 1s |
3.07 |
2.94 |
3.05 |
1.98 |
1.48 |
0.57 |
1.23 |
| O 1s |
60.16 |
67.75 |
63.27 |
64.70 |
65.76 |
72.19 |
65.57 |
| Si 2p |
26.05 |
24.63 |
24.35 |
25.18 |
23.54 |
18.92 |
21.86 |
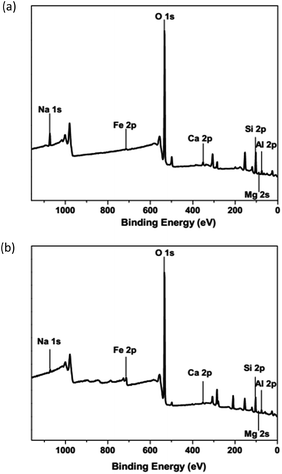 |
| | Fig. 7 XPS: (a) natural montmorillonite and (b) modified montmorillonite with Fe 530 mg L−1. | |
From those analyses, it is possible to conclude that the chemical composition of the material on the layers after iron fixation remains similar to that of natural montmorillonite (Fig. 8a).19 However, the elements on the interstitial space between layers suffer a change depending on the iron concentration (Fig. 8b). Iron fixation into the clay was accompanied by a calcium and sodium exchange. Thus, as iron content increases, a linear decrement of calcium and sodium content was evidenced by this technique.
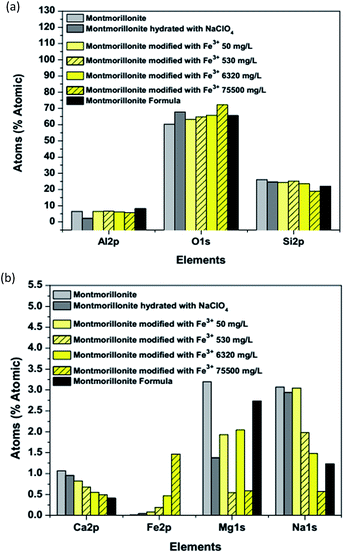 |
| | Fig. 8 The comparison of elemental content: (a) octahedron and tetrahedron layers and (b) interstitial space. | |
The FTIR (Fourier Transform Infrared Spectroscopy) spectrum of the natural montmorillonite (Fig. 9)20 shows characteristic bands at 3746 cm−1, which are associated with Al–O–H; 3623 cm−1, which are associated with crystalline –OH; 1645 cm−1, which demonstrates the presence of water molecules; 1040 cm−1, which are associated with the vibration of the Si–O characteristic in clay minerals; 917 cm−1, which are associated with –OH linked to Al3+; 845 cm−1, which are associated with –OH linked to Al3+ and Mg2+; 795 and 787 cm−1, which correspond to Si–O (quartz); 672, 624 and 472 cm−1, which are associated with Si–O–Si; and 523 cm−1, which correspond to the Si–O–Al bond. From the FTIR spectrum of montmorillonite modified with 530 mg L−1 of Fe3+ (Fig. 9), it is possible to observe that the Fe3+ incorporation is followed by hydration of the clay, which can be demonstrated by the intensity of the bands at 3612, 3409 and 1621 cm−1. The presence of the cation in the clay shifts of the majority of the bands below 1000 cm−1, such as the band at 1040 cm−1, corresponding to the Si–O bonds in the natural montmorillonite, is shifted 15 cm−1 and is localized at 1025 cm−1 in the Fe3+–montmorillonite. This shift can be related to weaker bonds due to a strong interaction of the oxygen atoms of the interstitial spaces with Fe3+ cation, which forms the new Fe–O bonds. It is well known that the surface of montmorillonites has sites of Si–O− negative charge and includes an inner-layer of alumina. Therefore, the material has a negatively charged heterogeneous surface, which might bind metal ions via coordination, especially at lower pH values.
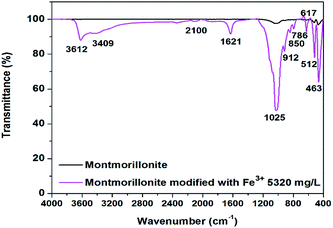 |
| | Fig. 9 Infrared spectroscopy spectra of natural montmorillonite (black line) and modified montmorillonite (purple line). | |
XRD (X-ray Diffraction Spectroscopy) allowed us to identify the montmorillonite crystal structure (M) and other minerals, such as potassium iron oxide (O), aluminium sodium silicate (S), and cristobalite (C). This mixture of minerals is associated with the origin of natural montmorillonites (Fig. 10). Diffractograms obtained after iron sorption at different concentrations show a potassium iron oxide (O) absence, maintaining the other initial minerals (Fig. 10a) such as montmorillonite (M), aluminium sodium silicate (S) and cristobalite (C). Miller index (0,0,1) shows a shift at 2θ and a signal decrease that depends on the iron concentration (Fig. 10b). The crystallite size (β) also changes size depending on the iron concentration (Table 5). These changes indicate a chemical interaction between iron ions and montmorillonite, which changes its original structure.21
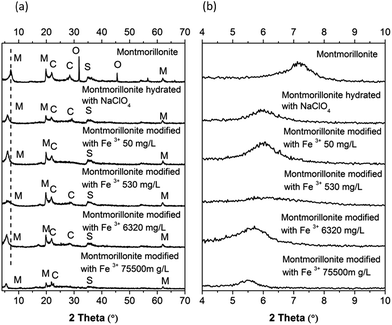 |
| | Fig. 10 X-ray diffraction patterns: (a) montmorillonite at different concentrations of iron and (b) evaluation of Miller index 〈0,0,1〉 for crystallite size. | |
Table 5 2θ and crystallite size β of natural and modified montmorillonites
| Montmorillonite |
2θ (°) |
β = crystallite size (nm) |
| Natural |
7.21 |
10.59 |
| Hydrated with NaClO4 |
5.95 |
10.20 |
| Fe3+ 50 mg L−1 |
6.01 |
9.33 |
| Fe3+ 530 mg L−1 |
6.11 |
5.56 |
| Fe3+ 6320 mg L−1 |
5.65 |
7.49 |
Fe3+ 75![[thin space (1/6-em)]](https://www.rsc.org/images/entities/char_2009.gif) 500 mg L−1 500 mg L−1 |
5.51 |
10.81 |
From the SEM (Scanning Electron Microscopy) images of natural (Fig. 11a) and modified with 530 mg L−1 of Fe3+ (Fig. 11b), it is possible to observe that after the incorporation of iron, the material shows a diminishing of the rugosity, a loss of the natural structure of montmorillonite and the heterogenic distribution of thin flakes up and under 5 μm when treated with iron solutions.
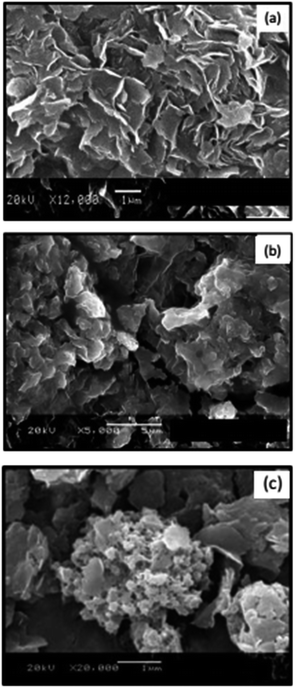 |
| | Fig. 11 SEM images of montmorillonites: (a) natural, (b) modified with Fe3+ 50 mg L−1, (c) with PEDOT. | |
Fig. 12 shows the AFM (Atomic Force Microscope) images for natural and modified montmorillonite samples. A comparison between natural and modified montmorillonite with Fe3+ 530 mg L−1 (Fig. 12a and b) showed that the clean laminar structure of natural montmorillonite was eroded as a consequence of the interaction between the material and the iron ions. The change of topography was confirmed by an analysis of the roughness obtained from the AFM micrographs (Table 6), where an increase of 200% compared with the natural one was observed. That change could be explained by the presence of iron in the interstitial space of the material.
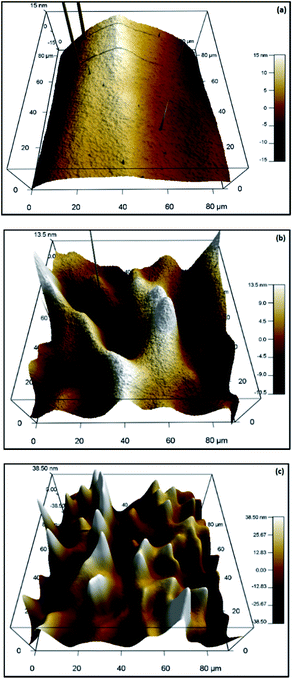 |
| | Fig. 12 AFM images of montmorillonites: (a) natural, (b) modified with Fe3+ 530 mg L−1 and (c) modified with PEDOT. | |
Table 6 Analysis of the roughness
| Montmorillonite |
RMS |
| Natural |
2.778 nm |
| Modified Fe3+ 530 mg L−1 |
6.364 nm |
| Modified with PEDOT |
18.371 nm |
The change in the structure of montmorillonite after the fixation of iron can be explained by the process of passivation, which is due to the pH acid of solutions (pH = 1.5). The use of a low pH has a direct effect on the octahedral sheet destruction, allowing cations to be dissolved in the solution, while the silica generated by the tetrahedral sheet remains in the solids, due to its insolubility. According to some authors, this free silica, which is generated by the initial destruction of the tetrahedral sheet, is polymerized in the acidic media and then is deposited on the undestroyed silicate fractions, protecting it from further attack and, thereby, resulting in a decreased surface area. To verify if this behaviour was accelerated in the presence of Fe3+ and not only due to hydration resultant from the acidic pH value, an SEM image was taking after hydration (see Fig. S3 in ESI†), confirming that the main change in the montmorillonite structure can be attributed to intercalation of Fe3+ into the clay lattice. A general view shows a change from flakes with a length of approximately 3 μm in the natural material to a completely grouped heterogenic distribution of material with larger surfaces of approximately 15 μm when Fe3+ was used in a 75![[thin space (1/6-em)]](https://www.rsc.org/images/entities/char_2009.gif) 500 mg L−1 concentration (see Fig. S3 in ESI†).
500 mg L−1 concentration (see Fig. S3 in ESI†).
Specific surface area analysis by the BET (Brunauer, Emmett and Teller) method allowed confirmation of the SEM observations. Modified montmorillonite with Fe3+ in a 530 mg L−1 concentration was selected for this study because it was the most well behaved sample in the kinetic studies. This analysis revealed a decrease in the specific surface area and pore volume, maintaining similar radium size in the natural montmorillonite, once the modification was carried out (Table 7), which indicates that the macrostructure of montmorillonite was modified but at the microscopic level the lamellar characteristic of this clay is conserved as is expected in an intercalation process.22
Table 7 BET analysis
| Sample |
Specific surface area (m2 g−1) |
Pore volume (cm3 g−1) |
Pore diameter (Å) |
| Montmorillonite |
48.02 |
0.0242 |
10.08 |
| Montmorillonite–Fe3+ 530 mg L−1 |
23.43 |
0.0163 |
9.02 |
| Montmorillonite–PEDOT |
83.26 |
0.0423 |
10.16 |
2.3 Polymerization of ethylenedioxithiophene (EDOT) using the montmorillonite Fe3+ doped
After evaluating the fixation of Fe3+ into montmorillonite, the polymerisation of EDOT using these Fe3+ doped material to obtain montmorillonite–PEDOT composite (Scheme 1) was addressed to demonstrate that enriched clay with iron can trigger polymerisation of EDOT without a need of an external source of iron. The polymerisation reaction was carried out using EDOT as a monomer dissolved in CHCl3 with montmorillonite–Fe3+ 530 mg L−1 as a heterogeneous catalyst over a 24 h period (Scheme 1). These conditions are typical for the chemical synthesis of PEDOT using Fe3+ salts as an oxidant. After the reaction finished, a deep blue film typical of PEDOT polymers was observed on the catalyst surface.23 The solution remained transparent with almost no oligomers dissolved, showing that the heterogeneous reaction occurs on the modified montmorillonite and polymer is compatible with the catalyst.
 |
| | Scheme 1 Synthesis of nanocomposite. | |
The obtained material showed in SEM (Fig. 11c) that PEDOT accumulates in certain regions on the surface of the clay but also that the surface of the lamella is also modified as showed AFM, where the micrographics show (Fig. 12c) higher roughness for the of montmorillonite–PEDOT flakes with an RMS value of 18.371 (Table 6). The change of topography of the surface flakes is evident, showing polymer peaks structures that reach more than 30 nm heights. The large increment of RMS is due to polymer agglomerates typical of a 3D growth. From BET analysis of the montmorillonite–PEDOT composite it is possible to observe that the specific surface area (83.26 m2 g−1) and the pore volume (0.0423 cm3 g−1) increase after PEDOT synthesis (Table 7), which indicates that the polymer is also porous and as it has been described this conducting polymer has potential for ion exchange. This preliminary experiment serves as the proof of concept of the use of this heterogeneous catalyst in this type of reaction, and further studies are running to gain increased insight into this reaction, as well as to study the properties of the montmorillonite–PEDOT composite.
3. Conclusions
A detailed study of the thermodynamic aspects of the sorption process, via an analysis of the process by a pseudo-second order model, allowed us to establish that Fe3+ sorption into montmorillonite is a chemical process that involves an exchange of cations from the montmorillonite interstitial space between layers. XPS experiments provide significant support in determining the presence of Fe3+ on the interstitial space between layers. The oxidative polymerization of EDOT to generate PEDOT–clay demonstrated the oxidant properties of the modified montmorillonite and provided support for its use as an oxidative heterogeneous catalyst.
Acknowledgements
It is acknowledged Melina Tapia Tapia and María Citlalit Martínez Soto for their technical support. This work was funded through CONACYT-Mexico projects 179356. JAMS is grateful to the Royal Society and Newton Fund (UK) for the International Alumni Grant.
Notes and references
- C. Tournassat, C. I. Steefel, I. C. Bourg and F. Bergaya, Dev. Clay Sci., 2015, 6, 5 CrossRef.
-
(a) D. Tilak, B. Tennakoon, J. M. Thomas, W. Jones, T. A. Carpenter and S. Ramdas, J. Chem. Soc., Faraday Trans. 1, 1986, 82, 545 RSC;
(b) P. A. Diddams, J. M. Thomas, W. Jones, J. A. Ballantine and J. H. Purnell, J. Chem. Soc., Chem. Commun., 1984, 1340 RSC.
-
(a) B. González-Rodrígueza, R. Trujillanoa, V. Rivesa, M. A. Vicentea, A. Gilb and S. A. Korilib, Appl. Clay Sci., 2015, 118, 124 CrossRef;
(b) M. A. Vicentea, A. Gilb and F. Bergayac, Dev. Clay Sci., 2013, 5, 523 Search PubMed;
(c) F. Bergaya, A. Aouad and T. Mandalia, Dev. Clay Sci., 2006, 1, 393 CAS.
- E. M. Serwicka and K. Bahranowski, Catal. Today, 2004, 90, 85 CrossRef CAS.
-
(a) W. Ye, B. Zhao, H. Gao, J. Huang and X. Zhang, J. Porous Mater., 2016, 23, 301 CrossRef CAS;
(b) J. Fang, X. Huang, Q. Zhang, J. Chen and X. Wang, Appl. Surf. Sci., 2016, 360, 994 CrossRef CAS;
(c) Y. Liu, C. Dong, H. Wei, W. Yuan and K. Li, Appl. Clay Sci., 2015, 118, 301 CrossRef CAS;
(d) R. Nishimoto, Q. Zhu, T. Miyamoto, T. Sato, X. Tu, A. Aneksampant and M. Fukushima, J. Mol. Catal. A: Chem., 2015, 396, 84 CrossRef CAS;
(e) J. Virkutyte and R. S. Varma, ACS Sustainable Chem. Eng., 2014, 2, 1545 CrossRef CAS;
(f) H. Gao, B. Zhao, J. Luo, D. Wu, W. Ye, Q. Wang and X. Zhang, Microporous Mesoporous Mater., 2014, 196, 208 CrossRef CAS;
(g) D. Li, C. Li and K. Suzuki, Appl. Clay Sci., 2013, 77–78, 56 CrossRef CAS;
(h) G. Granados-Oliveros, V. Gómez-Vidales, A. Nieto-Camacho, J. A. Morales-Serna, J. Cárdenas and M. Salmón, RSC Adv., 2013, 3, 937 RSC.
-
(a) B. S. Kumar, A. Dhakshinamoorthy and K. Pitchumani, Catal. Sci. Technol., 2014, 4, 2378 RSC;
(b) C. I. Fernandes, C. D. Nunes and P. D. Vaz, Curr. Org. Synth., 2012, 9, 670 CrossRef CAS;
(c) G. Nagendrappa, Appl. Clay Sci., 2011, 53, 106 CrossRef CAS;
(d) K. Shimizu and A. Satsuma, Energy Environ. Sci., 2011, 4, 3140 RSC;
(e) C. H. Zhou, Appl. Clay Sci., 2010, 48, 1 CrossRef CAS.
-
(a) J. A. Morales-Serna, B. A. Frontana-Uribe, R. Olguín, V. Gómez-Vidales, L. Lomas-Romero, E. Garcia-Ríos, R. Gaviño and J. Cárdenas, RSC Adv., 2016, 6, 42613 RSC;
(b) G. V. R. Sharma, B. Devi, K. S. Reddy, M. V. Reddy, A. K. Kondapi and C. Bhaskar, Heterocycl. Commun., 2015, 21, 187 Search PubMed;
(c) J. Yu, J. W. Lim, S. Y. Kim, J. Kim and J. N. Kim, Tetrahedron Lett., 2015, 56, 1432 CrossRef CAS;
(d) F.-F. Wang, J. Liu, H. Li, C.-L. Liu, R.-Z. Yang and W.-S. Dong, Green Chem., 2015, 17, 2455 RSC;
(e) F. Shirini, M. Seddighi, M. Mazloumi, M. Makhsous and M. Abedini, J. Mol. Liq., 2015, 208, 291 CrossRef CAS;
(f) J. W. Lim, S. H. Kim, J. Kim and J. N. Kim, Bull. Korean Chem. Soc., 2015, 36, 1351 CrossRef CAS;
(g) Y. Masui, J. Wang, K. Teramura, T. Kogure, T. Tanaka and M. Onaka, Microporous Mesoporous Mater., 2014, 198, 129 CrossRef CAS;
(h) K. Motokura, S. Matsunaga, H. Noda, A. Miyaji and T. Baba, Catal. Today, 2014, 226, 141 CrossRef CAS;
(i) T. Mizugaki, R. Arundhathi, T. Mitsudome, K. Jitsukawa and K. Kaneda, ACS Sustainable Chem. Eng., 2014, 2, 574 CrossRef CAS;
(j) D. Chen, C. Xu, J. Deng, C. Jiang, X. Wen, L. Kong, J. Zhang and H. Sun, Tetrahedron, 2014, 70, 1975 CrossRef CAS;
(k) S. Takehira, Y. Masui and M. Onaka, Chem. Lett., 2014, 43, 498 CrossRef CAS.
-
(a) W. M. K. T. Wijeratne, R. M. G. Rajapakse, S. Wijeratne and K. Velauthamurty, J. Compos. Mater., 2012, 46, 1335 CrossRef CAS;
(b) Q. Y. Soundararajah., B. S. B. Karunaratne and R. M. G. Rajapakse, J. Compos. Mater., 2010, 44, 303 CrossRef CAS;
(c) R. M. G. Rajapakse, K. Murakami, H. M. N. Bandara, R. M. M. Y. Rajapakse, K. Velauthamurti and S. Wijeratne, Electrochim. Acta, 2010, 55, 2490 CrossRef CAS;
(d) D. M. M. Krishantha, R. M. G. Rajapakse, D. T. B. Tennakoon and H. V. R. Dias, J. Compos. Mater., 2006, 40, 1009 CrossRef CAS;
(e) R. M. G. Rajapakse, D. T. B. Tennakoon, J. S. H. Q. Perera, W. M. A. T. Bandara and D. M. M. Krishantha, J. Compos. Mater., 2005, 39, 1985 CrossRef CAS;
(f) W. M. A. T. Bandara, D. M. M. Krishantha, J. S. H. Q. Perera, R. M. G. Rajapakse and D. T. B. Tennakoon, J. Compos. Mater., 2005, 39, 759 CrossRef CAS.
-
(a) R. O. Mäkiniemi, P. Das, D. Hönders, K. Grygiel, D. Cordella, C. Detrembleur, J. Yuan and A. Walther, ACS Appl. Mater. Interfaces, 2015, 7, 15681 CrossRef PubMed;
(b) A. Rosas-Aburto, I. A. Gabaldón-Saucedo, F. Espinosa-Magaña, M. T. Ochoa-Lara, P. Roquero-Tejeda, M. Hernández-Luna and J. Revilla-Vázquez, Microporous Mesoporous Mater., 2015, 218, 118 CrossRef CAS;
(c) D. Amoura, M. Sánchez-Jiménez, F. Estrany, L. Makhloufi and C. Alemán, Eur. Polym. J., 2015, 69, 296 CrossRef CAS;
(d) J. Zhao, S. Xu, K. Tschulik, R. G. Compton, M. Wei, D. O'Hare, D. G. Evans and X. Duan, Adv. Funct. Mater., 2015, 25, 2745 CrossRef CAS.
-
(a) Z. Zhao, G. F. Richardson, Q. Meng, S. Zhu, H. Kuan and J. Ma, Nanotechnology, 2016, 27, 042001 CrossRef PubMed;
(b) K. Sun, S. Zhang, P. Li, Y. Xia, X. Zhang, D. Du, F. H. Isikgor and J. Ouyang, J. Mater. Sci.: Mater. Electron., 2015, 26, 4438 CrossRef CAS;
(c) S. Ouyang, Y. Xie, D. Wang, D. Zhu, X. Xu, T. Tan and H. H. Fong, J. Nanomater., 2015, 2015, 603148 Search PubMed;
(d) Q. Wei, M. Mukaida, K. Kirihara, Y. Naitoh and T. Ishida, Materials, 2015, 8, 732 CrossRef;
(e) F. Petrakia, S. Kennoua, S. Nespurekb and M. Biler, Org. Electron., 2010, 11, 1423 CrossRef.
-
(a) S. Fujii, Y. Suzuki, J. Kawamata and R. Tsunashima, J. Mater. Chem. C, 2015, 3, 7153 RSC;
(b) D. Aradilla, F. Estranyb, F. Casellasd, J. I. Iribarrena and C. Alemán, Org. Electron., 2014, 15, 40 CrossRef CAS;
(c) Ş. Sarioğlan, Part. Sci. Technol., 2012, 30, 68 CrossRef;
(d) D. Aradilla, D. Azambuja, F. Estrany, M. T. Casas, C. A. Ferreira and C. Alemán, J. Mater. Chem., 2012, 22, 13110 RSC;
(e) J. K. Kim, H. S. Park, D. K. Rhee, S. Ham, K. Lee, P. J. Yoo and J. H. Park, J. Mater. Chem., 2012, 22, 7718 RSC;
(f) D. Aradilla, F. Estrany, D. S. Azambuja, M. T. Casas, J. Puiggalia, C. A. Ferreirae and C. Alemána, Eur. Polym. J., 2010, 46, 977 CrossRef CAS;
(g) I. Ahmad, M. Hussain, K. Seo and Y. Choa, J. Appl. Polym. Sci., 2010, 116, 314 CrossRef CAS;
(h) Y. Han and Y. Lu, J. Appl. Polym. Sci., 2009, 111, 2400 CrossRef CAS;
(i) S. Letaïef, P. Aranda, R. Fernández-Saavedra, J. C. J. Margeson, C. Detelliera and E. Ruiz-Hitzky, J. Mater. Chem., 2008, 18, 2227 RSC.
-
(a) Z. Wang, Z. Wang, H. Zhang, X. Duan, J. Xu and Y. Wen, RSC Adv., 2015, 5, 12237 RSC;
(b) M. Kim, J. Yoo, H. Im and J. Kim, J. Power Sources, 2013, 230, 1 CrossRef CAS;
(c) J. Wang, G. Cai, X. Zhu and X. Zhou, J. Appl. Polym. Sci., 2012, 124, 109 CrossRef CAS;
(d) C. Wu, T. Don and W. Chiu, Polymer, 2011, 52, 1375 CrossRef CAS.
-
(a) Ü. Dogan, M. Kaya, A. Cihaner and M. Volkan, Electrochim. Acta, 2012, 85, 220 CrossRef;
(b) G. Nie, H. Yang, J. Chen and Z. Bai, Org. Electron., 2012, 13, 2167 CrossRef CAS.
-
(a) K. G. Bhattacharyya and S. S. Gupta, Adsorption, 2006, 12, 185 CrossRef CAS;
(b) M. A. Al-Anber, Desalination, 2010, 250, 885 CrossRef CAS;
(c) K. C. L. N. Rao and K. K. Ashutosh, Indian J. Chem. Technol., 1994, 1, 13 CAS;
(d) G. Karthikeyan, N. M. Andal and K. Anbalagan, J. Chem. Sci., 2005, 117, 663 CrossRef CAS.
-
(a) Y. S. Ho and G. McKay, Process Biochem., 1999, 34, 451 CrossRef CAS;
(b) T. K. Sen and M. V. Sarali, J. Environ. Res. Dev., 2008, 3, 220 CAS.
- G. Ghodake, S. Jadhav, V. Dawkar and S. Govindwar, Int. Biodeterior. Biodegrad., 2009, 63, 433 CrossRef CAS.
- C. Raymond, Physical Chemistry for the Biosciences, University Science Books, USA, 2005, p. 338 Search PubMed.
-
(a) S. Babel and T. A. Kurniawan, J. Hazard. Mater., 2003, B97, 219 CrossRef;
(b) V. J. Inglezakis, M. D. Loizidou and H. P. Grigoropoulou, J. Colloid Interface Sci., 2004, 275, 570 CrossRef CAS PubMed;
(c) B. B. Johnson, Environ. Sci. Technol., 1990, 24, 112 CrossRef CAS;
(d) N. Khalid, S. Ahmad, S. N. Kiani and J. Ahmed, Sep. Sci. Technol., 1999, 34, 3139 CrossRef CAS;
(e) N. Khalid, S. Ahmed, S. N. Kiani and J. Ahmed, Sep. Sci. Technol., 1998, 33, 2349 CrossRef CAS.
- L. Lutterotti, M. Voltolini, H.-R. Wenk, K. Bandyopadhyay and T. Vanorio, Am. Mineral., 2010, 95, 98 CrossRef CAS.
-
(a) B. J. Saikia and G. Parthasarathy, J. Mod. Phys., 2010, 1, 206 CrossRef CAS;
(b) S. C. B. Myneni, S. J. Traina, G. A. Waychunas and T. J. Logan, Geochim. Cosmochim. Acta, 1998, 62, 3499 CrossRef CAS;
(c) J. L. Bishop, M. D. Lane, M. D. Dyar, S. J. King, A. J. Brown and G. A. Swayze, Am. Mineral., 2014, 99, 2105 CrossRef;
(d) A. S. Özcan and A. Özcan, J. Colloid Interface Sci., 2004, 276, 39 CrossRef PubMed.
- D. E. Kherroub, M. Belbachir, S. Lamouri, L. Bouhadjar and K. Ch, Orient. J. Chem., 2013, 29, 1429 CrossRef CAS.
-
(a) S. Bendou and M. Amrani, J. Miner. Mater. Charact. Eng., 2014, 2, 413 Search PubMed;
(b) C. Pesquera, F. Gonzalez, l. Benito, C. Blanco, S. Mendiorozb and J. Pajares, J. Mater. Chem., 1992, 2, 907 RSC.
- H. Behniafar and H. Moaref, J. Polym. Res., 2013, 20, 132 CrossRef.
Footnote |
| † Electronic supplementary information (ESI) available: General procedures to the synthesis of nanocomposite. See DOI: 10.1039/c6ra21692g |
|
| This journal is © The Royal Society of Chemistry 2016 |
Click here to see how this site uses Cookies. View our privacy policy here. ![[thin space (1/6-em)]](https://www.rsc.org/images/entities/char_2009.gif) :
:![[thin space (1/6-em)]](https://www.rsc.org/images/entities/char_2009.gif) 1 clay, meaning that it has two (SiO4)4− tetrahedral sheets sandwiching a central octahedral layer of aluminium hydroxide Al2(OH)6. The structure contains an interstitial space between the layers, where mobile hydrated cations or water can be incorporated (Fig. 1).
1 clay, meaning that it has two (SiO4)4− tetrahedral sheets sandwiching a central octahedral layer of aluminium hydroxide Al2(OH)6. The structure contains an interstitial space between the layers, where mobile hydrated cations or water can be incorporated (Fig. 1).
![[thin space (1/6-em)]](https://www.rsc.org/images/entities/char_2009.gif) 500 mg L−1). From these plots, it is found that the amount of sorbate (iron cation) per gram of sorbent (montmorillonite) increases with contact time at all initial metal ion concentrations, and equilibrium is attained after 4 h. Because of these results, we postulated that the initial rapid uptake is most likely to take place at the active sites on the surface; however, as the surface sites become saturated with Fe3+, the ions slowly diffuse into the interior resulting in a gradual approach towards equilibrium.
500 mg L−1). From these plots, it is found that the amount of sorbate (iron cation) per gram of sorbent (montmorillonite) increases with contact time at all initial metal ion concentrations, and equilibrium is attained after 4 h. Because of these results, we postulated that the initial rapid uptake is most likely to take place at the active sites on the surface; however, as the surface sites become saturated with Fe3+, the ions slowly diffuse into the interior resulting in a gradual approach towards equilibrium.
![[thin space (1/6-em)]](https://www.rsc.org/images/entities/char_2009.gif) 500 mg L−1, the R2 coefficient is low (0.90), which could indicate that iron fixation at this concentration begins via a chemisorption mechanism; however, once the montmorillonite interstitial layer is saturated, iron suffers physical sorption on the layer cavities because there is iron desorption after 18 h. The constants calculated for the pseudo-second order model of the sorption of Fe3+ ions on montmorillonite are provided in Table 1.
500 mg L−1, the R2 coefficient is low (0.90), which could indicate that iron fixation at this concentration begins via a chemisorption mechanism; however, once the montmorillonite interstitial layer is saturated, iron suffers physical sorption on the layer cavities because there is iron desorption after 18 h. The constants calculated for the pseudo-second order model of the sorption of Fe3+ ions on montmorillonite are provided in Table 1.![[thin space (1/6-em)]](https://www.rsc.org/images/entities/char_2009.gif) 500
500
![[thin space (1/6-em)]](https://www.rsc.org/images/entities/char_2009.gif) K2 vs. T−1 allowed us to calculate from the slope the activation energy (Ea) and from the intercept the frequency factor (Ao).
K2 vs. T−1 allowed us to calculate from the slope the activation energy (Ea) and from the intercept the frequency factor (Ao).


![[thin space (1/6-em)]](https://www.rsc.org/images/entities/char_2009.gif) 500 mg L−1 (% atomic)
500 mg L−1 (% atomic)


![[thin space (1/6-em)]](https://www.rsc.org/images/entities/char_2009.gif) 500 mg L−1
500 mg L−1

![[thin space (1/6-em)]](https://www.rsc.org/images/entities/char_2009.gif) 500 mg L−1 concentration (see Fig. S3 in ESI†).
500 mg L−1 concentration (see Fig. S3 in ESI†).


