Silver nanoparticles functionalized with a fluorescent cyclic RGD peptide: a versatile integrin targeting platform for cells and bacteria†
P. Di Pietroa,
L. Zaccarob,
D. Comegnab,
A. Del Gattob,
M. Savianoc,
R. Snydersde,
D. Cossemente,
C. Satriano *a and
Enrico Rizzarelliaf
aDepartment of Chemical Sciences, University of Catania, Consorzio Interuniversitario di Ricerca in Chimica dei Metalli nei Sistemi Biologici (C.I.R.C.M.S.B.), viale Andrea Doria 6, 95125 Catania, Italy. E-mail: csatriano@unict.it; Tel: +39 0957385136
bInstitute of Biostructure and Bioimaging (IBB) of the Italian National Research Council (CNR), Via Mezzocannone, 16, Napoli, Italy
cInstitute of Crystallography (IC) of the Italian National Research Council (CNR), Via Amendola 122/O, 70126, Bari, Italy
dChimie des Interactions Plasma Surface (ChIPS), Research Institute for Materials Science and Engineering, Université de Mons (UMONS), Belgium
eMateria Nova Research Center, 1, Avenue Copernic, 7000 Mons, Belgium
fInstitute of Biostructure and Bioimaging (IBB) of the Italian National Research Council (CNR), 18, Via Paolo Gaifami 18, Catania, Italy
First published on 21st November 2016
Abstract
The arginine–glycine–aspartic acid (RGD) peptide sequence is known to specifically interact with integrins, which are chief receptors participating at various stages of cancer disease and in bacterial adhesion/invasion processes. In particular, vitronectin receptor (αvβ3) and fibronectin receptor (α5β1) integrins are involved respectively in tumour cell targeting and bacteria internalization inhibition. Silver nanoparticles (AgNPs) have elicited a lot of interest as a theranostic platform, owing to their unique optoelectronic as well as self-therapeutic properties as bactericides. The goal of this work was the comprehensive physicochemical characterization of a hybrid peptide–metal nanoparticle biointerface fabricated by the immobilisation, through thiol chemistry, of a fluorescent cyclic RGD peptide onto AgNPs of 13 nm diameter. RGD peptide-functionalized AgNPs were investigated by a multi-technique approach, including various spectroscopic (XPS, FTIR and UV-visible), spectrometric (ToF-SIMS) and microscopic (SEM, TEM, AFM) methods as well as dynamic light scattering and ζ-potential measurements. Proof-of-work experiments by confocal microscopy imaging of the cellular uptake by human neuroblastoma SH-SY5Y and chronic myelogenous leukaemia K562 cells, overexpressing respectively αvβ3 and α5β1 integrins, demonstrated a receptor-specific activity of the RGD peptide-functionalised AgNPs, which make them very promising as a multifaceted platform in applications with cells and bacteria.
1 Introduction
Multifunctional nanoparticles (NPs) offer great promise for early diagnosis and targeted therapy, which is a hot area of nanomedicine.1 Nanomaterials, owing to their extremely high surface-to-volume ratio, offer an ideal versatile platform for polyvalent presentation on account of their tunable size and shape, surface chemistry, biocompatibility and, in general, non-toxicity. Furthermore, an increased ability of targeting and efficiency of drug loading/release as well as image contrast capability, for instance, due to their optical or magnetic properties, are major advantages of nanoparticles for theranostic applications.2,3An enormous research effort has been devoted to the search for suitable materials to achieve targeted delivery, for example polymers/inorganic mesoporous nanoparticles,4 hollow nanocapsules based on polymers,5,6 liposomes,7 inorganic metals and oxides.8
In particular, metal NPs, with their unique optoelectronic properties9 as well as their self-therapeutics features, including anti-angiogenic gold nanoparticles (AuNPs) and antibacterial silver nanoparticles (AgNPs),10 attract a large interest as ideal candidates for tumour diagnosis and therapy.3,11
Different functionalization and/or surface modification strategies, including the surface-anchoring of protein-mimicking peptides as bioactive moieties,12–14 can be used to trigger the response of a solid surface at the hybrid biointerface, thus modulating the interaction with lipid membranes,15–17 mammalian cells18–20 or bacteria.21–23
Surface-engineered nanoparticles may intrude cells by active targeting but also by passive penetration of the plasma membrane.24 Nanoparticles adhere to and penetrate cell membranes depending on their physical properties, including size, surface composition and surface charge.25 Small, positively charged NPs pass through cell membranes, leading to membrane rupture and noticeable cytotoxic effects.26
To specifically guide and direct anticancer therapeutics (and/or imaging agents) to cancer cells, without interfering with normal tissues, active targeting strategies are typically used,27 by means of the nanoparticle decoration with ligands able to target specific receptors over-expressed on the diseased cells.28,29
Integrins, which are adhesion molecules involved in physiological and pathological angiogenesis27 as well as tumor invasion and metastasis,30,31 are considered an important target for molecular imaging and delivery of therapeutics for cancer. Currently, 3 out of the 24 known human integrins are targeted therapeutically by monoclonal antibodies, peptides or small molecules.32
Most integrins recognize their respective extracellular matrix (ECM) proteins through short amino acids sequences, such as arginine–glycine–aspartic acid (RGD)33 and its synergic site proline–histidine–serine–arginine–asparagine (PHSRN).20
In particular, RGD has been widely used as basic module in the design of a variety of molecules for the preferential binding to αvβ3 integrin (vitronectin receptor) and α5β1 integrin (fibronectin receptor) as well as other integrins.34,35
RGD-containing peptides have successfully been employed as multidentate agents for their ability to bind integrins and to stabilize biocompatible gold nanoparticles and nano-heterostructures usable for tumour imaging and photo-thermal therapy.34–37
El Sayed et al. established the use of AuNPs for cancer imaging by selectively transporting the nanoparticles into the cancer cell nucleus, obtained via conjugation of RGD and a nuclear localization signal peptide (lysine–lysine–lysine–arginine–lysine) to a 30 nm AuNPs via PEGylation.38 The presence of RGD enabled the cancer-cell-specific targeting to human oral squamous cell carcinoma, having integrins overexpressed on the cell surface.38 Recently, RGD-functionalized AuNPs bound to integrins were detected by means of tip enhanced Raman scattering technique, which discriminated the binding between α5β1 and αvβ3 integrins to RGD-conjugated gold nanoparticles both on surfaces and in a cancer cell membrane.39
The affinity of RGD-based oligopeptides for their ligands may be affected by steric conformation. Cyclization is commonly employed to stabilize the correct binding properties as well as to confer rigidity, enhanced stability and reduced susceptibility of the ligands to chemical protease degradation.40,41
Cyclic RGD (c-RGD) peptide sequences encompassing the sequence glycine–cysteine (GC),34 displaying thiols as capping groups of metal nanoparticles, or glycine–lysine (GK),35 were reported to avoid colloidal aggregation by cross-linking.42,43
AuNPs functionalized with c-RGD have been largely employed for targeting human cancer cells expressing αvβ3 integrin.44 For instance, the effect of passive targeting by PEGylation and active targeting by c-RGD peptide conjugation on the biodistribution of ultrasmall (2.7 nm) gold nanoparticles in mice bearing B16 melanoma allografts, indicated that un-PEGylated c-RGD performed poorly, but PEGylated c-RGD showed a significant transient collection in the tumor, with liver and kidney being the primary targets of all constructs, although none of the particles were able to cross the blood–brain barrier.45 Also, radioactive iodine-labelled, c-RGD–PEGylated AuNPs designed and synthesized for targeting cancer cells and imaging tumor sites via integrin αvβ3-receptor-mediated endocytosis showed no cytotoxicity.46
Similar to gold, silver nanoparticles elicited a lot of interest as theranostic platform.3,11 Nevertheless AgNPs exhibit several more attractive features in comparison to AuNPs: (i) a narrower plasmon bandwidth that permits more accurate measurements of the local surface plasmon shift,47 (ii) known anti-bacterial activity48 and low propensity to induce bacterial resistance,49 and (iii) availability of green synthetic approaches assisted by biomolecules.50 The few works reported on silver nanoparticles conjugated to RGD-containing peptides, include the demonstration of programmed cell death in carcinoma cells by nuclear-targeted RGD-conjugated AgNPs51 and the active conjugation of silver nanoparticles with c-RGD, which rapidly induced endosome formation and minimized nonspecific interactions in comparison to passive PEGylation.52 Promisingly, poly-gamma glutamic acid-capsulated AgNPs conjugated to c-RGD, carried out a sustained controlled release specifically targeting the neovascularization cells and induced apoptosis unaffecting the normal retinal cells, thus demonstrating potential applications as a boon to ocular therapies.53
In the present paper, we address fabrication and focus on an extensive physicochemical characterization of the hybrid nanoassembly made of AgNPs and fluorescein isothiocyanate (FITC)-labelled cyclic RGD peptide containing a glycine–cysteine stretch.
A combined approach of spectroscopic (UV-visible, FTIR), spectrometric (ToF-SIMS) and microscopic (SEM, TEM, AFM) techniques demonstrated that an actual chemisorption of the peptide molecules occurs onto the AgNPs. The reaction between the –SH moiety of cysteine residues and the metal nanoparticle surface is assisted by additional electrostatic contributions from the RGD sequence in the side chain.
The RGD based peptides for both αvβ3 and α5β1 integrins have high potential for the development of a novel nanosystem with advanced therapeutic and antimicrobial properties.
Indeed, αvβ3 integrin is expressed at low levels on mature endothelial cells and epithelial cells, conversely it is highly expressed on the activated endothelial cells of tumour neo-vasculature and other tumor cells, including osteosarcomas, neuroblastomas, glioblastomas, melanomas, lung carcinomas, and breast cancer.54 Undifferentiated and differentiated neuroblastoma SH-SY5Y cells have been shown to express α1, α3, and β1 integrin subunits, as well as concentrations of α2, α4, α5, α6, and αv integrin subunits.55,56
While the αvβ3 integrin cooperates with certain growth factors, potentiating their effect on cells, the α5β1 integrin appears to be a growth-suppressing integrin, and it protects cells from apoptosis when growth factors are absent.57 It is also to note that several pathogens utilize ECM protein fibronectin as a molecular bridge, indirectly linking the bacterial surface with the α5β1 integrin.58 An important feature that makes cell adhesion receptors prime targets for bacterial adhesion and invasion is their functional connection to the intracellular cytoskeleton whose rearrangements can lead to cellular invasion. A non-peptide antagonist of integrin α5β1, able to inhibit internalization of streptococci by primary human tonsillar epithelial cells, increased the extent of bacterial killing by antibiotics.59 A cellular model which overexpress the fibronectin receptor is the K562 cell line, which endogenously express α5β1, with αvβ3.60
Compounds capable of binding integrins and of disrupting the bacteria ability to engage integrins have the potential to affect the outcome of microbial activity. To the best of our knowledge, this is the first work that deals with RGD peptide–silver nanoparticles, with a comprehensive physicochemical study of the hybrid biointerface, in view of its application with cells and bacteria. Results are indeed very promising, with proof-of-work confocal microscopy imaging experiments on neuroblastoma and K562 cell lines, which overexpress respectively the αvβ3 and α5β1 integrins, validating the assembled systems as versatile and multifunctional theranostic nanoplatform.
2 Experimental section
2.1 Chemicals
Chemicals were purchased from Sigma Aldrich and used as received. Ultrapure MilliQ water was employed (18.2 MΩ cm at 25 °C, Millipore). Glassware was cleaned before using by soaking in aqua regia (HCl![[thin space (1/6-em)]](https://www.rsc.org/images/entities/char_2009.gif) :
:![[thin space (1/6-em)]](https://www.rsc.org/images/entities/char_2009.gif) HNO3, 3
HNO3, 3![[thin space (1/6-em)]](https://www.rsc.org/images/entities/char_2009.gif) :
:![[thin space (1/6-em)]](https://www.rsc.org/images/entities/char_2009.gif) 1 volume ratio) and thorough rinsing with water. The buffer solution was prepared with 3-(N-morpholino)propane sulfonic acid (MOPS) at the final concentration of 10 mM, added with 2.7 mM KCl and 0.137 M NaCl. In order to avoid the oxidation of sulphur moieties, tris(2-carboxyethyl)phosphine (TCEP) reducing agent was added at equimolar concentration to the MOPS buffer and the final pH was corrected by NaOH to 7.4 (at 25 °C). Polypropylene reaction vessels and sintered polyethylene frits for the peptide synthesis were supplied by Alltech Italy. Phenylsilane, Pd(PPh3)4, hydrazine solution, fluorescein isothiocyanate (FITC) and N-methylmorpholine (NMM), N,N-diisopropylethylamine (DIPEA) and piperidine were purchased from Sigma-Aldrich. NovaSyn TGR resin, 2-(1H-benzotriazole-1-yl)-1,1,3,3-tetramethyluronium hexafluorophosphate (HBTU), 1-hydroxybenzotriazole (HOBT), benzotriazole-1-yloxytripyrrolidinophosphonium hexafluorophosphate (PyBop) and all amino acids were from Novabiochem.
1 volume ratio) and thorough rinsing with water. The buffer solution was prepared with 3-(N-morpholino)propane sulfonic acid (MOPS) at the final concentration of 10 mM, added with 2.7 mM KCl and 0.137 M NaCl. In order to avoid the oxidation of sulphur moieties, tris(2-carboxyethyl)phosphine (TCEP) reducing agent was added at equimolar concentration to the MOPS buffer and the final pH was corrected by NaOH to 7.4 (at 25 °C). Polypropylene reaction vessels and sintered polyethylene frits for the peptide synthesis were supplied by Alltech Italy. Phenylsilane, Pd(PPh3)4, hydrazine solution, fluorescein isothiocyanate (FITC) and N-methylmorpholine (NMM), N,N-diisopropylethylamine (DIPEA) and piperidine were purchased from Sigma-Aldrich. NovaSyn TGR resin, 2-(1H-benzotriazole-1-yl)-1,1,3,3-tetramethyluronium hexafluorophosphate (HBTU), 1-hydroxybenzotriazole (HOBT), benzotriazole-1-yloxytripyrrolidinophosphonium hexafluorophosphate (PyBop) and all amino acids were from Novabiochem.
2.2 Synthesis of fluorescent RGD peptide-functionalised silver nanoparticles
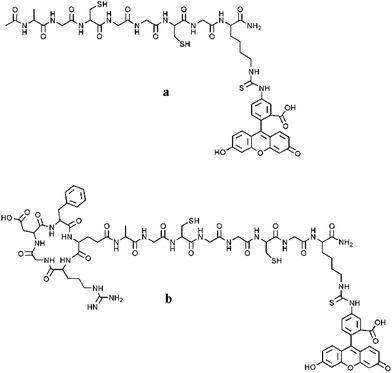 | ||
| Scheme 1 Structures of the newly synthesized fluorescent peptides FITC-(GC)2 (a) and FITC-RGD(GC)2 (b). | ||
To prepare the peptide-coated nanoparticles, the fluorescent peptides (10 μM) were added to the Ag colloidal dispersion (1.8 × 10⁹ NP per mL) under stirring, then the unbound peptide molecules were removed by centrifugation (14![[thin space (1/6-em)]](https://www.rsc.org/images/entities/char_2009.gif) 000 rpm, 30 min) and the collected pellets were dissolved in MilliQ water at a final concentration of 3.3 × 10⁻⁹ M AgNPs, as determined by UV-visible spectra. The same dilution ratios were used in the culture medium for the cells treatment.
000 rpm, 30 min) and the collected pellets were dissolved in MilliQ water at a final concentration of 3.3 × 10⁻⁹ M AgNPs, as determined by UV-visible spectra. The same dilution ratios were used in the culture medium for the cells treatment.
2.3 Physicochemical characterisation of RGD-functionalised AgNPs
At least 5 measurements were made and data were averaged.
ToF-SIMS spectra were interpreted with the help of the Principal Component Analysis (PCA) method,‡ by using SIMCA-P13 software (Umetrics, Sweden). Before PCA, each of the peak intensities were normalized to the total ion count, to correct for the differences in total secondary ion yield, then the normalized spectra were exported from the acquisition software (Surface Lab 6.3) to the SIMCA-P13 analysis software that mean-centres and scales the variables. The scaling of all the peaks inside the ToF-SIMS spectra gives them the same statistical weight, independently of their relative intensity in the spectra. This procedure ensured that the variance in the data was related to chemical differences between samples and not to artefacts in peak intensity.66
2.4 Cellular experiments
![[thin space (1/6-em)]](https://www.rsc.org/images/entities/char_2009.gif) :
:![[thin space (1/6-em)]](https://www.rsc.org/images/entities/char_2009.gif) 1); RPMI 1640, fetal bovine serum (FBS) and human chronic myelogenous leukaemia cells (K562) cells were purchased from Sigma Aldrich. Collagen I, bovine was purchased from ThermoFisher. Human neuroblastoma SH-SY5Y cells (obtained from the American Type Culture Collection (Manassas, VA)), were grown in DMEM–F12 (1
1); RPMI 1640, fetal bovine serum (FBS) and human chronic myelogenous leukaemia cells (K562) cells were purchased from Sigma Aldrich. Collagen I, bovine was purchased from ThermoFisher. Human neuroblastoma SH-SY5Y cells (obtained from the American Type Culture Collection (Manassas, VA)), were grown in DMEM–F12 (1![[thin space (1/6-em)]](https://www.rsc.org/images/entities/char_2009.gif) :
:![[thin space (1/6-em)]](https://www.rsc.org/images/entities/char_2009.gif) 1) medium, supplemented with 10% fetal bovine serum, 1% penicillin/streptomycin, 2 mM L-glutamine and maintained in a humidified incubator at 37 °C in 5% CO2 atmosphere. K562 cells were grown in RPMI 1640 medium, supplemented with 10% fetal bovine serum, 1% L-glutamine and maintained in a humidified incubator at 37 °C in 5% CO2 atmosphere. At confluence, cells were split on glass bottom Petri dishes (WillCo Wells, glass diameter of 22 mm) pre-coated, only in the case of K562 cells, with collagen (3.5 μg mL−1, 1 hour incubation) and placed in the incubator. The day after, cells were treated with both bare AgNPs and AgNPs/peptides, at a final nanoparticle concentration of 3.3 × 10⁻⁹ M. After 2 hours of incubation time, cells were washed with phosphate buffer saline solution (10 mM PBS, 37 °C, pH = 7.4), fixed and stained with the nuclear dye DAPI (ThermoFisher).
1) medium, supplemented with 10% fetal bovine serum, 1% penicillin/streptomycin, 2 mM L-glutamine and maintained in a humidified incubator at 37 °C in 5% CO2 atmosphere. K562 cells were grown in RPMI 1640 medium, supplemented with 10% fetal bovine serum, 1% L-glutamine and maintained in a humidified incubator at 37 °C in 5% CO2 atmosphere. At confluence, cells were split on glass bottom Petri dishes (WillCo Wells, glass diameter of 22 mm) pre-coated, only in the case of K562 cells, with collagen (3.5 μg mL−1, 1 hour incubation) and placed in the incubator. The day after, cells were treated with both bare AgNPs and AgNPs/peptides, at a final nanoparticle concentration of 3.3 × 10⁻⁹ M. After 2 hours of incubation time, cells were washed with phosphate buffer saline solution (10 mM PBS, 37 °C, pH = 7.4), fixed and stained with the nuclear dye DAPI (ThermoFisher).3 Results and discussion
The characteristic plasmonic peak of a metal nanoparticle is a straight marker of size and/or shape modification upon the adsorption of molecules on its surface. Indeed, any increase of the hydrodynamic size of the nanoparticle, due to aggregation and/or core particle coating, may induce a shift in the absorbance maximum wavelength (λmax) and/or a change in the corresponding absorbance value (Aλmax) and the band width.62,67To scrutinize whether the introduction of the FITC group in the two peptide sequences (GC)2 and RGD(GC)2 altered the adsorption process onto the metal nanoparticle, both fluorescent and non-fluorescent sequences were investigated by UV-visible spectroscopy. Fig. 1 shows the spectra of the silver nanoparticles in the titration experiments carried out by adding the peptide at increasing concentrations from 2.5 × 10⁻⁶ M to 1.8 × 10⁻⁵ M.
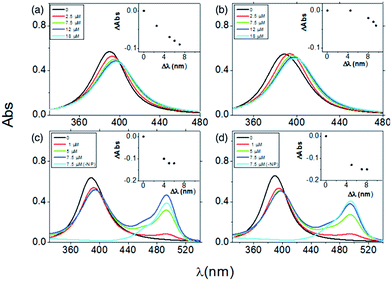 | ||
| Fig. 1 UV-visible spectra of silver colloids (4.6 × 10⁸ NP per mL) upon the addition of increasing concentrations of: (GC)2 (a), RGD(GC)2 (b), FITC-(GC)2 (c), FITC-RGD(GC)2 (d). | ||
An overall trend of absorbance decrease and red-shift in the plasmonic peak wavelength was observed in all the spectra. The two non-fluorescent peptides (GC)2 (Fig. 1a) and RGD(GC)2 (Fig. 1b) showed a saturation effect after the addition of 12 μM peptide, corresponding to plasmon shifts of about 10 nm for RGD(GC)2 and 7 nm for (GC)2, respectively. Such an observation was explained by the reaching of the equilibrium in the particle coverage process by the peptide molecules.
It is to note that the plots of the absorbance shift (ΔAbs) versus wavelength shifts (Δλ) displayed different trends (see insets), suggesting that distinct adsorption stages occurred for RGD(GC)2 and the ‘bare backbone’ (GC)2. In fact, specific forces at the interface between the RGD peptide and AgNP could originate, in addition to the mere chemisorption of the cysteine groups to the metal surface, some extra contributions in the binding, e.g., electrostatic attraction between the anionic silver nanoparticles and the cationic guanidine side chain of arginine in the RGD sequence.
As to the fluorescent FITC-(GC)2 (Fig. 1c) and FITC-RGD(GC)2 (Fig. 1d), the UV-visible spectra showed, other than the obvious increase of the fluorescein absorption peak (λ = 488 nm) at increasing peptide concentrations, a trend similar to that found for the non-fluorescent peptides, both in terms of absorbance decrease and of red shift of the plasmonic band.
The ΔAbs versus Δλ plots were found similar in this case for both peptides (insets Fig. 1c and d), suggesting a perturbative role of the fluorescein group in the side chain. However, the total wavelength shift, measured after reaching the saturation (at 5 μM of fluorescent peptide addition), was still higher for the RGD peptide (∼7 nm) than for the (GC) backbone peptide (∼5 nm), analogously to the trend observed for non-fluorescent peptides. Although the plasmonic response of the AgNPs at the interface with the fluorescent peptides was slightly different than the correspondent non-fluorescent one, likely owing to the steric hindrance of the FITC group, the general trends of peptide coverage were maintained.
According to the spectra reported in Fig. 1, the calculated coverage was of about 1.6 × 10¹⁰ peptide molecules/NP for both (GC)2 and RGD(GC)2 and of about 6.6 × 10⁹ peptide molecules/NP for both FITC-(GC)2 and FITC-RGD(GC)2, respectively.
It is to note that the spectral modification for all the peptide/AgNP assemblies studied was concomitant with the enhancing of brightness of the silver colloidal dispersion, explained in terms of stabilization towards aggregation, due to the nanoparticle coating by the biomolecules. Indeed, the freshly prepared dispersion of bare Ag NPs was pale yellow and turned, at the used experimental conditions, to brown-grey after few hours. Conversely, the hybrid peptide/metal nanoparticle system was much more stable, with the yellow colour retained on a time scale of days.
The flocculation assay, where an electrolyte solution is added to the colloidal dispersion to disrupt the electrostatic mechanism of stabilisation, was used to discriminate between the two possible processes responsible for the observed plasmonic shifts, i.e., particles aggregation and/or actual surface adsorption.
The UV-visible spectra upon the addition of NaCl to bare as well as to peptide-added nanoparticles are reported in Fig. S1 in ESI.† The plasmonic band of bare NPs significantly changed after the salt addition, with the dramatic decrease (about 60%) of absorbance at the peak maximum (A389 nm). This finding indicated that the electrolyte neutralized the surface charge of the AgNPs, i.e., the borohydride ions used both to reduce the ionic silver and to stabilize the formed nanoparticles. On the contrary, an almost negligible decrease of A498 nm (roughly 5–10%) was measured in the peptide-added NPs. On the basis of these data the actual formation of a peptide coating could be inferred. Such an adlayer, adsorbed both chemically and physically, acted as a shell around the metal core thus drastically decreasing the colloidal aggregation.
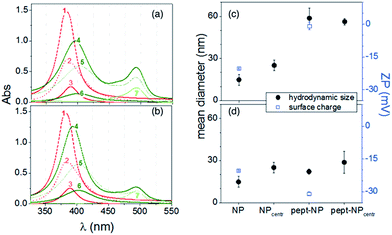
Fig. 2 shows the UV-visible spectra (Fig. 2a and b) before and after the centrifugation step, required to remove the loosely bound and/or unbound peptide molecules, in comparison with the results on the same samples of DLS and ζ-potential measurements (Fig. 2c and d).
The spectra of pellet recovered after the centrifugation of bare AgNP (Fig. 2a and b, curves 3) exhibited a red-shifts in comparison to as prepared dispersion (curve 1), corresponding to the hydrodynamic size increase, from about 15 nm (as prepared) to ∼25 nm (centrifuged) (Fig. 2c and d).
As to the hybrid peptide/silver nanoparticle system, the supernatant (curves 5) for both AgNP/FITC-(GC)2 (Fig. 2a) and AgNP/FITC-RGD(GC)2 (Fig. 2b) showed two absorption bands, assigned to the presence of both peptide-coated nanoparticles (λ ∼ 410 nm) and unbound peptides (λ ∼ 498 nm), respectively.
On the other hand, the spectra of re-suspended pellets (curves 6) exhibited only the band attributed to the silver nanoparticles coated by the peptide molecules, red-shifted with respect to the bare nanoparticle respectively of 14 nm for FITC-(GC)2 and 11 nm for FITC-RGD(GC)2.
A contribution to these spectral features could be attributed to a partial aggregation, as indicated by the DLS analyses, which showed a large increase of the hydrodynamic diameter to ∼60 nm for the re-suspended pellet of Ag/FITC-(GC)2 (Fig. 2c) and a minor size change to ∼29 nm for that of Ag/FITC-RGD(GC)2 (Fig. 2d).
The characterization by ζ-potential of the bare and peptide-coated NPs indicated that the anionic bare AgNPs (ZP ∼ −20 mV) were neutralised by FITC-(GC)2 peptide immobilization (ZP ∼ 0) and exhibited a further increase of the surface negative charge after the functionalisation with FITC-RGD(GC)2 (ZP ∼ −30 mV). A likely explanation of such a finding, according to the titration experiments discussed above, can be given in terms of the preferential orientation of anionic carboxylic groups (in the aspartic acid residue) and of the cationic guanidine group (in arginine) respectively outwards and towards the AgNP surface. It is to note that the charge neutralization of the nanoparticle upon the immobilisation of FITC-(GC)2 is in agreement with the observed aggregation effect, owing to the predominance of dispersive van der Waals attraction forces compared to the electrostatic repulsions among the AgNPs.
AFM results (Fig. 3) further confirmed the aggregation effect for AgNPs functionalised with (GC)2 peptide and clearly showed a different morphology of the nanoparticle surface, with the increase of average size after the peptides adsorption. Noteworthy, the phase images displayed a soft shell (brightest areas) in the RGD peptide-coated compared to the bare nanoparticles.
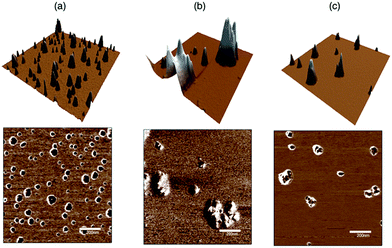 | ||
| Fig. 3 AFM topography (top, z scale = 25 nm) and phase (bottom) images on (1 μm × 1 μm) scan size of: (a) bare AgNP; (b) AgNP/FITC-(GC)2; (c) AgNP/FITC-RGD(GC)2. | ||
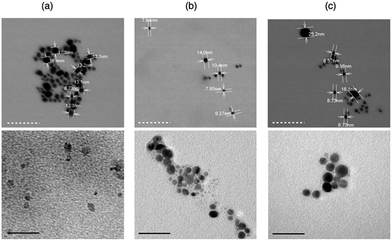
The characterization by SEM and TEM (Fig. 4) also confirmed the results discussed above.
In particular, the SEM micrographs of re-suspended pellets evidenced the presence of dimer aggregates, with average dimensions of about 20 nm. No significant difference compared to the bare nanoparticles (Fig. 4a) were found for both (GC)2-coated AgNP (Fig. 4b) and RGD(GC)2-coated AgNP (Fig. 4c).
On the other hand, the TEM micrographs displayed the successful peptide coating of the nanoparticles, as evidenced by the appearance of a uniform shell around the core metal.68
FT-IR spectra of hybrid AgNP/peptide systems, compared to the reference peptides and bare AgNP samples (Fig. S2 in ESI†), showed very similar spectral features. Both RGD(GC)2 and (GC)2 displayed the characteristic vibrational modes of amide I and II (1600–1400 cm−1), N–H (a sharp band around 3292 cm−1), C![[double bond, length as m-dash]](https://www.rsc.org/images/entities/char_e001.gif) O (1735 cm−1), C–O (1212 cm−1), aliphatic CH2 (1300 cm−1) and C–H (1300 cm−1), respectively. Furthermore, two weak peaks at 2450 and 2650 cm−1 were visible, due to the free cysteine (see insets in Fig. S2†). Upon the adsorption on the AgNPs surface, the whole spectra of (GC)2 and RGD(GC)2 were strongly affected: the amide I and II bands as well as the aliphatic chain peaks were still visible but less defined and the –NH peak sharper and shifted to 3342 cm−1 with respect to the peptides alone. Moreover, the peak related to –SH moieties was not any more visible, indicating that an actual chemisorption process occurred via the thiol moieties.69
O (1735 cm−1), C–O (1212 cm−1), aliphatic CH2 (1300 cm−1) and C–H (1300 cm−1), respectively. Furthermore, two weak peaks at 2450 and 2650 cm−1 were visible, due to the free cysteine (see insets in Fig. S2†). Upon the adsorption on the AgNPs surface, the whole spectra of (GC)2 and RGD(GC)2 were strongly affected: the amide I and II bands as well as the aliphatic chain peaks were still visible but less defined and the –NH peak sharper and shifted to 3342 cm−1 with respect to the peptides alone. Moreover, the peak related to –SH moieties was not any more visible, indicating that an actual chemisorption process occurred via the thiol moieties.69
Representative high resolution XPS spectra for the peptides as well as the peptide–AgNP systems are shown in Fig. 5.
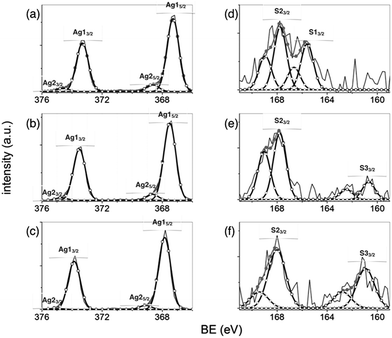 | ||
| Fig. 5 Representative high resolution spectra of Ag 3d (a–c) and S 2p (d–f) of bare Ag NP (a and d), AgNP/FITC-(GC)2 (b and e) and AgNP/FITC-RGD(GC)2 (c and f). | ||
The Ag 3d spectrum of bare silver nanoparticles (Fig. 5a) exhibited two series of doublet components 3d5/2 and 3d3/2, with full widths at half maximum (FWHM) of 0.8 eV and splitted each from the other of 6 eV, assigned to silver(I) oxide (Ag1 component, at binding energy (BE) = 367.3 ± 0.2 eV for Ag 3d5/2 and BE = 373.5 ± 0.2 eV for Ag 3d3/2) and to metal silver (Ag2 component, at BE = 368.2 ± 0.2 eV for Ag 3d5/2 and BE = 374.2 ± 0.2 eV for Ag 3d3/2),70 respectively.
In the peptide-coated AgNP samples, the Ag 3d peak shifted to higher binding energies, respectively of +0.2 eV for AgNP/FITC-(GC)2 (Fig. 5b) and of +0.5 eV for AgNP/FITC-RGD(GC)2 (Fig. 5c). These findings can be attributed to charge-transfer effects from the metal to the peptide molecules.71
A weak but still visible peak corresponding to S 2p signals was found in the various samples (Fig. 5d–f). In particular, two sulfur species were detected onto the uncoated Ag NPs (Fig. 5d), assigned to unbound disulfide (S1 component, S 2p3/2 BE ∼ 164 eV) and oxidized S atoms (S2 component, S 2p3/2 BE ∼ 168 eV), respectively. This behaviour is likely due to air exposure of the nanoparticles, S–O bonds in SO42− species of the MOPS buffer and/or X-ray irradiation effects.72 In the case of FITC-(GC)2 (Fig. 5e) and FITC-RGD(GC)2 (Fig. 5f) spectra, the peak around 162–163 eV (S3 component) can be assigned to sulphur atoms chemisorbed to the silver surface,73,74 while the component S3 around 169 eV is also associated to unbound S of cysteine.75
The quantitative XPS analysis confirmed the presence of the peptide in the hybrid peptide/silver nanoparticle assemblies by the detection of nitrogen and sulphur signals, not found in the bare AgNPs (Table S1 in ESI†). Bare AgNPs showed an actual surface atomic composition consistent with a metal substrate covered with an organic overlayer, according to the carbon and oxygen contents respectively of about 74% and 23%. The peptide molecules are expected to replace the shell of stabilisers ions wrapping the metallic core. Accordingly, the C/O ratio changed from ∼3.2 in uncoated Ag NPs to ∼2.6 in FITC-(GC)2/AgNP and ∼2.3 for FITC-RGD(GC)2/AgNP, respectively.
An exhaustive picture of the AgNP/peptide systems was given by ToF-SIMS analysis. Positive ToF-SIMS spectra (Fig. S3 in ESI†) of AgNPs, AgNP/FITC-(GC)2 and AgNP/FITC-RGD(GC)2 samples exhibited many peaks, as typical in ToF-SIMS spectra of peptides and proteins,76,77 globally similar but with some differences in their relative intensities.
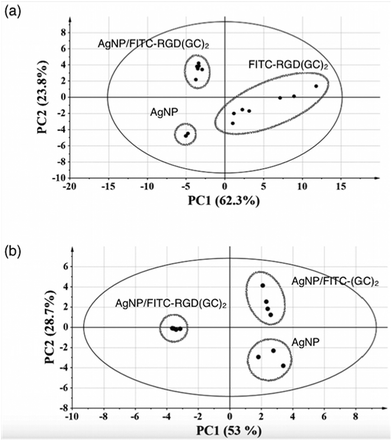
The PCA method used to wisely analyse the ToF-SIMS spectra, and the corresponding results are shown in Fig. 6.
In this plot, each individual point represents the ToF-SIMS spectrum acquired at a specific location of the sample. PC1 and PC2 are represented by the horizontal and the vertical axis, respectively.
In particular, Fig. 6a, showing the score plots from the PCA study of the positive ToF-SIMS spectra for AgNP, FITC-RGD(GC)2 and AgNP/FITC-RGD(GC)2, reveals that the 3 samples are clearly discriminated, i.e. located in distinct regions in the PC1–PC2 plan.
The two first PCs together capture 86.1% of the data variance. More precisely, PC1 and PC2 represent 62.3% and 23.8% of the variance, respectively. Since most of the data variance is captured by PC1, it allows the samples corresponding to uncovered- and peptide functionalized samples to be discriminated from each other.78 Specifically, the shifts in PC1 values for AgNP/FITC-RGD(GC)2 samples compared to AgNP are indicative of the surface chemical modifications of the bare silver nanoparticles by the binding of FITC-RGD(GC)2 molecules. Indeed, the AgNP/FITC-RGD(GC)2 sample is located at the PC1 value of −3.4 ± −0.1, which is higher than the corresponding value of AgNP (PC1 = −4.9 ± 0.1), whereas FITC-RGD(GC)2 peptide reference sample, located at PC1 > 0, exhibited a significant dispersion along both PC1 and PC2, which is typically encountered in the ToF-SIMS analysis of proteins.76,77
The most significant peaks in the PCA model at PC1 < 0, are those relative to Ag and 109Ag peaks, with a maximum statistical weights of 58%. The characteristic ionized fragments associated with the peptides reference samples are various carbonaceous fragments, including the fragment C2H10SN+, characteristic of the cysteine. The slight difference in PC1 value between AgNP/FITC-RGD(GC)2 and AgNPs samples can be attributed to a low but significant chemical modification of the silver nanoparticles by the peptide. Examination of PC2 helps to further discriminate between AgNP/FITC-RGD(GC)2 and AgNPs samples. Indeed, the most significant peaks for the AgNP/peptide samples were carbonaceous fragments, and CH4N+, which is encountered in most of the amino acids. These observations highlight the potentialities of ToF-SIMS together with PCA analysis to chemically characterize various functionalization routes of silver nanoparticles.
The negative ion ToF-SIMS spectra may be relevant to the characterization of Ag–S interfacial bonds, because of sulphur atoms that give rise to intense S− ions. The PCA score plots obtained from the model composed of AgNP, AgNP/FITC-(GC)2 and AgNP/FITC-RGD(GC)2 samples is shown in Fig. 6b.
In this case PC1 and PC2 together take into account 81.7% of the variance, and, according to PC1, spectra from AgNP/FITC-RGD(GC)2 (PC1 score = −3.47 ± 0.09) are well separated from the groups formed by AgNP and AgNP/FITC-(GC)2, which instead are located close each other at PC1 scores of 2.65 ± 0.46 and 2.35 ± 0.10, respectively. Nevertheless, PC2, that explains 28.7% of the overall variance, indicates that bare AgNP (PC2 < 0) are parted both from AgNP/FITC-(GC)2 (PC2 > 0, 2.43 ± 0.62) and AgNP/FITC-RGD(GC)2 (PC2 ≈ 0, −0.14 ± 0.02).
The characteristic ionized fragments associated with PC1 (loadings > 90%) and with PC2 (loadings > 50%) are listed in Table S2 in ESI.† As to the column PC1 < 0 (namely the AgNP/FITC-RGD(GC)2 sample), the two fragments of CN− and CNO−, characteristics respectively of amine and amide moieties were found. On the other hand, the AgNP/FITC-(GC)2 sample (PC2 > 0 column) showed S− and HS− ions, characteristic of the cysteine amino acid. These findings can be related to the differences in size as well as conformation of FITC-(GC)2 compared to FITC-RGD(GC)2.76 ToF-SIMS analysis could not detect a clear evidence of Ag–S bonds (at the near-surface region). This fact can be explained by differences in the ordered arrangement of the peptide molecules at the nanoparticle surface, with a thickness of the adlayer higher than the ≈1 nm (top-surface region), which is the depth probed by the ToF-SIMS technique.
It is noteworthy that the ToF-SIMS technique presents a sensitivity of 1–2 order of magnitude higher than the XPS technique. Indeed, XPS analyses discussed above clearly revealed signals from sulphur moieties in the hybrid AgNP/peptide samples but with a very low intensity of the S 2p line related to thiolate bound to silver (at 162 eV of binding energy) compared to the intense sulphate line with S 2p. This behaviour can be attributed to a lack in sensitivity for the presence of signals from the MOPS![[thin space (1/6-em)]](https://www.rsc.org/images/entities/char_2009.gif) :
:![[thin space (1/6-em)]](https://www.rsc.org/images/entities/char_2009.gif) TCEP buffer used to dissolve the peptides.
TCEP buffer used to dissolve the peptides.
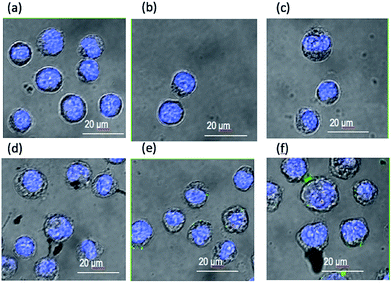
Proof-of-work cellular experiments of confocal microscopy imaging were performed to assess the capability of the AgNP/peptide hybrid systems to be internalized by two different cell lines, overexpressing the vitronectin receptor (αvβ3) and fibronectin receptor (α5β1) integrins, respectively.
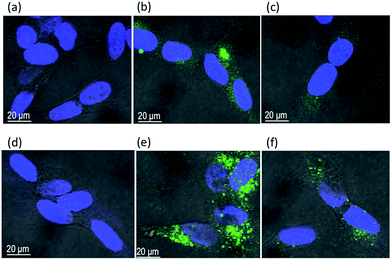
Fig. 7 and 8 show the representative images of neuroblastoma and K562 cells after the treatment with the peptide-conjugated AgNPs. The green fluorescence (excitation wavelength of 488 nm, FITC) allows for the tracking of the fluorescein-labelled peptides and the blue emission (excitation wavelength of 405 nm, DAPI) is due to the nuclear staining, respectively.
Neuroblastoma cells treated with FITC-(GC)2 (Fig. 7b) and FITC-RGD(GC)2 (Fig. 7c) exhibited a diffuse green intracellular fluorescence. The comparison with control untreated cells (Fig. 7a) as well as cells treated with the bare nanoparticles (Fig. 7d) evidences slight differences in the cellular uptake of the two peptides, in terms both of different sub-cellular localization and of intracellular accumulation, e.g., a less spread and more intense green fluorescence for cells treated with FITC-(GC)2 than those treated with FITC-RGD(GC)2. For SH-SY5Y cells incubated with AgNP/FITC-(GC)2 (Fig. 7e) and AgNP/FITC-RGD(GC)2 (Fig. 7f), the trend displayed was similar to that found in cells incubated with the free peptides, but an amplified fluorescence was visible. It must be noted that fluorescence spectra in solution of the free peptides evidenced instead a decrease in the FITC emission, of about 40% for both peptides, in the presence of AgNP (Fig. S4 in ESI†). Therefore, the peptides immobilized onto the AgNPs actually exhibited a higher internalization, due to the sum of passive transport, related to the nanoparticle carrier, and the active transport, related to the specific peptide sequence. The observed differences, i.e., lower cellular uptake when RGD is in the peptide sequence, can also be related to steric hindrance effects.
As to leukaemia K562 cells, Fig. 8 shows that unbound FITC-(GC)2 (Fig. 8b) and FITC-RGD(GC)2 (Fig. 8c) peptides are not internalized by the cells at the used experimental conditions. However, AgNPs were visible in the close proximity and/or at the cell membrane (Fig. 8d, dark spots, assigned to nanoparticle aggregates) and also, for the cells treated with the hybrid AgNP/peptide systems, a slight green fluorescence, which revealed the effective cell targeting by the peptide molecules through the nanoparticle carriers. Such a fluorescence was mostly confined at the cell membrane, visibly lower for cells incubated with AgNP/FITC-(GC)2 (Fig. 8e) than those treated with AgNP/FITC-RGD(GC)2 (Fig. 8f). Therefore, the AgNP/peptide platform was effective to achieve a cellular membrane–peptides interaction that could not be reached, at the same experimental conditions, with the free peptides. Moreover, also in this case, some peptide-specific differences at the cellular biointerface occurred, therefore suggesting that the peptide immobilized at the surface of the silver nanoparticle still maintained its activity towards the specific integrin receptor.
It is to note that, upon incorporation by an organism, nanoparticles interact with extracellular biomolecules dissolved in body fluids, including proteins, sugars and lipids prior to their encounter with the plasma membranes of cells. A layer of proteins forms at the nanoparticle surface, the so-called protein corona. Consequently, cell surface receptors, which activate the endocytosis machinery, actually encounter enshrouded nanoparticles rather than bare particles.79,80 Similarly, at the experimental conditions used for imaging the cellular uptake, it is expected that serum proteins added to the culture medium cover the nanoparticles. According to these considerations, the results obtained clearly demonstrate that the hybrid peptide/AgNPs assemblies still keep some specific activity in the uptake by neuroblastoma SH-SY5Y and leukaemia K562 cells, likely related to the specific peptide sequence, i.e., the RGD moiety, towards αvβ3 and α5β1 integrins, respectively. Moreover, the different cellular uptake showed by the two cell lines pointed to certain cell selectivity towards the uptake of the peptide-coated nanoparticles, thus ruling out a predominant role of simple ‘passive’ pathway of nanoparticles internalization due to diffusion.
It is to note that the effects of the binding to α5β1 and αvβ3 depend on signaling pathways specific for these integrins. Moreover, integrins require activation from the inside of the cell to be able to bind their ligand outside the cell. High α5β1 expression and abundant matrix formation also suppress tumorigenicity in vivo, whereas perturbing the function of α5β1 with peptides that block its ligand binding suppresses experimental metastasis.60 Effecting these changes in tumor cells by a theranostic platform such as the AgNP/RGD-peptide assembly may provide new potentially highly effective cancer therapies. Further experiments, by staining cellular organelles such as lysosomes, mitochondria and Golgi with the respective dyes, are planned to map precisely by co-localization analysis the fate of the peptide-conjugated AgNP nanoplatform inside the cells.
4 Conclusions
In summary, a fluorescein-conjugated cyclic RGD peptide, encompassing a glycine–cysteine stretch, was successfully immobilized on spherical silver nanoparticles of 13 nm of diameter. A predominant chemisorption driven by the covalent binding of thiol moieties of the cysteine residues to the metallic nanoparticle surface was obtained. Additional contributions from electrostatic interactions between the anionic AgNP and the cationic arginine residue were figured out.UV-visible, XPS and FTIR spectroscopies, ToF-SIMS spectrometry, atomic force microscopy and scanning electron microscopies demonstrated, in the case of the RGD-containing polypeptide, an additive electrostatics contribution in the biomolecule–AgNP interaction. This, in turn, resulted in different particle coverage and average peptide conformation at the hybrid interface. ζ-Potential and DLS measurements confirmed different surface charges and nanoparticle stability towards aggregation, respectively.
Proof-of-work experiments of cellular uptake by confocal microscopy demonstrated different interaction levels of the assembled nanoplatforms at the cell membrane in neuroblastoma and leukaemia cells, overexpressing respectively αvβ3 and α5β1 integrins, demonstrated a receptor-specific activity of the RGD peptide-functionalised AgNPs, which make them very promising as multifaceted platform in applications with cells and bacteria.
Acknowledgements
Authors acknowledge Programma Operativo Nazionale Ricerca e Competitivita' 2007–2013 PON 01_01078. R. Snyders acknowledges the support of the Belgian Government (Belspo) through the “Pôle d'attraction interuniversitaire” (PAI, P07/14, “Plasma–Surface Interaction”, ψ).Notes and references
- H. Wang, R. L. Han, L. M. Yang, J. H. Shi, Z. J. Liu, Y. Hu, Y. Wang, S. J. Liu and Y. Gan, ACS Appl. Mater. Interfaces, 2016, 8, 4416–4423 CAS
.
- J. T. Cole and N. B. Holland, Drug Delivery Transl. Res., 2015, 5, 295–309 CrossRef CAS PubMed
.
- P. D. Pietro, G. Strano, L. Zuccarello and C. Satriano, Curr. Top. Med. Chem., 2016, 16, 3069–3102 CrossRef PubMed
.
- K. Kumar, S. Kumar Doddi, M. Kalle Arunasree and P. Paik, Dalton Trans., 2015, 44, 4308–4317 RSC
.
- P. Paik and Y. Zhang, Nanoscale, 2011, 3, 2215–2219 RSC
.
- M. I. Montañez, F. Najera, C. Mayorga, A. J. Ruiz-Sanchez, Y. Vida, D. Collado, M. Blanca, M. J. Torres and E. Perez-Inestrosa, Nanomedicine: Nanotechnology, Biology and Medicine, 2015, 11, 579–588 CrossRef PubMed
.
- M. Liu, L. Gan, L. Chen, Z. Xu, D. Zhu, Z. Hao and L. Chen, Langmuir, 2012, 28, 10725–10732 CrossRef CAS PubMed
.
- S. Chen, X. Hao, X. Liang, Q. Zhang, C. Zhang, G. Zhou, S. Shen, G. Jia and J. Zhang, J. Biomed. Nanotechnol., 2016, 12, 1–27 CrossRef CAS PubMed
.
- S. Gwo, H. Y. Chen, M. H. Lin, L. Sun and X. Li, Chem. Soc. Rev., 2016, 45, 5672–5716 RSC
.
- R. R. Arvizo, S. Bhattacharyya, R. A. Kudgus, K. Giri, R. Bhattacharya and P. Mukherjee, Chem. Soc. Rev., 2012, 41, 2943–2970 RSC
.
- H. Sharma, P. K. Mishra, S. Talegaonkar and B. Vaidya, Drug Discovery Today, 2015, 20, 1143–1151 CrossRef CAS PubMed
.
- G. Forte, A. Travaglia, A. Magri, C. Satriano and D. La Mendola, Phys. Chem. Chem. Phys., 2014, 16, 1536–1544 RSC
.
- C. Satriano, G. M. Messina, C. Marino, I. Aiello, E. Conte, D. La Mendola, D. A. Distefano, F. D'Alessandro, G. Pappalardo and G. Impellizzeri, J. Colloid Interface Sci., 2010, 341, 232–239 CrossRef CAS PubMed
.
- K. Shakesheff, S. Cannizzaro and R. Langer, J. Biomater. Sci., Polym. Ed., 1998, 9, 507–518 CrossRef CAS PubMed
.
- J. T. Marques, A. S. Viana and R. F. de Almeida, Langmuir, 2014, 30, 12627–12637 CrossRef CAS PubMed
.
- A. R. Piper-Feldkamp, M. Wegner, P. Brzezinski and S. M. Reed, J. Phys. Chem. B, 2013, 117, 2113–2122 CrossRef CAS PubMed
.
- C. Satriano, M. Edvardsson, G. Ohlsson, G. Wang, S. Svedhem and B. Kasemo, Langmuir, 2010, 26, 5715–5725 CrossRef CAS PubMed
.
- M. N. Andalib, Y. Dzenis, H. J. Donahue and J. Y. Lim, Biomater. Res., 2016, 20, 11 CrossRef PubMed
.
- X. Ren, Y. Feng, J. Guo, H. Wang, Q. Li, J. Yang, X. Hao, J. Lv, N. Ma and W. Li, Chem. Soc. Rev., 2015, 44, 5680–5742 RSC
.
- C. Satriano, M. Fragalà, G. Forte, A. Santoro, D. La Mendola and B. Kasemo, Soft Matter, 2012, 8, 53–56 RSC
.
- S. Carnazza, C. Satriano, S. Guglielmino and G. Marletta, J. Colloid Interface Sci., 2005, 289, 386–393 CrossRef CAS PubMed
.
- R. Kargupta, S. Bok, C. M. Darr, B. D. Crist, K. Gangopadhyay, S. Gangopadhyay and S. Sengupta, Wiley Interdiscip. Rev.: Nanomed. Nanobiotechnol., 2014, 6, 475–495 CrossRef CAS PubMed
.
- K. G. Neoh, X. Hu, D. Zheng and E. T. Kang, Biomaterials, 2012, 33, 2813–2822 CrossRef CAS PubMed
.
- T. Wang, J. Bai, X. Jiang and G. U. Nienhaus, ACS Nano, 2012, 6, 1251–1259 CrossRef CAS PubMed
.
- A. Verma, O. Uzun, Y. Hu, Y. Hu, H. S. Han, N. Watson, S. Chen, D. J. Irvine and F. Stellacci, Nat. Mater., 2008, 7, 588–595 CrossRef CAS PubMed
.
- J. Yu, S. A. Patel and R. M. Dickson, Angew. Chem., Int. Ed. Engl., 2007, 46, 2028–2030 CrossRef CAS PubMed
.
- J. S. Desgrosellier and D. A. Cheresh, Nat. Rev. Cancer, 2010, 10, 9–22 CrossRef CAS PubMed
.
- H. Gao, Z. Yang, S. Zhang, S. Cao, S. Shen, Z. Pang and X. Jiang, Sci. Rep., 2013, 3, 2534 CrossRef CAS PubMed
.
- Y. Liu and W. Lu, Expert Opin. Drug Delivery, 2012, 9, 671–686 CrossRef CAS PubMed
.
- C. J. Avraamides, B. Garmy-Susini and J. A. Varner, Nat. Rev. Cancer, 2008, 8, 604–617 CrossRef CAS PubMed
.
- K. Switala-Jelen, K. Dabrowska, A. Opolski, L. Lipinska, M. Nowaczyk and A. Gorski, Folia Biol., 2004, 50, 143–152 CAS
.
- K. Ley, J. Rivera-Nieves, W. J. Sandborn and S. Shattil, Nat. Rev. Drug Discovery, 2016, 15, 173–183 CrossRef CAS PubMed
.
- E. Ruoslahti and M. D. Pierschbacher, Science, 1987, 238, 491–497 CAS
.
- G. Scari, F. Porta, U. Fascio, S. Avvakumova, V. Dal Santo, M. De Simone, M. Saviano, M. Leone, A. Del Gatto, C. Pedone and L. Zaccaro, Bioconjugate Chem., 2012, 23, 340–349 CrossRef CAS PubMed
.
- G. Valente, N. Depalo, I. de Paola, R. M. Iacobazzi, N. Denora, V. Laquintana, R. Comparelli, E. Altamura, T. Latronico, M. Altomare, E. Fanizza, M. Striccoli, A. Agostiano, M. Saviano, A. Del Gatto, L. Zaccaro and M. L. Curri, Nano Res., 2016, 644–662 CrossRef CAS
.
- J. M. de la Fuente, C. C. Berry, M. O. Riehle and A. S. Curtis, Langmuir, 2006, 22, 3286–3293 CrossRef CAS PubMed
.
- Z. Li, P. Huang, X. Zhang, J. Lin, S. Yang, B. Liu, F. Gao, P. Xi, Q. Ren and D. Cui, Mol. Pharm., 2010, 7, 94–104 CrossRef CAS PubMed
.
- B. Kang, M. A. Mackey and M. A. El-Sayed, J.
Am. Chem. Soc., 2010, 132, 1517–1519 CrossRef CAS PubMed
.
- L. Xiao, H. Wang and Z. D. Schultz, Anal. Chem., 2016, 88, 6547–6553 CrossRef PubMed
.
- F. C. Gaertner, H. Kessler, H. J. Wester, M. Schwaiger and A. J. Beer, Eur. J. Nucl. Med. Mol. Imaging, 2012, 39(1), S126–S138 CrossRef PubMed
.
- S. Liu, Mol. Pharm., 2006, 3, 472–487 CrossRef CAS PubMed
.
- Z. Krpetic, P. Nativo, F. Porta and M. Brust, Bioconjugate Chem., 2009, 20, 619–624 CrossRef CAS PubMed
.
- C. C. Shen, W. L. Tseng and M. M. Hsieh, J. Chromatogr. A, 2012, 1220, 162–168 CrossRef CAS PubMed
.
- D. Arosio, L. Manzoni, E. M. Araldi and C. Scolastico, Bioconjugate Chem., 2011, 22, 664–672 CrossRef CAS PubMed
.
- W. Poon, X. Zhang, D. Bekah, J. G. Teodoro and J. L. Nadeau, Nanotechnology, 2015, 26, 285101 CrossRef PubMed
.
- Y. H. Kim, J. Jeon, S. H. Hong, W. K. Rhim, Y. S. Lee, H. Youn, J. K. Chung, M. C. Lee, D. S. Lee, K. W. Kang and J. M. Nam, Small, 2011, 7, 2052–2060 CrossRef CAS PubMed
.
- K. S. Lee and M. A. El-Sayed, J. Phys. Chem. B, 2006, 110, 19220–19225 CrossRef CAS PubMed
.
- R. Dastjerdi and M. Montazer, Colloids Surf., B, 2010, 79, 5–18 CrossRef CAS PubMed
.
- M. Rai, A. Yadav and A. Gade, Biotechnol. Adv., 2009, 27, 76–83 CrossRef CAS PubMed
.
- C. R. Patra, S. Mukherjee and R. Kotcherlakota, Nanomedicine, 2014, 9, 1445–1448 CrossRef CAS PubMed
.
- L. A. Austin, B. Kang, C. W. Yen and M. A. El-Sayed, J. Am. Chem. Soc., 2011, 133, 17594–17597 CrossRef CAS PubMed
.
- S. Sun, C. Zhou, S. Chen, J. Liu, J. Yu, J. Chilek, L. Zhao, M. Yu, R. Vinluan, B. Huang and J. Zheng, Bioconjugate Chem., 2014, 25, 453–459 CrossRef CAS PubMed
.
- K. Kalishwaralal, S. Barathmanikanth, S. R. Pandian, V. Deepak and S. Gurunathan, J. Controlled Release, 2010, 145, 76–90 CrossRef CAS PubMed
.
- S. Zitzmann, V. Ehemann and M. Schwab, Cancer Res., 2002, 62, 5139–5143 CAS
.
- E. S. Choi, W. J. Rettig, E. A. Wayner, M. L. Srour and D. O. Clegg, J. Neurosci. Res., 1994, 37, 475–488 CrossRef CAS PubMed
.
- A. Venkatasubramaniam, A. Drude and T. Good, Biochim. Biophys. Acta, 2014, 1838, 2568–2577 CrossRef CAS PubMed
.
- E. Ruoslahti, Tumor Biol., 1996, 17, 117–124 CrossRef CAS
.
- C. R. Hauck, F. Agerer, P. Muenzner and T. Schmitter, Eur. J. Cell Biol., 2006, 85, 235–242 CrossRef CAS PubMed
.
- D. Cue, S. O. Southern, P. J. Southern, J. Prabhakar, W. Lorelli, J. M. Smallheer, S. A. Mousa and P. P. Cleary, Proc. Natl. Acad. Sci. U. S. A., 2000, 97, 2858–2863 CrossRef CAS PubMed
.
- S. D. Blystone, I. L. Graham, F. P. Lindberg and E. J. Brown, J. Cell Biol., 1994, 127, 1129–1137 CrossRef CAS PubMed
.
- L. Mulfinger, S. D. Solomon, M. Bahadory, A. V. Jeyarajasingam, S. A. Rutkowsky and C. Boritz, J. Chem. Educ., 2007, 84, 322–325 CrossRef
.
- D. Paramelle, A. Sadovoy, S. Gorelik, P. Free, J. Hobley and D. G. Fernig, Analyst, 2014, 139, 4855–4861 RSC
.
- X. Liu, M. Atwater, J. Wang and Q. Huo, Colloids Surf., B, 2007, 58, 3–7 CrossRef CAS PubMed
.
- F. Dong, E. Valsami-Jones and J.-U. Kreft, J. Nanopart. Res., 2016, 18, 259–270 CrossRef PubMed
.
- T. S. Peretyazhko, Q. Zhang and V. L. Colvin, Environ. Sci. Technol., 2014, 48, 11954–11961 CrossRef CAS PubMed
.
- L. Denis, D. Cossement, T. Godfroid, F. Renaux, C. Bittencourt, R. Snyders and M. Hecq, Plasma Processes Polym., 2009, 6, 199–208 CrossRef CAS
.
- K. Siriwardana, A. Wang, M. Gadogbe, W. E. Collier, N. C. Fitzkee and D. Zhang, J. Phys. Chem. C, 2015, 119, 2910–2916 CAS
.
- L. Y. Chou, F. Song and W. C. Chan, J. Am. Chem. Soc., 2016, 138, 4565–4572 CrossRef CAS PubMed
.
- P. Graf, A. Mantion, A. Foelske, A. Shkilnyy, A. Masic, A. F. Thunemann and A. Taubert, Chem.–Eur. J., 2009, 15, 5831–5844 CrossRef CAS PubMed
.
- J. F. Moulder and J. Chastain, Handbook of X-Ray Photoelectron Spectroscopy: A Reference Book of Standard Spectra for Identification and Interpretation of XPS Data, Minn: Physical Electronics Division, Perkin-Elmer Corp, Eden Prairie, 1992 Search PubMed
.
- A. Martí, A. M. Costero, P. Gaviña, S. Gil, M. Parra, M. Brotons-Gisbert and J. F. Sánchez-Royo, Eur. J. Org. Chem., 2013, 2013, 4770–4779 CrossRef
.
- D. G. Castner, K. Hinds and D. W. Grainger, Langmuir, 1996, 12, 5083–5086 CrossRef CAS
.
- A. Semenov, J. P. Spatz, M. Moller, J. M. Lehn, B. Sell, D. Schubert, C. H. Weidl and U. S. Schubert, Angew. Chem., Int. Ed., 1999, 38, 2547–2550 CrossRef CAS
.
- C.-J. Zhong and M. D. Porter, J. Am. Chem. Soc., 1994, 116, 11616–11617 CrossRef CAS
.
- O. Cavalleri, L. Oliveri, A. Daccà, R. Parodi and R. Rolandi, Appl. Surf. Sci., 2001, 175–176, 357–362 CrossRef CAS
.
- P. Bertrand, Appl. Surf. Sci., 2006, 252, 6986–6991 CrossRef CAS
.
- M. S. Wagner and D. G. Castner, Langmuir, 2001, 17, 4649–4660 CrossRef CAS
.
- L. Eriksson and Umetrics, Multi- and megavariate data analysis: basic principles and applications, MKS Umetrics, Malmö, 3 rev. edn, 2013 Search PubMed
.
- M. Lundqvist, J. Stigler, G. Elia, I. Lynch, T. Cedervall and K. A. Dawson, Proc. Natl. Acad. Sci. U. S. A., 2008, 105, 14265–14270 CrossRef CAS PubMed
.
- L. Treuel, X. Jiang and G. U. Nienhaus, J. R. Soc., Interface, 2013, 10, 20120939 CrossRef PubMed
.
Footnotes |
| † Electronic supplementary information (ESI) available: Fig. S1: UV-visible spectra of AgNP and peptide–AgNP upon NaCl addition; Fig. S2: FT-IR analysis of hybrid AgNP/peptide systems compared to the reference peptides and bare AgNPs; Table S1: surface atomic composition of bare and peptide-functionalized AgNPs; Fig. S3: positive ToF-SIMS spectra; Table S2: significant peaks from PCA analysis of negative ToF-SIMS spectra. Fig. S4: fluorescence spectra. See DOI: 10.1039/c6ra21568h |
| ‡ From a geometric point of view, the PCA is a projection method that turns the initial swarm of points (the samples) of the multidimensional system with n axes (n is the number of ToF-SIMS peaks considered) into a highly lowered dimensional system (2 to 3), the new axes being the principal components (PCi). These new PCi components display, inside the initial n-dimensional space, the main directions along which the swarm of points is the most extended (i.e. maximum variance). Additionally, from an algebraic point of view, the PCA calculation decomposes the initial matrix, constituted from the intensities (“the variables”) and the samples (“the observations”), into a new set of three matrices, the scores, coordinates of the samples onto the new principal components, the loadings, statistical weights of contribution of the ToF-SIMS peaks to the principal components, and the residuals, random and unexplained variation, respectively. |
| This journal is © The Royal Society of Chemistry 2016 |

