Photophysical properties of asymmetric and water-soluble dinuclear lanthanide complexes of poly glycol chain functionalized-benzoic acid derivative: experimental and theoretical approaches

G. Z. Bossharda, G. A. Britoa, J. H. S. K. Monteirob, A. de Bettencourt-Diasb, I. O. Mazalia and F. A. Sigoli*a
aLaboratory of Functional Materials, Institute of Chemistry, Unicamp, Campinas, SP, Brazil. E-mail: fsigoli@iqm.unicamp.br
bDepartment of Chemistry, University of Nevada, Reno, NV, USA

Received 26th August 2016 , Accepted 19th October 2016

First published on 19th October 2016


Abstract

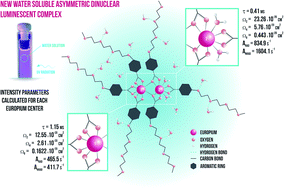
New water-soluble lanthanide complexes with a poly glycol chain (–OEtOEtOEtOMe) functionalized benzoic acid derivative ligand were synthesized and photophysically characterized. The results indicate a formation of an asymmetric dinuclear lanthanide complexes. The [Eu2(mee)6(H2O)2] complex shows emission in water solution and it was noted that after 48 h part of the ligands are replaced by water molecules resulting on quenching of the emission and decreasing of lifetimes by O–H oscillators from water molecules. The average Judd–Ofelt intensity parameters were determined experimentally from emission spectra of the europium(III) complex. Additionally, the contribution of each asymmetric europium(III) center to the JO intensity parameters were calculated independently using time resolved spectroscopy and the LUMPAC software helping the proposition of the polyhedral coordination sphere determined by the ground state geometry using the Sparkle/PM3 model. The transfer and back energy transfer rates were also calculated. The values obtained for energy transfer rates are lower than previous values obtained for europium(III) complexes with benzoic acid derivative ligands, indicating the role of the poly glycol chain on photophysical properties of the [Eu2(mee)6(H2O)2] complex.


Introduction

Lanthanide-based materials have unique photophysical properties and therefore a broad range of applications, such as displays, sensors and especially luminescent markers in biological systems. The latter application has drawn the attention of the scientific community, as the long emission lifetimes in the μs to ms range allows the rejection of the short-lived emission from the biological tissues.1 Strong coordination of the ligand to trivalent lanthanide ions and water solubility of the complexes are important factors for biological applications, and for asymmetric catalysis in organic synthesis.1,2 Ligands derived from benzoic acid easily coordinate to lanthanide(III) ions. However, the applications of resulting lanthanide complexes are usually in the solid state, due to the low solubility of this class of complexes. Li and co-workers showed that complexes with the benzoic acid nitrogen mustard (banm) ligand are soluble in water with 10% dimethyl sulfoxide (dmso) and show an inhibitory effect against K562 and Vero cell lines.3 Bünzli and co-workers showed that water solubility of lanthanide(III) complexes can be achieved upon functionalizing the ligand with a glycol chain, –O(CH2CH2O)nCH3.4,5 The strategy of adding glycol chains into the ligand structure was successfully pursued by Maury and co-workers6,7 and also by de Bettencourt-Dias and co-workers.8 Tuck and co-workers reported the addition of carbon chains such as 3,5-bis((R)-2,3-dihydroxypropoxy)benzoate and 3,4,5-tris((R)-2,3-dihydroxypropoxy)benzoate to benzoic acid ligand to achieve water solubility of the complexes and demonstrated that these can be used as asymmetric catalysts for epoxide ring opening reactions.9

Facing the possibility of increasing the water solubility of lanthanide benzoate complexes, this work reports a facile synthesis of a poly glycol chain (–OEtOEtOEtOMe) benzoic acid derivative ligand (Scheme 1) that can be used in the preparation of luminescent water-soluble lanthanide(III) complexes and their chemical stability in water solution. The benzoic acid derivative ligand was characterized by 1H-NMR and 13C-NMR, FT-IR spectroscopy and mass spectrometry. The lanthanide(III) complexes (Ln = EuIII, GdIII and TbIII) were characterized by high resolution mass spectrometry, TGA, FT-IR and photoluminescence spectroscopies. The photophysical properties were extensively studied in both solid state, in water and acetonitrile solutions. Experimental photophysical parameters were compared to theoretical ones in order to propose a polyhedral coordination sphere and also to give insights about the ligands exchange in water solution.


image file: c6ra21487h-s1.tif
Scheme 1 Synthetic route to obtain the ligand Hmee (3).

Experimental section

Synthesis of the ligand and complexes

All solvents and the p-toluenesulphonyl chloride were dried and purified, respectively, according to the standard methods. The synthetic route to obtain the ligand 4-(2-(2-(2-methoxyethoxy)ethoxy)ethoxy)benzoic acid (Hmee) is represented in the Scheme 1.

2-(2-(2-Methoxyethoxy)ethoxy)ethyl 4-methylbenzenesulfonate (1)10,11

6.0 g (31.5 mmol) of p-toluenesulphonyl chloride and 5.04 mL (31.5 mmol) of 2-(2-(2-methoxyethoxy)ethoxy)ethanol were dissolved in 81 mL of CH2Cl2 followed by the addition of 5.48 mL (39.4 mmol) of triethylamine. The system was kept under stirring at 9 °C for 20 h. The reaction was quenched with sodium bicarbonate solution and extracted with ethyl acetate (3 × 30 mL), dried under Na2SO4, filtered and the solvent was removed under reduced pressure to yield a colorless oil that was used in the next step without further purification. Yield: 9.56 g (95%). 1H-NMR (400 MHz, CDCl3): δ 7.73–7.79 (m, Ar, 2H), 7.31 (d, Ar, J = 8.1 Hz, 2H), 4.16–4.09 (m, CH2, 2H), 3.67–3.62 (m, CH2, 2H), 3.60–3.53 (m, CH2, 2H), 3.51–3.46 (m, CH2, 2H), 3.33 (s, CH3, 3H), 2.41 (s, CH3, 3H) ppm. 13C-NMR (100 MHz, CDCl3): δ 144.8, 133.0, 129.8, 128.0, 72.5, 71.9, 70.7, 70.5, 69.3, 68.6, 59.0, 21.6 ppm (ESI-Fig. S1).

Methyl 4-(2-(2-(2-methoxyethoxy)ethoxy)ethoxy)benzoate (2)10

7.70 g (55.7 mmol) of potassium carbonate, 0.45 g (1.7 mmol) of 18-crown-6 and 1.84 g (10 mmol) of methyl 4-hydroxybenzoate were added to a solution containing 4.56 g (10 mmol) of the freshly prepared 1 in acetone to yield a pale yellow suspension. The system was kept under stirring and nitrogen atmosphere at 55 °C for 22 h. The reaction was quenched with water and the product extracted with ethyl acetate and purified through a silica chromatographic column using ethyl acetate[thin space (1/6-em)]:[thin space (1/6-em)]hexane (1[thin space (1/6-em)]:[thin space (1/6-em)]1) as eluent to yield a colourless oil. Yield: 2.56 g (72%). 1H-NMR (400 MHz, CDCl3): δ 8.06–7.94 (m, CH, 2H), 6.99–6.88 (m, CH, 2H), 4.35 (q, J = 7.1 Hz, CH2, 2H), 4.21–4.17 (m, CH2, 2H), 3.91–3.86 (m, CH2, 2H), 3.75 (dd, J = 5.9 and 3.5 Hz, CH2, 2H), 3.72–3.64 (m, CH2, 4H), 3.58–3.53 (m, CH2, 2H), 3.38 (s, CH3, 3H), 1.38 (t, J = 7.1 Hz, 3H) ppm. 13C-NMR (100 MHz, CDCl3): δ 166.3, 162.5, 131.5, 123.1, 114.1, 71.9, 70.9, 70.7, 70.6, 69.6, 67.6, 60.6, 59.0, 14.4 ppm (ESI-Fig. S2).

4-(2-(2-(2-Methoxyethoxy)ethoxy)ethoxy)benzoic acid (Hmee) (3)

515 mg (1.65 mmol) of 2 was added to a 4.2 mL solution of THF[thin space (1/6-em)]:[thin space (1/6-em)]methanol (1[thin space (1/6-em)]:[thin space (1/6-em)]1, in volume) containing 200 mg (5 mmol) of NaOH and 2.1 mL of water. The system was kept under stirring at RT for 20 h. The aqueous phase was washed with ethyl acetate, and acidified (until pH ∼2) with HCl 1 mol L−1 aqueous solution and the product extracted with ethyl acetate (3 × 30 mL). The organic phase was dried under Na2SO4 filtered and the solvent removed under reduced pressure to yield a white solid. Yield: 374 mg (80%). 1H-NMR (400 MHz, CDCl3): δ 8.06 (d, Ar, J = 8.9 Hz, 2H), 6.97 (d, Ar, J = 8.8 Hz, 2H), 4.22 (dd, CH2, J = 4.0 and 5.6 Hz, 2H), 3.91 (dd, CH2, J = 3.9 and 5.6 Hz, 2H), 3.77 (dd, CH2, J = 3.5 and 6.0 Hz, 2H), 3.66–3.74 (m, CH2, 4H), 3.58 (dd, CH2, J = 3.6 and 5.7 Hz, 2H), 3.40 (s, CH3, 3H) ppm. 13C-NMR (100 MHz, CDCl3): δ 171.4, 163.2, 132.3, 121.9, 114.3, 71.92, 70.9, 70.7, 70.6, 69.5, 67.6, 59.0 ppm (Fig. S3). ESI-MS: [M + H]+ m/z found (calc.): 285 (285) (Fig. S4).

Lanthanides complexes – [Ln(mee)(H2O)x] (Ln = EuIII, GdIII and TbIII)

The ligand was dissolved in ethanol and a NaOH solution was added in the stoichiometric proportion 1[thin space (1/6-em)]:[thin space (1/6-em)]1 (L[thin space (1/6-em)]:[thin space (1/6-em)]OH). LnCl3 was dissolved in a small amount of deionized water and added to the ethanolic solution containing the deprotonated ligand in 1[thin space (1/6-em)]:[thin space (1/6-em)]3 (Ln[thin space (1/6-em)]:[thin space (1/6-em)]L) stoichiometric ratio. The solution was kept under stirring at 25 °C for 5 h. The solvent was removed under reduced pressure, and the precipitate was dissolved in water and filtered off to remove any unreacted ligand. The solvent was again removed under reduced pressure and the solid re-dissolved in chloroform and filtered off to remove any residual salts. The solvent was removed under reduced pressure to yield the product as a pale yellow solid. ESI-MS: [EuL3 + H]+ m/z found (calc.) 1003.22 (1003.28) (ESI-Fig. S5). [GdL3 + H]+ m/z found (calc.) 1008.25 (1008.29) (ESI-Fig. S6). [TbL3 + H]+ m/z found (calc.) 1009.23 (1009.29) (ESI-Fig. S7).

Characterization

Unless otherwise indicated, all data were collected at a constant temperature of 298 ± 1 K. The 1H and 13C-NMR spectra were obtained in deuterated solvents in a Bruker Avance 400 or 500 MHz. Low resolution electrospray mass spectrum (ESI-MS) of the ligand was obtained in the positive ion mode in a Waters Micromass ZQ quadrupole mass spectrometer. High resolution electrospray mass spectra (ESI-MS) of the lanthanide(III) complexes were obtained in the positive ion mode with methanol as solvent in a Waters Xevo QTOF mass spectrometer. The thermogravimetric analyses (TA instruments SDTQ600) were carried out using a synthetic air flow (100 mL min−1) under a heating rate of 10 °C min−1. Infrared spectroscopy (Cary 630 FTIR) data were obtained in attenuated total reflectance mode. The photoluminescence data were obtained with the samples in the solid state and in aqueous and acetonitrile solutions (1 × 10⁻⁴ mol L−1) in a Fluorolog-3 spectrofluorometer (Horiba FL3-22-iHR320), with double-gratings (1200 g mm−1, 330 nm blazed) in the excitation monochromator and double-gratings (1200 g mm−1, 500 nm blazed) in the emission monochromator. An ozone-free xenon lamp of 450 W (Ushio) was used as radiation source. The excitation spectra were obtained between 250 and 550 nm and they were corrected in real time according to the lamp intensity and the optical system of the excitation monochromator using a silicon diode as reference detector. The emission spectra were obtained between 400 and 720 nm using the front face mode at 22.5° (for solid samples) or right angle (for solutions). The time-resolved emission spectra of europium(III) complexes were obtained with a pulsed 150 W xenon lamp using a TCSPC system with successive delay increments. All emission spectra were corrected according to the optical system of the emission monochromator and the photomultiplier response (Hamamatsu R928P). The time-resolved phosphorescence emission spectra of the analogous gadolinium(III) complexes were obtained at ∼77 K using a TCSPC system with successive delay increments, in order to get only the emissions from the triplet level of the ligand. The energy values of the ligand triplet level were obtained using two approaches: (i) fitting a tangent to the highest energy edge of the emission spectra or (ii) the maximum of the highest energy vibrational-coupled band (0-0 phonon) obtained from the deconvolution of the emission spectra.12 The emission decay curves were obtained with a pulsed 150 W xenon lamp using a TCSPC system. The Judd–Ofelt (JO) intensity parameters (Ω2 and Ω4) and the efficiency parameters (Arad, Atot and η) were calculated using the equations described in the literature.13 The number of coordinated water molecules (q) was determined using the eqn (1), proposed by Horrocks and co-workers, considering that the O–H oscillator is the only quenching route of the emitting level.14
 
image file: c6ra21487h-t1.tif(1)
where A = 1.1, α = 0.31 and τD2O = τrad for Eu(III).15

The relative quantum yields Φx of the samples were determined at 25.0 ± 0.1 °C using the eqn (2).

 
image file: c6ra21487h-t2.tif(2)

Ast and Ax are the absorbance at the excitation wavelength of the standard st and sample x, respectively; Ist and Ix are the intensities of the excitation source at the excitation wavelength, Est and Ex are the integrated emission spectra and Φst is the quantum yield of the standard. Standards for quantum yield measurements were Cs3[Eu(dipic)3] (Φ ∼ 24%) and Cs3[Tb(dipic)3] (Φ ∼ 22%) in 0.1 mol L−1 aqueous TRIS/HCl buffer solution (pH ∼ 7.4).16,17 The excitation wavelengths were chosen to ensure a linear relationship between the intensity of emitted light and the concentration of the absorbing/emitting species (A ≤ 0.05).

Ground state geometries and theoretical calculations

The Sparkle/PM3 model was used to determine the complexes ground state geometries.18 In this model the lanthanide ion is replaced by a +3e point charge.19 The RHF wave functions were optimized using the Broyden–Fletcher–Goldfarb–Shanno (BFGS) procedure with a convergence criterion of 0.15 kcal mol−1 Å−1 and the semi empirical PM3 with a convergence criterion of 10−6 kcal mol−1 for the SCF. In Mopac2016 package20 the following keywords were used: PM3, SPARKLE, XYZ, SCFCRT=1D-10, GEO-OK, BFGS, CHARGE=X, PRECISE, GNORM=0.25 ALLVEC AUX and T=2D. The theoretical JO intensity parameters were calculated using the adequate equations and adjusting, in the physical acceptable range,13 the polarizability (α) and the charge factors (g) of the ligands in order to fit the theoretical JO intensity parameters with the experimental ones. The experimental JO intensity parameters obtained without delay correspond to the average value between the two europium(III) sites (Eu1 and Eu2) of dinuclear complex. The determination of JO experimental parameters, Arad (radiative emission rate) and Anrad (non-radiative decay rate) of the Eu2 was done using the time-resolved emission spectra and the experimental parameters of the Eu2 center were estimated using the eqn (3).
 
image file: c6ra21487h-t3.tif(3)
where Eu2 refers to the Arad or Anrad or JO intensity parameters of the europium with two coordinated water molecules; T refers to the Arad or Anrad or JO intensity parameters determined from europium(III) steady-state emission spectra and Eu1 refers to the Arad or Anrad or JO intensity parameters determined from time-resolved europium(III) emission spectra, that eliminates emission from Eu2 center, that has shorter emission lifetime than Eu1 center. The 0.66 and 0.34 values are the contribution ratios of the first and second coefficient terms of the bi-exponential function used for fitting the lifetime emission decay curve (ESI-Fig. S8).

The excited states calculations were performed using ORCA software21 using the INDO/S-CIS22 with the lanthanide replaced by a +3e point charge.13,19 The transfer and back transfer energy rates from the ligand's triplet level to the 5D0,1 europium(III) levels as well the theoretical quantum efficiency and quantum yield were calculated using the adequate kinetics equations described by Malta and collaborators23–25 implemented in the LUMPAC software26 (version 1.2.0).

Results and discussion

New lanthanide complexes (EuIII, GdIII and TbIII) with a benzoic acid derivative ligand, functionalized with the polyglycol chain –OEtOEtOEtOMe at the para position were synthetized, isolated and characterized. The stoichiometries of the complexes, as monomer motifs once they were solubilized in methanol containing 0.1% of formic acid, were confirmed by high resolution ESI-MS (ESI – Fig. S5–S7 and Table S1) and the amounts of coordinated water molecules were determined by TGA (ESI-Fig. S9) and by emission lifetime using Horrocks eqn (1). The coordination mode of the carboxylate moiety was confirmed by the shift to lower wavenumbers of the νa(COO), Fig. 1. The coordination of the carboxylate ion to the lanthanide(III) can be bidentate bridging, and/or bidentate chelate, and/or monodentate. The value of Δνν = νa(COO) − νs(COO)] provides some indication about the possible coordination modes of this group.27,28 According to the values determined for this series of complexes, Table 1, the ligands may be coordinated to the metal ion through the bidentate bridging mode (Δνligand salt–Δνcomplex) or chelate bidentated mode (Δνligand salt > Δνcomplex). Specifically, for the europium(III) complex, one may note, that both asymmetric and symmetric vibrations mode of carboxylate group are slightly split indicating a possible mixture between the bridging and chelate mode simultaneously, as previously observed.29
image file: c6ra21487h-f1.tif
Fig. 1 FT-IR spectra of the ligand salt and lanthanide(III) complexes. (a) Na+mee (b) europium(III) complex (c) gadolinium(III) complex and (d) terbium(III) complex.
Table 1 Values of νa(COO), νs(COO) and Δν(COO) of the ligand sodium salt and the complexes
  νa(COO)/cm−1 νs(COO)/cm−1 Δν(COO)/cm−1 Coordination modes
Na+ 1547 1417 130
EuIII 1539/1506 1393 146/113 Mixed bidentate chelate and bridging
GdIII 1542/1508 1405 137/103
TbIII 1545/1508 1405 140/103


In the past years, different coordination modes of the carboxylate ligand toward trivalent lanthanide ions have been identified and consequently a large number of complex geometries have been reported.30 Recently, Malvestiti and collaborators31 have published an interesting extended structure with asymmetrical dinuclear units based on 2-(methylthio)benzoic acid derivate. The asymmetric units of the terbium(III) complex obtained from crystallographic data, indicate that the carboxylate group is coordinated basically by bidentate chelate and bridging modes, being one terbium(III) ion coordinated by eight oxygens from carboxylate groups and the other terbium(III) ion is coordinated by four oxygens from carboxylate group plus four oxygens from coordinated water molecules.31 The benzoic acid-derivate ligand published by Malvestiti and collaborators31 is structurally similar to the one synthetized in this work. Based on the FT-IR data in addition to the photoluminescence decay curve of the europium(III) complex that was fitted by a bi-exponential decay function indicating at least two emitting centers and two coordinate water molecules in one of the europium centers, it is possible to infer that the structure of the europium(III) complex has two asymmetric units (Fig. 2). In the first one the europium(III) ion (Eu1) probably is bonded to eight oxygens from carboxylate groups, where three carboxylate groups (oxygen atoms numbers 9 to 14) are coordinated in a bidentate chelate mode and the other two (6 and 8) are coordinated as a bidentate bridging and chelate mode simultaneously. The other europium center (Eu2) probably is bounded to two oxygen from carboxylate groups (oxygen atoms 3 and 4 – Fig. 2) coordinated as bidentate chelate mode, four oxygen (oxygen atoms numbers 5 to 8) from the bidentate bridging and chelate mode from Eu1 and two oxygens (oxygen atoms numbers 1 and 2) from coordinated water molecules. The FT-IR spectra of terbium(III) and gadolinium(III) complexes are comparable to the ones published by Malvestiti and collaborators31 probably indicating similar structures and coordination modes.


image file: c6ra21487h-f2.tif
Fig. 2 Ground state geometry of the [Eu2(mee)6(H2O)2] complex obtained using the Sparkle/PM3 model. The theoretical bond distances are in Angstroms.

The ground state geometry of the europium(III) complex (Fig. 2) was calculated using the Sparkle/PM3 model implemented in the MOPAC2016 software and it will be discussed later.

The triplet energy level (T) of the ligand was determined using the two approaches described in the Experimental section. The time resolved phosphorescence emission spectra of analogous gadolinium(III) complex (ESI-Fig. S10a) and the deconvolution of the phosphorescence bands (ESI-Fig. S10b) are shown in the ESI. The energy values of the triplet energy level obtained by the two approaches were 25[thin space (1/6-em)]610 cm−1 (edge) and 26[thin space (1/6-em)]130 cm−1 (0-0 phonon). These values are comparable to the ones (24[thin space (1/6-em)]641 cm−1 and 23[thin space (1/6-em)]202 cm−1) obtained for benzoic acid ligand.32 The excitation and emission spectra of the europium(III) and terbium(III) complexes in the solid state and dissolved in acetonitrile and water are shown in Fig. 3A and B.


image file: c6ra21487h-f3.tif
Fig. 3 Excitation and emission spectra of the (A) europium(III) and (B) terbium(III) complexes. The spectra were obtained at 298 K in (a) the solid state, (b) acetonitrile and (c) water. The measurements were done after 48 h of the solution preparation.

The excitation and emission spectra of the europium(III) complex (Fig. 3A) in different solvents as well in the solid state provide information about the microsymmetry around the europium(III) ion33 and the degree of covalence of the Eu–L bonds.34–36 In all cases, Fig. 3A, the expected transitions 5D07FJ, (J = 0; 1; 2; 3 and 4) are observed. The ratio of the band intensity attributed to the forced electric dipole transition (5D07F2) and the band intensity attributed to the magnetic dipole one (5D07F1) correlates with the microenvironment around the europium(III). If the microenvironment around the europium(III) lacks an inversion center, the band attributed to 5D07F2 transition has higher intensity than the 5D07F1 one. Fig. 3A shows that the europium(III) lies in a microenvironment without inversion center when in the solid state and dissolved in acetonitrile. However, a decrease in the intensity of the 5D07F2 is observed when the europium(III) complex is dissolved in water (Fig. 3A-c) meaning that, in this solvent, the microenvironment around the europium(III) ion is more symmetric leading to an increase of the symmetry also illustrated by the intensity of the 5D07F4 transition band.

The emission decay curve of the solid state europium(III) complex was fitted using a bi-exponential decay function (ESI-Fig. S8) indicating the existence of at least two emitting centers (Table 2). Using the Horrocks equation (eqn (1)) it was possible to infer that the Eu2 center has two coordinated water molecules and the Eu1 has none. The emission lifetime values may be related to emission deactivation of europium(III) ions. In the solid sample, the Eu1 center has emission lifetime value almost three times higher than Eu2 center. When the sample is solubilized in acetonitrile the emission lifetime values are higher than the ones in the solid sample, suggesting that, in solid state, the poly glycol chain may entrap water molecules close to the europium(III) ion and/or create other routes for emission quenching. The emission lifetime values are comparable to the ones available in the literature for europium(III) complexes obtained from benzoic acid derivate ligands with no coordinated water molecules31,37 and with two coordinated water molecules per europium(III) center.32,38–40

Table 2 Values of the emission lifetime (τ) and relative quantum yield (ΦLnL) of the europium(III) and terbium(III) complexes in the solid state or dissolved in acetonitrile or water
Ln τ/ms ΦLnL/%
Solid Acetonitrile Water Solid Acetonitrile Water
a The absolute ΦLnL of the complexes in the solid state were not measured due to limitations of the experimental setup that allows excitations beyond 350 nm.
Eu 1.15 ± 0.01 (Eu1) 1.60 ± 0.01 (Eu1) 0.130 ± 0.001 a 2.1 <1
0.41 ± 0.01 (Eu2) 0.77 ± 0.02 (Eu2)
Tb 0.986 ± 0.002 1.451 ± 0.002 0.413 ± 0.001 a 11.4 1.4


The excitation and emission spectra of the terbium(III) complex in the solid state or in different solvents (Fig. 3B) show the characteristics bands of this ion attributed to the 5D47FJ transitions. There are no significant differences of the terbium(III) emission spectra on solid state, in water or acetonitrile solutions. One may see just slight changes on the emission band attributed to 5D47F6 in water solution (Fig. 3B-c) and a different sensitization of the terbium(III) when the excitation spectra are obtained in solutions (Fig. 3B-bc). In all cases, the emission decay curves of terbium(III) complex were fitted using single exponential decay functions (ESI-Fig. S12), corroborating with the geometries proposed by Malvestiti and collaborators.31

The Judd–Ofelt (JO) intensity parameters Ω2 and Ω4 are strongly correlated to the symmetry of the microenvironment around the europium(III) ion. A high value for the Ω2 intensity parameter means low local symmetry. The decrease of the Ω2 intensity parameter (Table 3) when the complex is dissolved in water, compared with acetonitrile solutions or the solid state, indicates that the europium complex is not stable in water and possibly undergoes to ligand exchange process. As discussed before, the europium(III) complex has two different chemical environments (centers) and it is possible to determine the theoretical JO intensity parameters for each one. In order to do so, the emission spectra of europium(III) complex were obtained with successive delay increments (ESI-Fig. S13) and the minimum necessary delay time to eliminate the emission of the less symmetric Eu2 ion was calculated from the lifetime emission decay functions. Therefore, the experimental JO intensity parameters of the Eu1 center were determined using the emission spectra with a delay of 6.5 ms. To evaluate the experimental JO intensity parameters, the optimized ground state geometry of dinuclear complex (Fig. 2) was taken and in sequence the JO intensity parameters were calculated considering only the coordinated atoms to Eu1 center. There is good agreement between the experimental and calculated JO intensity parameters (Table 3) indicating that the proposed overall ground state geometry is acceptable. In order to evaluate the JO intensity parameters of the Eu2 center, the overall JO intensity parameters (Euexptotal) were determined using the europium(III) steady-state emission spectrum, then eqn (3) was used to infer the JO values of the Eu2 center and the experimental values of Ω2 and Ω4 of both Eu1 and Eu2 were used as a reference for the evaluation of the theoretical ground state geometry (Fig. 2). The Ω2 parameter of the Eu2 is larger than Eu1 (Table 3), indicating that the former is situated in a lower symmetric chemical environment than Eu1 center. One may note that the experimental (Euexp2) and theoretical (Eutheo2) values of Ω4 and Anrad are significantly different. That discrepancy probably indicates an important role of the poly glycol chain of the ligands over the photophysical parameters of the Eu2 center that could not properly be predict because of geometry distortion and/or water molecules entrapped in this chain. These entrapped water molecules may be close enough to Eu2 center promoting non-radiative routes.

Table 3 Experimental and theoretical JO intensity parameters (Ω2 and Ω4), radiative emission rate (Arad), of the europium(III) complexes in the solid state or dissolved in acetonitrile or water
  Solid state Acetonitrile solution
Euexptotal Euexp1a Eutheo1 Euexp2b Eutheo2 Euexptotal Eutheo1c Eutheo2c
a The Euexp1 was determined from time-resolved emission spectra using a delay time of 6.5 ms.b The values were calculated using eqn (3).c The Eutheo1 and Eutheo2 values were adjusted to Euexptotal, that was obtained from steady-state emission spectrum.
Ω2 × 10⁻²⁰ cm2 15.69 12.55 12.55 21.67 23.26 16.12 17.06 16.12
Ω4 × 10⁻²⁰ cm2 5.94 2.61 2.61 12.28 5.76 8.07 4.41 8.07
Ω6 × 10⁻²⁰ cm2 0.1622 0.443 0.1630 0.3385
Arad 612.9 466.1 465.5 892.4 834.9 479.5 447.7 467.2
Anrad 1826.1 411.1 411.7 4519.7 1604.1 145.5 177.4 831.5


The complex in acetonitrile solution also has two emission lifetime values, 1.60 ± 0.02 ms (Eu1) and 0.77 ± 0.02 ms (Eu2). The Horrocks equation (eqn (1)) indicates that there are no coordinated water molecules to Eu2 center and, therefore, probably two acetonitrile molecules are coordinated to Eu2, as also showed by Kumar and collaborators.41 As it was done in solid state, the minimum delay time necessary to eliminate the Eu2 center emission was calculated by adjusting the equations from the emission lifetime decay curves (ESI-Fig. S8). However, the delay time necessary would be 15.5 ms and using this delay it was not possible to obtain a resolved emission spectrum to proceed with the JO intensity parameters determination for each europium(III) center. Therefore, the steady-state emission spectrum was used to determine the JO parameters and the both europium centers were adjusted to these values showing a good agreement between experimental and theoretical JO intensity parameters in acetonitrile solution.

This result corroborates with that obtained in solid state sample, suggesting again that the proposed overall ground state geometry is reasonable.

When the [Eu2(mee)6(H2O)2] complex is solubilized in water the emission band attributed to 5D07F2 transition has almost the same intensity as the 5D07F1 one and the band attributed to 5D07F4 transition is intensified indicating a modification of the microsymmetry around europium(III) ion. There is also a decrease of the emission lifetime when the europium(III) complex is dissolved in water, compared to solid state or acetonitrile, Table 2. The modification of the microsymmetry and the emission lifetime decrease might be an indication of ligands exchange by water molecules. In order to verify this indication, the emission spectra were obtained in different ratios of water[thin space (1/6-em)]:[thin space (1/6-em)]acetonitrile solution (Fig. 4).


image file: c6ra21487h-f4.tif
Fig. 4 Emission spectra of the europium(III) complex in different water[thin space (1/6-em)]:[thin space (1/6-em)]acetonitrile volume ratios indicated in the figure. The measurements were done after 48 h of the solution preparation.

Another indication of the replacement of the ligand by water molecules is the appearance of the broad emission band between 450 and 575 nm that may attributed to the ligand. If the ligand is non-coordinated or even mono-coordinated to the europium(III), the energy transfer to the europium(III) is reduced and the broad band due to ligand phosphorescence appears. This data agrees with emission lifetime decay curves and also with data obtained by ESI-MS (ESI-Fig. S5–S7) that indicates a 1Ln[thin space (1/6-em)]:[thin space (1/6-em)]3mee molar ratio. Therefore, the complex dissolution in water probably breaks up the dinuclear unit and subsequently promotes the exchange of part of the ligands by water molecules. A close examination of the theoretical coordination polyhedral (Fig. 2) shows that the oxygens from carboxylate group bonded as chelate/bridging modes (Fig. 2: oxygens 6 and 8) have long bond distances (2.512 and 2.519 Å) that are similar to the bond distance (2.512 Å) between the water oxygen (Fig. 2: oxygen 1) and europium(III) ion. The long distances between these bridging oxygens and the central ion together with the hydrophilic nature of the poly glycol chains may explain the instability of the complex into water solution, being the ligand solvated by water.

The increase of the number of coordinated water molecules (q) as a function of the percentage of water into acetonitrile solution was calculated using eqn (1). The correlation between the emission lifetime (τ) and the coordinated water molecules (q) is shown in Fig. 5.


image file: c6ra21487h-f5.tif
Fig. 5 Correlation between the emission lifetime (τ) and the number of coordinated water molecules (q) of the [Eu(mee)3(H2O)n] complexes as a function of the amount of the percentage of water into acetonitrile solution.

The data (Fig. 5) indicates an increase in the number of coordinated water molecules in the europium(III) complex, explaining the low emission lifetime value in water (Table 2), as the O–H oscillators close to the lanthanide(III) are efficient emission quenchers. The high number of coordinated water molecules obtained for 100% water solution indicate that majority of the ligand molecules were replaced by water. Kumar and co-workers also observed a decrease in the emission lifetimes values for the [Eu(ba)3] complex (ba = benzoic acid) by increasing water concentration in acetonitrile.41

The energy transfer rates (Table 4) from ligand to europium(III) ion, were calculated for the europium(III) complex using the software LUMPAC (version 1.2.0).26 The energy transfer rates from the ligand to the lanthanide excited levels are higher than the back-transfer ones. However, the combination of the high value of the RL parameter (from 5.5393 Å to 7.0475 Å) with the high energy of the triplet level (25[thin space (1/6-em)]606 cm−1) leads to low energy transfer rates ligand → EuIII and, consequently a low relative quantum yields (Table 2). The transfer and back transfer rates calculated for Eu2 in the solid state or in acetonitrile solution are smaller than that one calculated to Eu1 center. This can be justified by the higher values of RL parameter related to Eu2 than Eu1 center.

Table 4 Transfer and back energy transfer rates between the ligand triplet level and 5D1 and 5D0 europium(III) levels, calculated from the ground state geometries provided by Sparkle/PM3a
  [Eu(abz)3(H2O)2]·3/2H2O32 a Solid state Acetonitrile solution
Eu1 Eu2 Eu1 Eu2
a Ref. 32 used the first LUMPAC version.
T → 5D1/s−1 4.8 × 10⁸ 4.5 × 101 1.8 × 101 6.8 × 10² 7.8
5D1 → T/s−1 1.2 × 10⁻⁵ 3.3 × 10⁻⁵ 1.1 × 10⁻⁶ 3.3 × 10⁻⁵ 4.3 × 10⁻⁷
T → 5D0/s−1 8.3 × 10⁷ 3.8 × 10² 1.3 × 101 4.3 × 10² 5.6
5D0 → T/s−1 4.6 × 10⁻¹⁰ 5.7 × 10⁻⁹ 2.0 × 10⁻¹⁰ 5.8 × 10⁻⁹ 7.5 × 10⁻¹¹
RL 5.5235 5.5782 6.7098 5.5393 7.0475


Conclusions

In summary, a new series of water-soluble luminescent binuclear lanthanide complexes (EuIII, GdIII and TbIII) were prepared. The ligand coordinates to the lanthanide(III) through the mixed bridging and bidentate chelate mode, as determined by FT-IR and indicated by comparing the experimental and theoretical photophysical parameters determined from ground state geometry, that was calculated using the Sparkle/PM3 model. Both europium(III) and terbium(III) complexes are luminescent in water solution. The decrease of the band intensity attributed to 5D07F2 transition in aqueous solution when compared with the solid, indicates that there is an increase in the microsymmetry around the europium(III) when it is dissolved in water. The decrease of the emission lifetime in aqueous solution and the changes of emission profile in several ratio of acetonitrile[thin space (1/6-em)]:[thin space (1/6-em)]water solutions indicates the replacement of the coordinated ligands by water molecules. The increase of coordinated water molecules (q) was confirmed using the well-established Horrocks equation. The relative quantum yield of sensitized emission is higher in acetonitrile than in water, due to the quenching effect of the O–H oscillators. The transfer and back energy transfer rates were calculated using the LUMPAC software and the values obtained for energy transfer rates are lower than previous values obtained for europium(III) complexes with benzoic acid derivative ligands, indicating the role of the poly glycol chain attached to benzoic acid on photophysical properties of the [Eu2(mee)6(H2O)2] complex.

Acknowledgements

GZB is indebted to CAPES for the Ph.D. fellowship. GAB and JHSKM thank to FAPESP (grant: 2015/22426-5) and CNPq (grant: 159249/2014-7) for the Postdoctoral fellowships, respectively. IOM and FAS are indebted to CNPq, CAPES and FAPESP (grant: 2013/22127-2) for financial support. AdBD and FAS thank to MEC/MCTI/CNPq/CAPES PEV program (grant: 400214/2014-8). AdBD also acknowledges financial support through NSF (CHE-1363325). All authors would like to thank the Multiuser Laboratory of Advanced Optical Spectroscopy - Institute of Chemistry-UNICAMP.

References

  1. J. C. G. Bünzli, Chem. Rev., 2010, 110, 2729–2755 CrossRef PubMed.
  2. M. Shibasaki and N. Yoshikawa, Chem. Rev., 2002, 102, 2187–2209 CrossRef CAS PubMed.
  3. S. Zhou, Y. Fu, X. Fan, Y. Zhang and C. Li, Med. Chem. Res., 2013, 22, 2862–2869 CrossRef CAS.
  4. A.-L. Gassner, C. Duhot, J. C. G. Bünzli and A. S. Chauvin, Inorg. Chem., 2008, 47, 7802–7812 CrossRef CAS PubMed.
  5. A. S. Chauvin, S. Comby, B. Song, C. D. Vandevyver and J. C. Bünzli, Chem.–Eur. J., 2008, 14, 1726–1739 CrossRef CAS PubMed.
  6. A. D'Aleo, A. Picot, P. L. Baldeck, C. Andraud and O. Maury, Inorg. Chem., 2008, 47, 10269–10279 CrossRef PubMed.
  7. A. D'Aleo, A. Picot, A. Beeby, J. A. G. Williams, B. Le Guennic, C. Andraud and O. Maury, Inorg. Chem., 2008, 47, 10258–10268 CrossRef PubMed.
  8. A. de Bettencourt-Dias, P. S. Barber and S. Bauer, J. Am. Chem. Soc., 2012, 134, 6987–6994 CrossRef CAS PubMed.
  9. P. C. Andrews, B. H. Fraser, W. J. Gee, D. Giera, P. C. Junk, M. Massi and K. L. Tuck, Polyhedron, 2010, 29, 1764–1770 CrossRef CAS.
  10. S. Kohmoto, E. Mori and K. Kishikawa, J. Am. Chem. Soc., 2007, 129, 13364–13365 CrossRef CAS PubMed.
  11. R. S. Tipson, J. Org. Chem., 1944, 09, 235–241 CrossRef CAS.
  12. G. A. Crosby, R. E. Whan and R. M. Alire, J. Chem. Phys., 1961, 34, 743 CrossRef CAS.
  13. G. F. de Sá, O. L. Malta, C. de Mello Donegá, A. M. Simas, R. L. Longo, P. A. Santa-Cruz and E. F. da Silva, Coord. Chem. Rev., 2000, 196, 165–195 CrossRef.
  14. R. M. Supkowski and W. D. Horrocks, Inorg. Chim. Acta, 2002, 340, 44–48 CrossRef CAS.
  15. L. D. Carlos, R. A. Ferreira, Z. Bermudez Vde and S. J. Ribeiro, Adv. Mater., 2009, 21, 509–534 CrossRef CAS PubMed.
  16. A. S. Chauvin, F. Gumy, D. Imbert and J. C. G. Bunzli, Spectrosc. Lett., 2004, 37, 517–532 CrossRef CAS.
  17. A. S. Chauvin, F. Gumy, D. Imbert and J. C. G. Bünzli, Spectrosc. Lett., 40, 2007, 193, Erratum Search PubMed.
  18. M. A. M. Filho, J. D. L. Dutra, G. B. Rocha, R. O. Freire and A. M. Simas, RSC Adv., 2003, 3, 16747–16755 RSC.
  19. A. V. M. de Andrade, N. B. da Costa, A. M. Simas and G. F. de Sá, Chem. Phys. Lett., 1994, 227, 349–353 CrossRef CAS.
  20. J. J. P. Stewart, Stewart Computational Chemistry, Colorado Springs, 2016 Search PubMed.
  21. F. Neese, Wiley Interdiscip. Rev.: Comput. Mol. Sci., 2012, 2, 73–78 CrossRef CAS.
  22. J. E. Ridley and M. C. Zerner, Theor. Chim. Acta, 1976, 42, 223–236 CrossRef CAS.
  23. O. L. Malta, J. Lumin., 1997, 71, 229–236 CrossRef CAS.
  24. F. R. G. Silva and O. L. Malta, J. Alloys Compd., 1997, 250, 427–430 CrossRef.
  25. O. L. Malta, J. Non-Cryst. Solids, 2008, 354, 4770–4776 CrossRef CAS.
  26. J. D. L. Dutra, T. D. Bispo and R. O. Freire, J. Comput. Chem., 2004, 35, 772–775 CrossRef PubMed.
  27. G. B. Deacon and R. J. Phillips, Coord. Chem. Rev., 1980, 33, 227–250 CrossRef CAS.
  28. K. Nakamoto, Infrared and Raman spectra of inorganic and coordination compounds - part B: applications in coordination, organometallic, and bioinorganic chemistry, John Wiley, New York, 5th edn, 1997 Search PubMed.
  29. E. R. Souza, I. O. Mazali and F. A. Sigoli, J. Fluoresc., 2014, 24, 203–211 CrossRef CAS PubMed.
  30. J. P. Costes, J. M. Clemente-Juan, F. Dahan, F. Nicodme and M. Verelst, Angew. Chem., Int. Ed., 2002, 41, 323–325 CrossRef CAS.
  31. C. K. Oliveira, V. P. Souza, L. L. Luz, J. R. M. Vicenti, R. A. Burrow, S. Alves Jr, R. L. Longo and I. Malvestiti, J. Lumin., 2016, 170, 528–537 CrossRef CAS.
  32. J. H. S. K. Monteiro, A. L. B. Formiga and F. A. Sigoli, J. Lumin., 2014, 154, 22–31 CrossRef CAS.
  33. P. A. Tanner, Lanthanide Luminescence in Solids, in Lanthanide Luminescence: Photophysical, Analytical and Biological Aspects, ed. P. Hänninen and H. Härmä, Springer, Berlin, 2011, pp. 183–233 Search PubMed.
  34. S. T. Frey and W. D. Horrocks, Inorg. Chim. Acta, 1995, 229, 383–390 CrossRef CAS.
  35. L. D. Carlos, O. L. Malta and R. Q. Albuquerque, Chem. Phys. Lett., 2005, 415, 238–242 CrossRef CAS.
  36. O. L. Malta, H. J. Batista and L. D. Carlos, Chem. Phys., 2002, 282, 21–30 CrossRef CAS.
  37. M. V. Lucky, S. Sivakumar, M. L. P. Reddy, A. K. Paul and S. Natarajan, Cryst. Growth Des., 2011, 11, 857 CAS.
  38. S. Sivakumar, M. L. P. Reddy, A. H. Cowley and K. V. Vasudevan, Dalton Trans., 2010, 39, 776 RSC.
  39. A. R. Ramya, M. L. P. Reddy, A. H. Cowley and K. V. Vasudevan, Inorg. Chem., 2010, 49, 2407 CrossRef CAS PubMed.
  40. S. Sivakumar, M. L. P. Reddy, A. H. Cowley and R. R. Butorac, Inorg. Chem., 2011, 50, 4882 CrossRef CAS PubMed.
  41. S. Kumar, S. Maji, M. Joseph and K. Sankaran, J. Lumin., 2015, 161, 123–128 CrossRef CAS.

Footnote

Electronic supplementary information (ESI) available. See DOI: 10.1039/c6ra21487h

This journal is © The Royal Society of Chemistry 2016
Click here to see how this site uses Cookies. View our privacy policy here.