Structures of 4-substituted thioanisole radical cations studied by time-resolved resonance Raman spectroscopy during pulse radiolysis and theoretical calculations

Sachiko Tojo, Mamoru Fujitsuka* and Tetsuro Majima*
The Institute of Scientific and Industrial Research (SANKEN), Osaka University, Mihogaoka 8-1, Ibaraki, Osaka 567-0047, Japan. E-mail: fuji@sanken.osaka-u.ac.jp; majima@sanken.osaka-u.ac.jp; Fax: +81-6-6879-8499

Received 26th August 2016 , Accepted 8th November 2016

First published on 8th November 2016


Abstract

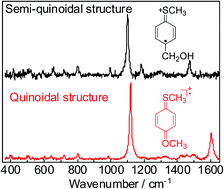
To understand dimerization-reactivity, structures of 4-substituted thioanisole radical cations (ArSCH3˙+) in aqueous solution were studied by the nanosecond time-resolved resonance Raman (ns-TR3) spectroscopy during pulse radiolysis and density functional theory (DFT) calculations. The downshift of the C[double bond, length as m-dash]C stretching mode of the benzene ring and the upshift of the C–S stretching mode upon oxidation were observed with aromatic sulfides such as 4-hydroxymethylthioanisole (MTPM), suggesting formation of a semi-quinoidal structure. For the 4-methoxythioanisole radical cation (MTA˙+), weak CPh–O stretching was observed additionally. Based on the DFT calculations, semi-quinoidal structures including an S atom and benzene ring were indicated for MTPM˙+ and so on, in which the positive charge and spin are localized on the S-atom and C4-position, respectively. On the other hand, the quinoidal structure including the S and O atoms and benzene ring was indicated for MTA˙+. The results of DFT calculation agreed well with TR3 spectra of ArSCH3˙+. The reactivities of ArSCH3˙+ toward dimerization were discussed in terms of the conjugation between S non-bonding electrons and π-electrons of the aromatic system.


Introduction

Sulfur compounds play a central role in many vital systems. In the living cell, they minimize oxidative damage of biological tissues and are transformed into a variety of sulfur intermediates. To date, the oxidation reactions of various sulfur compounds have been studied by nanosecond transient absorption (ns-TA) measurement during the pulse radiolysis technique and so on.1–6 One of the unique radical cations derived from the oxidation reactions of aliphatic sulfides is a σ-dimer radical cation, σ-(RSR′)2˙+ (R, R′ = alkyl), generated from the reaction of RSR′˙+ with RSR′. The σ-(RSR′)2˙+ has a three-electron S–S bond and shows a relatively strong absorption peak around 400–600 nm due to the σ → σ* transition.7 In contrast to σ-(RSR′)2˙+, the formation of σ-dimer radical cation of aryl sulfide, σ-(ArSR)2˙+, depends on the electronic properties of the substituents of aryl sulfide radical cation (ArSR˙+).8 Although these products can be detected by ns-TA, understanding on reactivities of sulfide radical cations toward dimerization has not been well established because of the absence of their structural information. On the other hand, the time-resolved vibrational spectroscopic techniques such as nanosecond time-resolved resonance Raman (ns-TR3) spectroscopy provide us structural information of short-lived intermediates including radical cations.9–16 As pointed out, there is only limited number of investigation on Raman spectra of RSR′˙+ and nothing for ArSR˙+ until now.17,18 Thus, systematic study on TR3 spectra of ArSR˙+ will be useful for understanding of their reactivities and so on.

In the present study, we studied vibrational spectra of 4-substituted thioanisole (ArSCH3, Fig. 1) radical cations (ArSCH3˙+) using ns-TR3 spectra measurements during the pulse radiolysis as well as the ns-TA. Furthermore, the charge and spin distributions in ArSCH3˙+ were estimated by the density functional theory (DFT) calculation. Based on these, relation between structures of ArSCH3˙+ and charge distributions in ArSCH3˙+ is discussed.


image file: c6ra21460f-f1.tif
Fig. 1 4-Substituted thioanisoles used in this study.

Experimental

Materials

4-Hydroxymethylthioanisole (98%) (MTPM, Sigma Aldrich), 4-(methylthio)phenylacetic acid (99%) (MTPA, Sigma Aldrich) and 4-methoxythioanisole (97%) (MTA, Tokyo Chemical Industry Co., Ltd.) were recrystallized from n-hexane before use. 4-Methylthioanisole (99%) (MTT, Tokyo Chemical Industry Co., Ltd.) and thioanisole (>99%) (MTB, Tokyo Chemical Industry Co., Ltd.) were used without further purification.

Pulse radiolysis

Pulse radiolysis experiments were performed using an electron pulse (27 MeV, 8 ns, 0.87 kGy per pulse) from a linear accelerator at Osaka University. All experiments were performed with aqueous solutions (pH 7) that had been saturated with purified N2O gas for a minimum of 15 min by using a capillary technique.

Transient absorption spectra

A 2 mL solution was placed in a quartz cell (5 × 10 × 40 mm) that was sealed with a silicon rubber stopper. The kinetic measurements were performed using a nanosecond photoreaction analyzer system (Unisoku, TSP-1000). The monitor light was obtained from a pulsed 450 W Xe arc lamp (Ushio, UXL-451-0), which was operated by a large current pulsed-power supply that was synchronized with an electron pulse. The monitor light was passed through an iris with a diameter of 0.2 cm and sent into the sample solution at a perpendicular intersection to an electron pulse. The monitor light passing through the sample was focused on the entrance slit of a monochromator (Unisoku, MD200) and detected with a photomultiplier tube (Hamamatsu Photonics, R2949). The transient absorption spectra were measured using a photodiode array (Hamamatsu Photonics, S3904-1024F) with a gated image intensifier (Hamamatsu Photonics, C2925-01) as a detector.

Time resolved resonance Raman spectra

The sample solution was circulated through a quartz tube with 4 mm internal diameter using a roller pump. The Raman scattering was probed by 532 nm (80 mJ) or 355 nm (60 mJ) Nd-YAG laser pulse (Brilliant, Quantel; 5 ns fwhm) in a collinear configuration after controlled delay time using a digital delay generator (Stanford Research Systems, DG535), tuned in resonance with the optical absorption of transient species. The cell was adjusted to achieve the best overlap of focused electron beam with the focused laser beam crossing each other at 45° inside the sample cell at the scattering center. The Raman shifts were calibrated by the known toluene solvent. Scattered light from the sample to the perpendicular direction with respect to the laser pulse was collected using appropriate lenses and focused onto the optical fiber, which guided the scattered light onto a slit of a polychromator (Princeton Instruments, Acton SP-2500i) equipped with a grating (1800 g mm−1) after passing through an edge filter to remove Rayleigh scattering. The scattered light was detected with an ICCD detector (Princeton Instruments, PI-MAX3) operated with 5 ns of gate width, typically. All instruments were controlled using a personal computer via a controller (Unisoku). The Raman spectrum was obtained by accumulation of 50 events typically.

Theoretical calculations

Optimized structures, non-resonance Raman spectra, Merz-Singh–Kollman charges, and Mulliken atomic spin densities of the molecules in this study were estimated by density functional theory (DFT) at the (U)B3LYP/6-311+G(d,p) level using the Gaussian 09 package.19 Raman peak positions estimated at (U)B3LYP/6-311+G(d,p) level were scaled by using a factor of 0.97.20 XYZ coordinates of optimized structures are indicated in Tables S9–S29 in the (ESI). The resonance Raman spectra of radical cations by 532 nm excitation were calculated with the Becke88 Perdew86 exchange-correlation functional and the TZVP basis set using NWChem 6.6 program employing available patches.21,22 No factor was applied to resonance Raman peak positions estimated by UBP86/TZVP.

Results and discussion

Radical cation of 4-hydroxymethylthioanisole (MTPM˙+) was generated during the pulse radiolysis of MTPM in N2O-saturated aqueous solution containing NaBr. Initial products of the radiolysis are eaq, H˙, ˙OH, H2, H3O+, and H2O2 (eqn (1)) under the present condition.23 The eaq is quantitatively converted to ˙OH in N2O-saturated aqueous solution (eqn (2)). In the presence of bromide ion (Br), ˙OH reacts with Br to give Br˙ (eqn (3)), followed by a reaction of Br˙ with Br to give Br2˙ (eqn (4)).23 One-electron oxidation of MTPM occurs via a reaction with Br2˙ to generate MTPM˙+ (eqn (5)).24 At high concentration of MTPM (>5 mM), MTPM˙+ reacts with MTPM to give MTPM dimer radical cation (MTPM2˙+) in the ns time scale (eqn (6)).25
 
H2O ⇝ eaq, ˙OH, H˙, H2, H3O+, H2O2 (1)
 
eaq + N2O + H2O → N2 + OH + ˙OH (2)
 
˙OH + Br → OH + Br˙ (3)
 
Br˙ + Br → Br2˙ (4)
 
Br2˙ + MTPM → 2Br + MTPM˙+ (5)
 
MTPM˙+ + MTPM → MTPM2˙+ (6)

The ns-TA spectra during the pulse radiolysis of MTPM were measured by changing the MTPM concentration as shown in Fig. 2. In ns-TA spectrum of MTPM (0.5 mM), the absorption peak at 550 nm attributable to MTPM˙+ was clearly observed. With increasing the MTPM concentration from 0.5 to 5 mM, the peak around 550 nm showed blue-shift by approximately 20 nm together with appearance of a new peak around 800 nm, indicating the formation of σ- and π-MTPM2˙+ by dimerization of MTPM˙+ and MTPM. The absorption band at 530 nm has been assigned to σ-MTPM2˙+, which possesses a three electron S–S bond between MTPM˙+ and MTPM. It has been reported that some ArSCH3˙+ dimerize with ArSCH3 to give π-(ArSCH3)2˙+, showing a strong absorption peak around 800–1000 nm due to the charge resonance (CR) interaction. The 800 nm band of MTPM2˙+ is similar to CR-bands of π-dimer radical cations of alkylbenzenes, indicating the generation of π-MTPM2˙+.25


image file: c6ra21460f-f2.tif
Fig. 2 Transient absorption spectra observed at 500 ns after an electron pulse during the pulse radiolysis of MTPM (0.5 mM (black) or 5 mM (red)) in N2O-saturated aqueous solution (pH 7) containing NaBr (100 mM). The optical densities of two spectra are normalized at 580 nm. Insets show time profiles of the transient absorption at 550 nm (black) and at 540 and 780 nm (red), assigned to the formation of MTPM˙+ and σ- and π-MTPM˙+, respectively.

The Raman spectrum of neutral MTPM in 1,2-dichloroethane (DCE) solution was indicated in Fig. S1 in the ESI. Strong and medium Raman peaks were observed at 1599 and 1096 cm−1, respectively, together with a weak peak at 1192 cm−1. The observed Raman peaks were assigned based on the previously reported spectra of thioanisole26 and the DFT calculations at the UB3LYP/6-311+G(d,p) level. Because substituents of MTPM can rotate with respect to the benzene ring, several conformers are possible. Thus, Raman spectra of the conformers were calculated theoretically. In Table S1 in the ESI, calculated sum of electronic and zero-point energies were summarized for the conformers of neutral MTPM. As shown in Table S1, energy difference is on the order of 10 meV, thus, all conformers possibly exist in solution at room temperature. Thus, the observed Raman spectrum is considered to be a sum of these conformers (Fig. S1 in the ESI). Assignments of the observed peaks are summarized in Table S6 in the ESI. Similarly, conformers of other sulfides are studied as summarized in Tables S2–S5, and peak assignments of non-resonance Raman of their neutral states are also indicated in Table S6.

The ns-TR3 spectra observed at various delay time after an 8 ns electron pulse during the pulse radiolysis of MTPM (0.5 mM) in N2O-saturated aqueous solution containing NaBr (100 mM) were indicated in Fig. S2. In Fig. 3a, the spectrum at 500 ns was indicated as a representative. At this delay time, the Raman peaks of Br2˙ were not observed with the 532 nm probe (Fig. S3). The ns-TR3 spectrum showed an intense peak at 1101 cm−1 with weak peaks at 524, 657, 721, 803, 998, 1183, 1294 and 1475 cm−1 (Fig. 3a). Delay time dependence of intensity of the peak at 1101 cm−1 was consistent with the kinetic trace of ΔO.D. at 550 nm as shown in Fig. S4. In addition, peak positions were not changed with time and the ns-TR3 spectrum was independent of the concentration of MTPM as shown in Fig. S2. Thus, these peaks can be attributable to MTPM˙+. Assignments of the peaks were carried out based on time-dependent density functional (TD-DFT) calculation developed by Aquino and Schatz recently for resonance Raman spectra of open shell systems.22 In the present study, BP86 exchange-correlation functional and TZVP basis set were applied after their study. Possible conformers were also calculated for radical cations. The Raman peaks of MTPM˙+ were assigned based on the peak assignments of thioanisole radical cation (MTB˙+) using TD-DFT, because straightforward assignments are possible for MTB˙+ due to simple structure as summarized in Table S7 (see also ESI). Interestingly, the C[double bond, length as m-dash]C stretching vibration of benzene ring was observed at 1599 cm−1 for neutral MTPM, but it was not seen in MTPM˙+ (Fig. 3a). This observation is reproduced by the TD-DFT calculation. The C[double bond, length as m-dash]C stretching of MTPM˙+ was calculated to be 1577 or 1581 cm−1 with very weak intensity (Fig. 3b and c). Thus, downshifted C[double bond, length as m-dash]C stretching mode is expected for radical cation. The C–S stretch vibration of MTPM˙+ at 1101 cm−1 was upshifted compared with MTPM.


image file: c6ra21460f-f3.tif
Fig. 3 (a) ns-TR3 spectrum observed at 500 ns after an 8 ns electron pulse during the pulse radiolysis of MTPM (0.5 mM) in N2O-saturated aqueous solution containing NaBr (100 mM). Probe: 532 nm. (b and c) Raman peaks of MTPMd˙+ and MTPMe˙+, respectively (see Table S1 in the ESI), calculated by TDDFT at UBP86/TZVP level.

The geometry of MTPM˙+ optimized by DFT calculation is compared with that of neutral MTPM (Fig. 4). As discussed above, some conformers are possible for sulfides. For neutral MTPM, three are calculated as stable conformers by theoretical calculation (Table S1). Among them, conformer indicated in Fig. 4a (MTPMc) showed the lowest energy. The SCH3 group is almost perpendicular to the aromatic ring (dihedral angle: ϕ = 89.8°), while the SCH3 groups of other two conformers are coplanar to the benzene ring. For MTPM˙+, two conformers showed almost the same energy. In both conformers, the SCH3 group is coplanar to benzene ring (Fig. 4b, ϕ = 0.0°). The C1–S bond length decreases from 1.798 Å to 1.720 Å upon oxidation. Furthermore, the C2(5)–C3(6) bonds in benzene ring decrease from 1.392 (1.391) Å to 1.372 (1.376) Å upon oxidation, while C1(3)–C2(4) bonds increase from 1.398 (1.399) Å to 1.428 (1.419) Å. These dihedral angle and bond length changes suggest a semi-quinoidal structure including S atom and benzene ring for MTPM˙+ as shown in Scheme 1. In the above section, the upshift and downshift of C–S and C[double bond, length as m-dash]C vibrational modes, respectively, were confirmed. These Raman peak shifts are consistent with the formational of semi-quinoidal structure upon oxidation.


image file: c6ra21460f-f4.tif
Fig. 4 Optimized structures of representative conformers of (a) MTPM and (b) MTPM˙+ by the DFT calculation at the UB3LYP/6-311+G(d,p) level. Numbers are bond lengths (Å). Yellow and red colors show S and O atoms, respectively.

image file: c6ra21460f-s1.tif
Scheme 1 Dimerization of thioanisole radical cations with semi-quinoidal and quinoidal structures.

Fig. S6 shows the ns-TA spectra of 4-(methylthio)phenylacetic acid (MTPA) observed at 500 ns after an electron pulse during the pulse radiolysis of MTPA in aqueous solution. The ns-TA peak at 570 nm attributable to MTPA radical cation (MTPA˙+) was clearly observed when the sample included 1 mM MTPA. On the other hand, the absorption peaks around 540 and 800 nm were observed by increasing the MTPA concentration to 7.5 mM, indicating the formation of σ- and π-(MTPA)2˙+.

Fig. S7a shows the ns-TR3 spectrum of MTPA observed at 500 ns after an electron pulse during the pulse radiolysis of MTPA (0.5 mM). The peaks of ns-TR3 spectrum are consistent with those of MTPA˙+ calculated by the TD-DFT method (Fig. S7). The downshifted C[double bond, length as m-dash]C stretching vibration of benzene ring was observed around 1580 cm−1 with very weak intensity as expected from the TD-DFT calculation. The upshift of C–S stretch vibration of MTPA˙+ was also observed. In addition, the bond lengths calculated by the DFT calculation indicated the semi-quinoidal structure of MTPA˙+ (Table S8).

In the cases of 4-methylthioanisole (MTT) and MTB, the ns-TA peaks of MTT radical cation (MTT˙+) and MTB˙+ in aqueous solutions were observed at 550 and 540 nm, respectively (Fig. S8). The ns-TA of σ- and π-(ArSCH3)2˙+ could not be observed because of poor solubility in aqueous solution, but the formations of σ- and π-(ArSCH3)2˙+ were confirmed in benzonitrile27 by increasing the concentration to 50 mM (Fig. S9). The peaks of ns-TR3 spectra of MTT˙+ and MTB˙+ (Fig. S10 and S5, respectively) and theoretical calculation (Table S8) supported semi-quinoidal structures in the oxidized state.

For 4-methoxythioanisole (MTA), the absorption peak attributable to MTA radical cation (MTA˙+) appeared at 580 nm (Fig. S11). It is notable that the spectral shape of ns-TA was independent of the MTA concentration (1 and 50 mM) in benzonitrile, indicating absence of MTA dimer radical cation (MTA2˙+) formation. The Raman spectrum of neutral MTA showed peaks at 1096, 1570, and 1596 cm−1 (Fig. S12), which agreed with the previously reported spectra and DFT calculation.26,28 The ns-TR3 spectrum during the pulse radiolysis of MTA showed intense ns-TR3 peaks at 1120 and 1603 cm−1 as well as weak peaks at 503, 644, 719, 804, 988, 1427, 1457, and 1498 cm−1 (Fig. 5a). The ns-TR3 signals decayed without any spectral change within 5 μs (Fig. S13). Such behavior is in agreement with the ns-TA of MTA. These peaks are consistent with those of MTA˙+ calculated by the TD-DFT as shown in Fig. 5b. In the case of MTA˙+, the upshift of C–S stretch vibration (1119 cm−1) was observed upon oxidation. The CPh–O mode around 1300 cm−1 became obscure, while intensity of C[double bond, length as m-dash]C of benzene ring is enhanced. The geometry of MTA˙+ optimized by the DFT calculation is compared with that of neutral MTA (Fig. 6). In the neutral state, the SCH3 of one of the two conformers is perpendicular to the benzene ring, while in the oxidized state SCH3 is coplanar to the benzene ring in the both conformers. Among conformers, the conformers with the lower energy are compared (MTAb and MTAd, see Table S5).


image file: c6ra21460f-f5.tif
Fig. 5 (a) ns-TR3 spectrum observed at 500 ns after an 8 ns electron pulse during the pulse radiolysis of MTA (1 mM) in N2O-saturated aqueous solution containing NaBr (100 mM). Probe: 532 nm. (b and c) Raman peaks of MTAc˙+ and MTAd˙+, respectively (see Table S5 in the ESI), calculated by TDDFT at UBP86/TZVP level.

image file: c6ra21460f-f6.tif
Fig. 6 Optimized structures of (a) MTA and (b) MTA˙+ by the DFT calculation at the UB3LYP/6-311+G(d,p) level. Numbers are calculated bond lengths (Å). Yellow and red colors show S and O atoms, respectively.

Upon oxidation, the C2(5)–C3(6) bond length in benzene ring decreases from 1.394 (1.390) Å to 1.371 (1.368) Å, while the C1(6)–C2(1) bond length increases from 1.397 (1.401) Å to 1.425 (1.421) Å. The C1–S bond length decreases from 1.787 Å to 1.723 Å upon oxidation, indicating the increase in the double bond character. Furthermore, the C4–O bond length decreases from 1.367 Å to 1.317 Å. These results suggest the MTA˙+ has a quinoidal structure different from other sulfides as shown in Scheme 1.

The charges of ArSCH3˙+ were calculated using the Merz-Singh–Kollman as shown in Table 1.29 The charge on S atom increases in the order of MTA˙+ (0.115) < MTPM˙+ (0.143) < MTT˙+ (0.144) < MTPA˙+ (0.163) < MTB˙+ (0.165), suggesting that higher positive charge on S atom is responsible to the formation of σ-(ArSCH3)2˙+ as shown in Scheme 1.

Table 1 The Merz-Singh–Kollman charge for ArSCH3˙+ by the DFT calculation at the UB3LYP/6-311+G(d,p) levela
Atom MTPM˙+ MTPA˙+ MTT˙+ MTB˙+ MTA˙+
a Merz-Singh–Kollman charge of the most stable conformers (MTPMd˙+, MTPAf˙+, MTTc˙+, MTBc˙+, and MTAd˙+, see Tables S1–S5 in the ESI) are indicated.
C1 0.068 0.105 0.123 0.144 0.067
C2 0.132 0.121 0.105 0.069 0.068
C3 −0.130 −0.069 −0.086 0.050 −0.079
C4 0.402 0.344 0.455 0.208 0.627
C5 −0.039 −0.001 −0.046 0.037 −0.179
C6 0.117 0.063 0.070 0.017 0.179
S 0.143 0.163 0.144 0.165 0.115


The Mulliken atomic spin densities for ArSCH3˙+ were also shown in Table 2. The spin density on C4 of benzene ring increases in the order of MTA˙+ (0.178) < MTPA˙+ (0.289) < MTPM˙+ (0.302) < MTB˙+ (0.309) < MTT˙+ (0.311), indicating the semi-quinoidal structures for MTPM˙+, MTPA˙+, MTT˙+ and MTB˙+ while the quinoidal one for MTA˙+. The C1–S bond length of ArSCH3˙+ (1.72 Å) is shorter than that of ArSCH3 (1.79 Å) and the C–S stretching vibration of ArSCH3˙+ around 1100 cm−1 showed the upshift compared with of ArSCH3. The results indicated the double-bond character of C1–S of ArSCH3˙+ with the semi-quinoidal or quinoidal structures.

Table 2 Mulliken atomic spin density for ArSCH3˙+ by the DFT calculation at the UB3LYP/6-311+G(d,p) levela
Atom MTPM˙+ MTPA˙+ MTT˙+ MTB˙+ MTA˙+
a Mulliken atomic spin density of the most stable conformers (MTPMd˙+, MTPAf˙+, MTTc˙+, MTBc˙+, and MTAd˙+, see Tables S1–S5 in the ESI) are indicated.
C1 0.177 0.168 0.170 0.135 0.214
C2 0.020 0.132 0.136 0.075 0.011
C3 −0.093 −0.033 −0.035 −0.104 −0.006
C4 0.302 0.289 0.311 0.309 0.178
C5 −0.038 −0.097 −0.090 −0.049 0.042
C6 0.156 0.042 0.0407 0.145 0.050


The positive charge on the benzene ring increases in the order of MTA˙+ (0.506) < MTB˙+ (0.525) < MTPM˙+ (0.549) < MTPA˙+ (0.563) < MTT˙+ (0.621), indicating that the positive charge of MTPM˙+, MTPA˙+, MTT˙+ and MTB˙+ with semi-quinoidal structure localized on ArS is higher than that of MTA˙+ with the quinoidal structure. Therefore, ArSCH3˙+ with semi-quinoidal structure dimerizes to σ- and π-(ArSCH3)2˙+ by the face-to-face interaction between ArS and ArS chromophores as shown in Scheme 1. In other words, the positive charge localization on S atom and benzene ring is important for the formation of σ- and π-(ArSCH3)2˙+.

On the other hand, MTA˙+ has a strong electron-donating –OCH3 group and the positive charge is mostly delocalized on MTA˙+. The quinoidal structure of MTA˙+ with the conjugation between S and O atoms non-bonding electrons and π-electrons of benzene ring induces double-bond character of CPh–S and CPh–O bonds. The obscure C–O stretching vibration and the largest upshift of C–S stretching vibration were observed for MTA˙+. The formation of σ- and π-MTA2˙+ are unfavorable due to the electronic repulsion of the positive charge delocalized on two MTA molecules. The formation of σ- and π-(ArSCH3)2˙+ for ArSCH3˙+ with the quinoidal structure is inhibited (Scheme 1).

Conclusions

The structures of ArSCH3˙+ in aqueous solution were studied by ns-TR3 spectroscopy during pulse radiolysis and DFT calculations. Positive charge of ArSCH3˙+ delocalizes on S atom and benzene ring with increasing the double bond character of CPh–S bond. Semi-quinoidal structure with conjugation between S atom non-bonding electron and π-electrons of benzene ring is found to be important for formation of σ- and π-(ArSCH3)2˙+. On the other hand, quinoidal structure of MTA˙+ is not suitable for formation of σ- and π-(ArSCH3)2˙+. To clarify the relationship between structure and dimerization of ArSCH3˙+ further studies for vibrational structure of σ- and π-(ArSCH3)2˙+ are in progress.

Acknowledgements

We thank the members of the Research Laboratory for Quantum Beam Science of ISIR, Osaka University for assistance in the pulse radiolysis experiments. This work has been partly supported by a Grant-in-Aid for Scientific Research (Projects 25220806, 25288035, and 25390125) from the Ministry of Education, Culture, Sports, Science and Technology (MEXT) of Japanese Government.

Notes and references

  1. H. Mohan and J. P. Mittal, J. Phys. Chem. A, 2002, 106, 6574–6580 CrossRef CAS.
  2. A. Korzeniowska-Sobczuk, G. L. Hug, I. Carmichael and K. Bobrowski, J. Phys. Chem. A, 2002, 106, 9251–9260 CrossRef CAS.
  3. O. Lanzalunga and A. Lapi, J. Sulfur Chem., 2012, 33, 101–129 CrossRef CAS.
  4. K. P. Prasanthkumar, C. H. Suresh and C. T. Aravindakumar, J. Phys. Chem. A, 2012, 116, 10712–10720 CrossRef CAS PubMed.
  5. S. A. Chaudhri, M. Goebl, T. Freyholdt and K. D. Asmus, J. Am. Chem. Soc., 1984, 106, 5988–5992 CrossRef CAS.
  6. S. A. Chaudhri, H. Mohan, E. Anklam and K.-D. Asmus, J. Chem. Soc., Perkin Trans. 2, 1996, 383–390 RSC.
  7. D. K. Maity, J. Am. Chem. Soc., 2002, 124, 8321–8328 CrossRef CAS PubMed.
  8. H. Yokoi, A. Hatta, K. Ishiguro and Y. Sawaki, J. Am. Chem. Soc., 1998, 120, 12728–12733 CrossRef CAS.
  9. G. N. R. Tripathi and D. M. Chipman, J. Phys. Chem. A, 2002, 106, 8908–8916 CrossRef CAS.
  10. G. N. R. Tripathi and Y. Su, J. Phys. Chem. A, 2004, 108, 3478–3484 CrossRef CAS.
  11. M. Fujitsuka, D. W. Cho, S. Tojo, J. Choi, H.-H. Huang, J.-S. Yang and T. Majima, J. Phys. Chem. A, 2014, 118, 2307–2315 CrossRef CAS PubMed.
  12. M. Fujitsuka, D. W. Cho, J. Choi, S. Tojo and T. Majima, J. Phys. Chem. A, 2015, 119, 6816–6822 CrossRef CAS PubMed.
  13. J. Choi, D. W. Cho, S. Tojo, M. Fujitsuka and T. Majima, J. Phys. Chem. A, 2015, 119, 851–856 CrossRef CAS PubMed.
  14. J. Xue, Y. Li, L. Du, Y. Du, W. Tang, X. Zheng and D. L. Phillips, J. Phys. Chem. B, 2015, 119, 14720–14727 CrossRef CAS PubMed.
  15. M.-D. Li, P. J. Hanway, T. R. Albright, A. H. Winter and D. L. Phillips, J. Am. Chem. Soc., 2014, 136, 12364–12370 CrossRef CAS PubMed.
  16. T. Su, J. Ma, N. Wong and D. L. Phillips, J. Phys. Chem. B, 2013, 117, 8347–8359 CrossRef CAS PubMed.
  17. R. Wilbrandt, N. H. Jensen, P. Pagsberg, A. H. Sillesen, K. B. Hansen and R. E. Hester, J. Raman Spectrosc., 1981, 11, 24–26 CrossRef CAS.
  18. I. Janik and G. N. R. Tripathi, J. Chem. Phys., 2013, 138, 044506 CrossRef PubMed.
  19. M. J. T. Frisch, G. W. Trucks, H. B. Schlegel, G. E. Scuseria, M. A. Robb, J. R. Cheeseman, G. Scalmani, V. Barone, B. Mennucci, G. A. Petersson, H. Nakatsuji, M. Caricato, X. Li, H. P. Hratchian, A. F. Izmaylov, J. Bloino, G. Zheng, J. L. Sonnenberg, M. Hada, M. Ehara, K. Toyota, R. Fukuda, J. Hasegawa, M. Ishida, T. Nakajima, Y. Honda, O. Kitao, H. Nakai, T. Vreven, J. A. Montgomery, J. E. Peralta, F. Ogliaro, M. Bearpark, J. J. Heyd, E. Brothers, K. N. Kudin, V. N. Staroverov, R. Kobayashi, J. Normand, K. Raghavachari, A. Rendell, J. C. Burant, S. S. Iyengar, J. Tomasi, M. Cossi, N. Rega, J. M. Millam, M. Klene, J. E. Knox, J. B. Cross, V. Bakken, C. Adamo, J. Jaramillo, R. Gomperts, R. E. Stratmann, O. Yazyev, A. J. Austin, R. Cammi, C. Pomelli, J. W. Ochterski, R. L. Martin, K. Morokuma, V. G. Zakrzewski, G. A. Voth, P. Salvador, J. J. Dannenberg, S. Dapprich, A. D. Daniels, O. Farkas, J. B. Foresman, J. V. Ortiz, J. Cioslowski and D. J. Fox, Gaussian 09, I. W. C. Gaussian, 2009 Search PubMed.
  20. M. P. Andersson and P. Uvdal, J. Phys. Chem. A, 2005, 109, 2937–2941 CrossRef CAS PubMed.
  21. M. Valiev, E. J. Bylaska, N. Govind, K. Kowalski, T. P. Straatsma, H. J. J. Van Dam, D. Wang, J. Nieplocha, E. Apra, T. L. Windus and W. A. de Jong, Comput. Phys. Commun., 2010, 181, 1477–1489 CrossRef CAS.
  22. F. W. Aquino and G. C. Schatz, J. Phys. Chem. A, 2014, 118, 517–525 CrossRef CAS PubMed.
  23. Y. Tabata, Y. Ito and S. Tagawa, Handbook of Radiation Chemistry, 1991, pp. 322–323 Search PubMed.
  24. H. Mohan and J. P. Mittal, Bull. Chem. Soc. Jpn., 2001, 74, 1649–1659 CrossRef CAS.
  25. T. Tachikawa, S. Tojo, M. Fujitsuka and T. Majima, J. Phys. Chem. B, 2005, 109, 17460–17466 CrossRef CAS PubMed.
  26. M.-X. Liu, B.-B. Xie, M.-J. Li, Y.-Y. Zhao, K.-M. Pei, H.-G. Wang and X. Zheng, J. Raman Spectrosc., 2013, 44, 440–446 CrossRef CAS.
  27. A. Kira, S. Arai and M. Imamura, J. Phys. Chem., 1972, 76, 1119–1124 CrossRef CAS.
  28. G. N. R. Tripathi, Chem. Phys. Lett., 1992, 199, 409–416 CrossRef CAS.
  29. E. Baciocchi and M. F. Gerini, J. Phys. Chem. A, 2004, 108, 2332–2338 CrossRef CAS.

Footnote

Electronic supplementary information (ESI) available. See DOI: 10.1039/c6ra21460f

This journal is © The Royal Society of Chemistry 2016
Click here to see how this site uses Cookies. View our privacy policy here.