DOI:
10.1039/C6RA21210G
(Paper)
RSC Adv., 2016,
6, 102853-102868
Development of biocompatible hydroxyapatite–poly(ethylene glycol) core–shell nanoparticles as an improved drug carrier: structural and electrical characterizations†
Received
23rd August 2016
, Accepted 29th September 2016
First published on 14th October 2016
Abstract
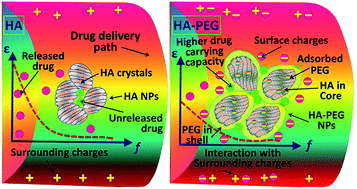
Hydroxyapatite–5 wt% poly(ethylene glycol) (HA–PEG) core–shell composite nanoparticles (NPs) were synthesized using a coprecipitation technique. For the first time, the NPs are characterized for potential drug delivery applications using structural, electrical and in vitro kinetic studies. Phase quantification and the crystal structures of the NPs were analyzed using X-ray diffraction and Fourier transform infrared spectroscopy and the morphology was determined using scanning electron and transmission electron microscopies. Dielectric spectroscopy was used to analyze the polarization behaviour of the HA and HA–PEG core–shell NPs as potential drug carriers by applying an oscillating (100 Hz to 2.5 MHz) electric field. The increased intra-particle interfacial interactions in the HA–PEG NPs confirmed the significant enhancement in interfacial or space charge polarization owing to the reduction in mobility and accumulation of charge-carriers at the interfaces. Thus, HA–PEG showed better aceclofenac drug releasing properties than pristine HA NPs. An in vitro cell study confirmed that the HA and HA–PEG core–shell nanocarriers showed excellent biocompatibility on human dermis fibroblast (HDF) cells. The interaction within the HA–PEG core–shell was stronger than with pristine HA and the biodegradable PEG from the shell-layer neutralized the composite-surroundings path. Hence, it would reduce the direct interaction of aceclofenac drug with the surrounding biomolecules of the delivery paths and enhance the ability for carrying the drug precisely to the target organs.
1. Introduction
Recently, polymers and nanomaterials have received much interest, especially in the fields of tissue engineering and pharmaceuticals, as well as in biomedical industries owing to their several advantages, such as smaller particle size, low toxicity, the enhanced therapeutic efficiency of drugs, increased drug solubility and efficacy.1 Hence, nanoparticles (NPs) have become more influential materials in current trends for drug delivery research. Recently, the emergence of both core–shell NPs and other nanocomposites has created extraordinary improvements in biomedical sciences, drug delivery systems, and other advanced electroceramic and catalytic applications. Among a few recent works, Reshmi et al., 2009, investigated dielectric studies of magnetic core–polymer shell NPs for potential controlled drug delivery applications.2 They found that the dielectric properties had some influence on the core–shell NP drug carrier interactions. Especially in nanoscale drug delivery systems, both natural and synthetic polymers showed an improvement in the therapeutic efficacy of poorly absorbed and metabolized drugs in targeted drug delivery applications.3 Hydroxyapatite, HA (Ca10(PO4)6(OH)2), which is chemically similar to the building blocks of inorganic bone minerals, shows significant bonding with organic or biomolecules4,5 and has been extensively used in the repair and generation of articular cartilage and bone6 due to its excellent bioactive nature,7 biocompatible, non-toxic, non-immunogenic and non-inflammatory properties,8 obtained via different sources or processing routes of the HA.4,9 Recently, HA was implemented as the best bioceramic material in several advanced areas of interest, such as drug delivery,10 hyperthermia treatment of cancer,11 dental materials,12 and bone grafts.5 Pristine HA with a lower particle size showed a higher toxic effect on human gastric cancer cells.13 It also has a good protein absorption capacity particularly at the grain boundary region.5 Its unique configuration and high specific surface area owing to its porous structure has created a new aspect in drug delivery applications. Various electrical responses were recently studied to measure its efficiency as a carrier in drug delivery systems14 and biological responses on the polarized surface of HA15 for use in advanced applications, pristine HA has shown excellent electrical behaviour so far. In this context, HA along with some polymers has shown better improvement.16,17 The composites displayed a better ability to deliver drugs to the target by the interaction of two or more different components present in the composites while moving through a biological medium,2 which may decrease the interactions between the drug molecules and biological molecules in the delivery path. Polymeric materials have been used in several applications for surface modification and stability. Recently, poly(ethylene glycol), PEG (HO–(CH2–CH2–O)nH) has been highlighted as one of the most promising polymers in the cosmetic industry, in food additives, plasticizers, and biomedical fields, including advanced drug delivery due to its excellent biocompatibility and biodegradable nature.4 In this context, biodegradable polymer, PEG has already been proven as an efficient biomaterial in drug delivery, cell adhesion, growth and proliferation, protein adsorption and in medical treatment studies.18,19 Several biological advantages, such as non-immunogenicity, non-toxicity and non-antigenicity, make it a more reliable biomaterial.20 It had been reported that PEG based polymer micelles showed inconsistent cytotoxicity21 but PEG functionalized zinc oxide showed reduced cytotoxicity on different cancer cells.22 PEG has elicited intensive interest by enhancing its affinity of chelating with the Ca2+ ions of HA23 and has been shown to be an attractive material in drug delivery due to its favourable physicochemical properties.24
Since bone is comprised of fluids, collagen and a HA matrix, besides biocompatibility, the electrical and dielectric properties have been investigated for developing sensor materials or efficient osteoconductive bone scaffolds in several reports.25,26 All these reports investigated sintering temperature and porosity as a function of the dielectric characteristics of pure HA, ion exchanged HA and HA based composites for bone regeneration. However, none of these studies investigated the electrical or dielectric properties in order to develop an ideal drug carrier. Since most of the drug carriers contained calcium phosphates, the electrical and dielectric characteristics could be worth studying for developing excellent intra-particle interactions in the carrier to send the drug to a target organ more smoothly. Thus, a complex impedance spectroscopy technique would be a suitable approach to investigate the dielectric and electrical properties of HA or HA based composites. Therefore, in the present study, dielectric spectroscopy is used as an analytical technique to observe the polarization behaviour of HA–PEG core–shell NPs comparing them with HA for drug delivery applications by applying an oscillating electric field to the samples over a range of frequencies.
According to our previous study, PEG functionalized HA shows excellent biocompatibility with human fibroblast cells.4 In the present work, we have studied the effect of functionalized biodegradable PEG polymer on HA NPs on the aceclofenac (AF) drug releasing kinetics. The novel idea of this study is to reduce the direct interactions between the AF drug molecules and the biological molecules of the delivery paths in order to send the drug to the target organ. Despite a few preliminary electrical studies of HA, the electrical properties of HA–PEG core–shell structures have not been characterized in terms of the potentiality as drug carriers so far. Hence, here, we aim to develop HA–PEG core–shell NPs through synthesizing HA as the core of the NP, which will be encapsulated within a PEG polymer shell. Wet chemical precipitation and coprecipitation techniques will be executed for the synthesis of HA and HA–PEG core–shell nanoparticles (NPs), respectively. This study also aims to elucidate the conductive nature of the HA–PEG core–shell NPs. To the best of our knowledge, no report has been found to investigate the electrical parameters of these nanocomposites for implementing them as potential drug delivery carriers to date. Therefore, the main aim of the present investigation is to explicate a novel fabricating approach for a potent drug carrier design by using HA–PEG core–shell NPs with suitable electrical characteristics and in vitro kinetic studies for controlled drug delivery applications.
2. Experimental
2.1. Materials
Analytical grade calcium oxide (CaO), orthophosphoric acid (H3PO4) and poly(ethylene glycol) (PEG8000) of molecular weight 8000 Da (Fischer Scientific (M)) were used for the preparation of hydroxyapatite (HA) and the PEG coated HA NPs without further processing. HA and the PEG coated on HA NPs were synthesized using wet chemical precipitation and coprecipitation techniques, respectively.16,27,28
2.2. Synthesis of the hydroxyapatite nanoparticles
A schematic wet chemical precipitation method was used to prepare pristine HA and is depicted in Fig. 1A. Stoichiometric amounts of CaO (1.34 M) and H3PO4 (2.07 M) were employed as the sources of calcium (Ca2+) and phosphate (PO43−) ions for the synthesis of HA. This method was usually executed by preparing separately aqueous suspensions of 200 mL of CaO and 100 mL of H3PO4. A clear aqueous solution of freshly prepared H3PO4 was added dropwise with an average speed of 1.61 mL min−1 to the freshly prepared precursor CaO at 50 °C, while stirring vigorously using a magnetic stirrer at 800 rpm. The pH of the formulated suspension changed gradually from 14.8 to 8.7 and the time courses with addition of H3PO4 solution are depicted in Fig. 1B and C, respectively. Subsequently, the prepared homogeneous mixture was kept overnight (12 h) with vigorous stirring (1400 rpm) at 50 °C. The pH of the formulated suspension was conserved between 8.6 to 9.6 during the entire stirring period. The resultant slurry was centrifuged at 5000 rpm for 15 min to separate the liquid from the solid precipitated part and to obtain a thick paste-like slurry. The obtained milky white centrifuged precipitate was then dried at 110 °C for 24 h in an oven.
 |
| Fig. 1 Schematic representations of (A) the synthesis of hydroxyapatite (HA) and the HA–PEG core–shell nanocomposites using a wet chemical precipitation or the coprecipitation method, (B) variations of pH during the addition of H3PO4 solution to CaO- or (CaO + PEG)-precursors at 50 °C and (C) the time taken during the addition of H3PO4 solution to CaO- or (CaO + PEG)-precursors at 50 °C. Note: only CaO and H3PO4 precursors were used for the synthesis of pristine HA and PEG was added to the CaO precursor in addition to H3PO4 precursor for the HA–PEG synthesis. | |
2.3. Preparation of the hydroxyapatite–PEG core–shell nanoparticles
A schematic synthesis coprecipitation technique for HA–PEG, very similar to the synthesis of pristine HA, is also depicted in Fig. 1A. Initially, 200 mL of aqueous solution of 0.11 M PEG was mixed thoroughly for 20 min with a calculated amount of 1.34 M CaO at 25 °C. Then, 100 mL of aqueous solution of freshly prepared H3PO4 (2.07 M) was added dropwise with an average speed of 0.95 mL min−1 to the freshly prepared precursor of CaO and PEG. The mixed precursor was then magnetically stirred at 50 °C for 2 h with a speed of 800 rpm to make HA–PEG core–shell NPs. The pH of this suspension was changed gradually from 14.7 to 8.6 with the addition of H3PO4 solution as depicted in Fig. 1B. Subsequently, the prepared homogeneous mixture was vigorously stirred (1400 rpm) for 12 h at 50 °C in a pH range of 8.6–9.6. The resultant milky white slurry was then centrifuged at 5000 rpm for 15 min to separate out the supernatant from the coprecipitated solid part and a thick paste-like slurry was obtained. The centrifuged coprecipitated solid part was then dried at lower temperature (55 °C) for a longer time (48 h) in an oven since the melting temperature of PEG is between 60 and 70 °C.4 The main chemical reactions taking place during the synthesis of HA and the HA–PEG NPs are shown in reactions (i) and (ii), respectively. From reaction (ii) it can be noted that the alcoholic (OH) group of PEG can condense with a hydroxyl (OH−) group of the group HA metal and produce a water molecule, by the combination of the H+ and OH− ions. |
5CaO + 3H3PO4 = Ca5(PO4)3(OH) + 4H2O + heat
| (i) |
|
Ca5(PO4)3(OH) + HO–(CH2–CH2–O)nH = Ca5(PO4)3O–(CH2–CH2–O)nH + H2O
| (ii) |
2.4. Sample preparation and dielectric measurement
Fine dried powder of HA and theHA–PEG NPs were placed into a stainless steel cylindrical mould with an inner diameter of 10 mm to develop cylindrical pellets of an average height of 3 mm applying a high uniaxial pressure of 375 MPa for 4 min using a hydraulic press. The pellets, of size ϕ 10 mm × 3 mm, were used for the dielectric measurements.
2.5. Loading of the aceclofenac (AF) drug in the HA and HA–PEG composite carriers
Aceclofenac (C16H13Cl2NO4) drug (Sigma Aldrich) solution in chloroform (CHCl3) of concentration 2 mg mL−1 was added separately to the pristine HA and HA–PEG composite carrier powders with a concentration of 120 mg mL−1 in CHCl3. The drug loaded carriers were kept for 24 h at 25 °C for complete adsorption of the drug and for further use for the drug releasing study. The COOH and N–H functional groups may be responsible for forming the bonds with the pristine HA and HA–PEG composite carrier NPs through secondary bonding, and may enhance the drug releasing properties of the carrier NPs during hydrolysis in a suitable environment.
2.6. Characterizations
2.6.1. Structural analysis. X-Ray diffraction (XRD) was employed to analyze the crystallographic phases of the powder specimens using an X-ray diffractometer (model: Empyrean, make: PANalytical BV) with a Cu-Kα radiation source of wavelength λ = 1.54056 Å. The concentration of PEG in the HA–PEG composite was calculated using the following eqn (1). |
 | (1) |
where, ∑IPEG is the total of intensity counts for all the major peaks due to the pristine PEG and ∑IHA is the total of intensity counts for all the major peaks due to the pristine HA present in the HA–PEG composite. Fourier-transform infrared (FTIR) spectroscopy was used to determine the molecular changes upon the surface treatment of HA with PEG using an attenuated total reflectance (ATR)-FTIR spectrometer (model: FTIR-ATR 400, make: Perkin Elmer) and the data were recorded at a resolution of 4 cm−1.
2.6.2. Morphological analysis. The morphology of the HA and HA–PEG composite NPs was analyzed using a field emission scanning electron microscope (FESEM) (model: AURIGA, make: Carl ZEISS) and a transmission electron microscope (TEM) (model: LEO-Libra 120, make: Carl ZEISS AG).
2.6.3. Dielectric measurement. Dielectric measurements of the HA and HA–PEG composite were analyzed at a frequency (f) range of 100 Hz to 2.5 MHz at 25 °C by placing the pellet samples in between two electrodes of a sample holder, which was attached to a computer operated LCR meter (model: 3532-50 LCR HiTESTER, make: HIOKI) with a crocodile cord. The present dielectric measurement was performed analyzing the dielectric parameters, such as the dielectric constant (ε′), dielectric loss (ε′′), dielectric loss factor (tan
δ), capacitance (C), impedance values (Cole–Cole plots), the real part of the electric modulus (M′), the imaginary part of the electric modulus (M′′) and the alternating current (AC) conductivity (σac), of the core–shell nanocomposites in order to facilitate in potential drug delivery applications.
2.6.4. In vitro drug release kinetic assay. The in vitro drug release kinetic studies of the materials were performed as described in our previous method.28 The standard curve of pure AF was made corresponding to the highest absorption peak wavelength (λmax) at 276 nm from its different known concentration solutions, as reported previously.29 A freshly prepared phosphate buffered saline (PBS) solution was used as a blank for the tests of all samples (HA and HA–PEG). A brief description of the in vitro drug release kinetic assay is provided in Section S1 in ESI file.† The drug–carrier interaction morphology was performed using an FESEM study.
2.6.5. In vitro human fibroblast cell compatibility assay. To evaluate the biocompatibility of our HA and HA–PEG carrier samples, in vitro human dermis fibroblast (HDF) cell culture assay was performed according to our previous reports.4,28 The cell culture procedure is briefly described in Section S2.1 in ESI file.† The HA and HA–PEG particles were also vigorously dispersed in PBS and Dulbecco’s modification of Eagle’s medium (DMEM) cell culture media (day-7) to compare the particle dispersion in PBS as well as cell uptakes in cell culture DMEM under optical microscopy (Eclipse TS 100, Nikon).The cellular metabolic activity and proliferation of the scaffolds were quantified using an Alamar blue (AB) (Life Technologies) assay. The method of AB assay is briefly described in Section S2.2 in ESI file.† The percentage (%) of reduction of AB with respect to the absorbance value was calculated to express the cell proliferation status on the nanocomposites.4,30 AB results were statistically examined using one-way ANOVA with a Newman–Keuls multiple comparison test, which indicates highly significant (**p < 0.0001) and significant (*p < 0.05) cell proliferation for all the samples within particular time points.
In another quantitative analysis, cell proliferation and cell growth rate on the nanocomposites were performed to evaluate the total deoxyribonucleic acid (DNA) content. The DNA assay procedure is precisely described in Section S2.3 in ESI file.† DNA results were statistically examined using one-way ANOVA with the variance of p > 0.0001 for insignificant and p ≤ 0.0001 significant with increasing time periods from day-1 to day-7 for all samples.
To ensure the cell viability of the scaffolds, a qualitative analysis was also carried out at day-1, day-3 and day-7 via a live–dead cell assay using a confocal laser scanning microscope (CLSM) (Leica TCS SP5 II). The confocal microscopy technique is briefly described in Section S2.4 in ESI file.† The dead cells were distinguished using bright red fluorescence due to the nucleic acids of the dead cells stained by EthD-1 indicating a damaged cell membrane.
3. Results and discussion
3.1. Structural analysis
The XRD patterns of the pristine as-received HA, HA–PEG, and commercial PEG are depicted in Fig. 2a–c, respectively. All the XRD peaks of the pristine HA closely resembled HA developed using other synthesis techniques9,27 and also matched with the standard XRD pattern in JCPDS file: 00-009-0432. Quantification of the PEG present in the HA–PEG composite was found to be 4.8% using eqn (1), which was very close to our estimated weight i.e., 5 wt% taken during composite preparation.27
 |
| Fig. 2 XRD patterns of (a) the pristine as-prepared HA, (b) the HA–PEG composite NPs and (c) the pristine commercial PEG with their different characteristic crystalline planes. Note: the main crystalline planes of HA are indicated with “*” in plot-a, the major crystalline XRD peaks of PEG are represented with “■” and the major peaks of the PEG are observed with little shifting of the peaks due to the presence of HA. | |
The small difference from our estimated value might have come from the background effect in the XRD. Another reason behind this difference might be that since the solution contained PEG, some amount of foam might be produced while stirring during the synthesis. This probably happened due to the foaming characteristics of PEG and hence, a small amount of PEG could not react with HA and led to the deviation. Average crystallite sizes27 of all the materials, the volume fraction of the grain boundary31 and the crystallinity32 of both HA and PEG in the HA–PEG composite have also been evaluated from the XRD study and are illustrated in Table 1. All of the major crystalline planes of pristine HA have been revealed in the HA–PEG composite. Three major peaks of PEG have also been found in the HA–PEG composite with little shifting. The shifting of the PEG peaks in the composites might be obtained due to the formation of functionalization with the HA molecules. In addition, the two main XRD peaks of PEG, such as at 2θ = 19.4° had noticeably shifted to 2θ = 18.3° and another peak 2θ = 23.9° was significantly reduced in the HA–PEG composite material. This is a clear indication of functionalization of the HA surface with PEG possibly through OH− exchange according to reaction (ii). The surface modified HA particles had reportedly shown better adsorption to the biomolecules compared to bare HA particles.4,33 Thus, HA–PEG composite NPs would have better drug carrying properties.
Table 1 Parameters determined from XRD study for pristine HA, HA–PEG, and pristine PEG
Parameter |
Formula used |
HA |
HA–PEG |
PEG |
Grain boundary thickness (t) obtained from micrograph = 1 nm. Grain boundary thickness (t) obtained from micrograph = 2 nm. |
Average crystallite size (d, nm) |
Debye–Scherrer formula |
40 |
53 |
35 |
Grain boundary volume fraction |
 |
0.071a |
0.106b |
0.081a |
HA wt% in HA–PEG composite |
Eqn (1) |
|
95.2 |
|
PEG wt% in HA–PEG composite |
Eqn (1) |
|
4.8 |
|
Crystallinity of HA in the HA–PEG composite (%) (I is XRD intensity counts) |
 |
|
85 |
|
Crystallinity of PEG in the HA–PEG composite (%) |
 |
|
0.47 |
|
The functionalization of the HA surface with PEG molecules was further confirmed using FTIR analysis. FTIR spectra and all the chemical bands present in pristine the HA, HA–PEG composite and PEG polymer are depicted in Fig. 3. This result indicates that the significant shifting in molecular OH− due to the HA molecule and alcoholic OH group due to the PEG polymer occurred from 3642 to 3571 cm−1 and from 3480 to 3365 cm−1, respectively, in the HA–PEG nanocomposite.4 The peaks at 1416 and 1419 cm−1 in HA and the HA–PEG materials might be attributed to an unexpected CO32− band owing to adsorbed carbon dioxide (CO2) on the HA molecules from the atmosphere.34 A significant shift in the C–CH aliphatic deformation vibration peak was observed from 841 to 875 cm−1 for PEG to the HA–PEG nanocomposite.4 The shifting of the FTIR peaks indicates a strong possibility of functionalization between HA and PEG in the HA–PEG composite NPs.
 |
| Fig. 3 FTIR spectra of (A) the pristine as-prepared HA, (B) the HA–PEG composite NPs and (C) the pristine commercial PEG with their different characteristic transmittance (% T) peaks. [Symbols: 1a–7a: belong to HA; 1c–10c: belong to the PEG; the rest of the ‘a′’ or ‘c′’ belong to HA–PEG; molecular OH−: 1a or 1a′; alcoholic OH: 1c or 1c′; symmetric CH2 stretching: 2c or 2c′; CO32− (adsorbed): 2a or 2a′; C–H (i.e., alkane) bending: 3c, 4c, 3c′, or 4c′; symmetric CH2 stretching: 5c, 6c, 5c′, or 6c′; C–O (i.e., alcoholic) stretching and CO–C axial deformation: 7c or 7c′; C–H bending: 8c or 8c′; asymmetric PO43− stretching: 3a or 3a′; PO43− symmetric stretching: 4a or 4a′; CO32− (adsorbed): 5a or 5a′; C–CH aliphatic deformation vibration: 9c or 9c′; PO43− vibration: 6c, 7c, 6c′, or 7c′; C–C vibration: 10c or 10c′]. Note: the significant shifting of OH peak from 3642–3571 cm−1 and from 3480–3365 cm−1 is due to the influence of PEG on the HA molecule in HA–PEG. Similarly, the shift of the C–CH aliphatic deformation vibration peak from 841 to 875 cm−1 is owing to the functionalization effect of HA on the PEG chains in the HA–PEG nanocomposite. | |
3.2. Morphological study
The morphologies of the HA and HA–PEG composite NPs are depicted in Fig. 4 and the insets in Fig. 4a and b show the hierarchical structures of HA and the HA–PEG composite NPs, respectively. Each platelet particle (0.4 × 2.1 × 3.3 μm3) of pristine HA is comprised of needle-like crystals. The needle-shaped HA particles are of an average length of 180 nm (50–250 nm) and width 8 nm (5–12 nm) and were observed in the FESEM study (see inset of Fig. 4a). The PEG layers on the needle-shaped HA particles were distinctly revealed in the HA–PEG composite (see inset Fig. 4b). Each platelet particle of the 0.6 × 3.5 × 4.6 μm3 HA–PEG composite is not only comprised of needle-like HA crystals but is coated with PEG on the outer surface. The platelet particles are arranged uni-directionally in each grain domain (yellow coloured boundary) for the HA–PEG composite. However, the orientations of the platelet particles in different grain domains are in different directions and they are indicated by blue arrows. The different grain domains were developed owing to the PEG polymer, which acted as a heterogeneous nucleation site. The TEM results also strongly supported our FESEM result, indicating that the HA particles (see Fig. 4c) were converted into the nanocomposite and they were seated in the core of the PEG, which acted as the shell (see Fig. 4d). The more dispersed NPs are clearly seen in the inset images of Fig. 4c and d at a lower magnification. It can be seen that the HA–PEG core–shell composite NPs have a better dispersion ability compared to single-phase HA NPs. Moreover, the dispersion of these novel NPs is noticeably better than the other nanomaterial carriers developed in other studies.35 Therefore, HA–PEG core–shell composite NPs would reportedly have better adsorption than bare HA particles to organic molecules and thus to drug molecules.4,16
 |
| Fig. 4 FESEM and TEM of (a and c) the pristine HA and (b and d) HA–PEG core–shell composite nanoparticles, respectively. Note: the insets in (a) and (b) are the hierarchical FESEM structures of HA and the HA–PEG composite NPs, respectively. The orientations of the platelet particles in each different grain domain (marked as yellow coloured boundary) of the HA–PEG composite are in different directions and are indicated by blue arrows in the FESEM image. Each platelet particle in the TEM image is comprised of needle-like HA crystals (yellow-line) for the pristine HA and HA crystals coated with PEG coating extended up to the green-line boundary as an outer shell for the HA–PEG composite. The insets in the TEM images of (c) and (d) depict the dispersion of the HA and HA–PEG composite NPs, respectively. | |
3.3. Electrical analyses
3.3.1. Dielectric studies. Fig. 5 shows the frequency (f) dependent real (ε′) and imaginary (ε′′) parts of the dielectric permittivity (ε) of both the pure HA and the composite HA–PEG core–shell NPs at 25 °C ranging from 100 Hz to 2.5 MHz. The dielectric constant (ε′ = Z′′/ωCo(Z′2 + Z′′2), where Z′ is real impedance, Z′′ is imaginary impedance, Co is free space permittivity, and ω is angular frequency = 2πf) of the HA and HA–PEG core–shell composite NPs decreased with increasing frequency and saturated at higher frequencies. The dielectric loss (ε′′ = Z′/ωCo(Z′2 + Z′′2)) of the composites also follows a similar trend with frequency as ε′. The polarized structure of the material and the associated mobile charge-carriers might be the major cause for the reduced nature of the relative dielectric permittivity.36 Various other possible mechanisms for polarization of a dielectric material could be interfacial space charge polarization, dipolar orientation, ionic, atomic and electronic polarizations.37 Dielectric permittivity of both the materials (i.e., HA and the HA–PEG composite NPs) exhibited a strong frequency dependence behaviour in the low frequency zone, but in the high frequency region, they showed almost frequency independent characteristics.
 |
| Fig. 5 Variations in real (ε′) and imaginary (ε′′) parts of the dielectric constants of HA and the HA–PEG core–shell NPs at 25 °C with frequency. Note: inset plots for HA and HA–PEG represent the slopes or decreasing rates in dielectric constants of −83.3 and −23.8, respectively, from ε′ vs. f plots and −4022.9 and −422.6, respectively, from ε′′ vs. f plots. The noticeably lower decreasing rate in HA–PEG materials indicates the polarization effect of PEG on the HA NPs surfaces. | |
The ε′ attained a higher value at low frequency and decayed exponentially with an increase in frequency. At low frequency (0.1–1 kHz), the dielectric properties of the pure HA and HA–PEG core–shell composite NPs were attributed to the interfacial space charge polarization or Maxwell–Wagner–Sillars effect38 owing to the hindering effect of mobile charge-carriers at the interfaces. Having a crystalline ionic structure, polarization of HA depends on the sequential arrangement and proper displacement of polar hydroxyl (OH−) ions.39 The hopping of H+ or OH− ions as charge-carriers inside a crystal may play a vital role in the polarization the compound. Here, OH− ions as the main charge-carrier in HA play a key role in the reduction of dielectric behaviour.40 At a lower frequency range when an external electric field was applied to the samples, the charge-carriers from impurities, porosity or the grain structure of the composites were moved and accumulated at the interfaces of the HA core and PEG shell in the HA–PEG composite. As a result, a space charge polarization had taken place by enhancing the space charge and charge density at the interface of the HA grains, the interface of the HA core and PEG shell, and the interface of the HA–PEG inter particles of the HA–PEG composite NPs. The accumulated space charges at the interface may lead to a strong Maxwell–Wagner interfacial polarization which can align with the rapidly varying applied external electric field.41 This space charge plays a key role in the large differences in electrical permittivity and conductivity of the HA–PEG composite as well as pure HA. However, the dielectric values of the components decreased with rising frequency. This reduction in dielectric constant with frequency is due to the dipole relaxation of both the compositions.42 The dipole orientation of the hydroxyl (OH−) ions may also play a significant role in the modification of the dielectric behaviour of HA with increasing frequency.43 The orientation of the hydroxyl (OH−) ions can be changed through surface treatment with the PEG polymer. The hydroxyl OH band has also been confirmed using our FTIR study (see Fig. 3) in the HA–PEG sample. This dielectric behaviour indicates the relaxation of interfacial or space charge polarization in both the samples. In another mechanism, the reduction in dielectric permittivity at a higher frequency range was observed because the charge-carriers (OH−) or induced dipoles cannot change their orientation so fast in the direction of the applied electric field.44 As a result, the mobility of ionic or electronic movements due to the external applied field failed to follow the desired momentum with increasing frequency and could not change completely in parallel with the response to the applied electric field. Hence, a limited response of charge-carriers was observed with the applied electric field and it triggered a terminated polarization of the material by limiting the space charge, and consequently, the decreasing of the dielectric constant.
Fig. 5 also clearly revealed that at a low frequency range, the dielectric constants of pure HA were higher than those of the HA–PEG nanocomposites. The impairment in the dielectric constants of the HA–PEG nanocomposites may arise owing to its interfacial effect.45 For instance, the dielectric constant (ε′) value of the HA–PEG composite was 90.79 at a frequency of 0.1 kHz, representing a significant impairment with respect to pure HA (i.e., ε′ = 271.55) at the same frequency. In this context, ε′ of the present pristine HA NPs was significantly higher than that of conventional HA. Therefore, it is clear that the interfacial polarization of pure HA is decreased in the PEG coated core–shell (HA–PEG) nanocomposites. Contiguous adhesion of PEG on the surface of HA particles might cause a more rapid reduction in dielectric constants compared to the pure HA sample, as observed at low frequency. This phenomenon indicates that the number of charge-carriers is reduced due to the removal of unbonded or loosely bonded charge-carriers from the HA NP surface during the adhesion of PEG on the surface of the HA NPs and hence, extends the accumulation process requirements.46 Consequently, the remaining intercalated charge-carriers needed to have a significantly longer time to migrate, compile and bind themselves inside the interfaces of the HA–PEG composites.46,47 Therefore, at the initial stages of frequency (0.1–15 kHz), the above triggers to reduce interfacial space charge polarization and minimize the dielectric constants in the HA–PEG composite NPs compared to pure HA. Another reason for the lower dielectric constants in the HA–PEG composite NPs compared to pure HA particles might be due to reduced differences in the electrical conductivity between PEG and HA, the charge-carriers from the electrode and the composite NPs could not migrate or accumulate at the interface between the PEG and HA particles.46 Unlike other dielectric materials, the present HA and HA–PEG composites showed very high ε′′ compared to ε′. However, the rate change in ε′ and ε′′ of the dielectric permittivity was almost the same in the higher frequency region, above 15 kHz for both the samples, because of the relaxation in polarization processes involved at the measured higher frequency range. The frequency independent response of the dielectric constant with further increase of frequency might be due to the significant contribution of electronic as well as ionic polarization.48 Our results showed that the ε′ and ε′′ of HA were decreased drastically with increasing frequency up to 15 kHz and 1 kHz, respectively. In the case of the HA–PEG composite NPs, the decreasing rate of ε′ (i.e., −83.3 and −23.8 for HA and HA–PEG, respectively) and ε′′ (i.e., −4022.9 and −422.6, respectively) was very low in comparison with pure HA in the same frequency range (Fig. 5). The dielectric constants of HA were found to be 271.55 at 0.1 kHz to 55.86 at 15 kHz, and in the case of the HA–PEG composite NPs, ε′ values were 90.79 at 0.1 kHz to 40.39 at 15 kHz. Therefore, this indicates that the functionalization of 5 wt% PEG polymer to HA NPs has a significant effect on the change in dielectric constants in both low and high frequencies. In the present study, the induction of functionally bound PEG of a lower density (1.1 g cm−3) might increase the interfacial area of the HA NPs per unit volume by modifying the conjugation between neighbouring grains.4 The broadening of the interfacial area (see Fig. 4) also intensified the possibility of effective interaction among the grains of the NPs along with reduction of the interparticle distance.47 Since the surface area of the interfaces between the NPs increased after the imparting of PEG (see FESEM or TEM images in Fig. 4b and d), it forced more charge-carriers and mobile ions to be under immobile conditions at the interface of HA and PEG.49 This phenomenon induces a strengthening of the average interfacial or space charge polarization in HA–PEG composite NPs in comparison with the pristine HA material.46 In this context, moderate interface exchange coupling effects (another powerful phenomenon) are significantly responsible for keeping dielectric values constant after an abrupt downfall. This occurred owing to the observation of a convincing impact over the coupling effect in the improvement of polarization besides interfacial polarization effects in these composite NPs. Since the particle size of HA in the HA–PEG composite was in the nanoscale, its exchange length would expectedly be low. This could help significantly to reduce the falling rate of the dielectric values and maintain a constant value in the higher frequency range (i.e., beyond 15 kHz) probably due to the exchange coupling effect at the near-interface region based on the theoretical model proposed by Li et al., 2003.45 Although an overall polarization of pristine HA was found to be higher than for the HA–PEG composite, a sudden decrease in ε′ values of pure HA rather than HA–PEG suggests that the surface of the HA NPs were modified through the functionalization with PEG polymer. The polarized surface of the composite NPs could enhance the interaction with surrounding entities, such as the medium, drug molecules, and so on. As a result, the loaded drug could easily be captured and safely reach the target while some interactions of carrier particles would involve the surrounding medium. Therefore, it has been confirmed that the amount of interactions within the HA–PEG composite NPs is significantly high compared to the intra-particle interactions of the pristine HA NPs. It suggests that the large intra-particle interactions in the composite NPs will hinder the interactions between the surrounding entities of the delivery paths and the drugs to maintain the controlled release of a drug.
On the other hand, since PEG is a highly insulating polymer,49 it could provide an insulation shell over the polarized surface of the HA NPs and facilitate a potent shielding in order to minimize the rate of decrement in dielectric constant up to 15 kHz at a lower frequency range by nullifying the polarization of the HA NPs. Another reason might be attributed to the ferroelectric behaviour of HA.50 Due to having ferroelectric polarization, complex dielectric permittivity phenomena can be explained through Koop’s theory of dielectrics corresponding to the Maxwell–Wagner approaches.51 According to this Koop’s model, the grain boundaries are highly insulating compared to the grains, would be more active at the initial frequency resulting in a higher dielectric behaviour for the pristine HA NPs compared to the HA–PEG core–shell particles. However, dielectric values of the HA NPs decreased drastically (e.g., ε′ changes from 271.55 at 0.1 kHz to 55.86 at 15 kHz) with increasing frequencies (up to 15 kHz) and this might be due to the significant effect of the highly conducting grains present in the HA NPs according to Koop’s model.
Unlike pure HA, no such change in the ε′ value of HA–PEG was observed at the initial frequency (ε′ = 90.79 at 0.1 kHz) compared to beyond 15 kHz (ε′ = 40.39). This was obtained owing to the broadening of the interfacial area by increasing the grain size of the HA NPs with the defused PEG in the HA–PEG composite. This effect strongly insists the probability of a contraction of the grain boundaries, as seen in the HA–PEG composite NPs (see the micrographs in Fig. 4b and d). The broadening of the grains along with the narrowing of grain boundaries would also be confirmed by Cole–Cole plots of the impedance spectroscopy study. Therefore, the above discussions confirmed that broadening of grain size would help to increase interfacial space charge polarization of the HA–PEG composite NPs through its extended interfacial area and to keep constant in the dielectric constants in the higher frequency range (beyond 15 kHz) following a drastic change in dielectric constants at lower frequencies up to 15 kHz. On the other hand, only ionic polarization played a significant role in the pristine HA. Moreover, another reason for the obtained dielectric behaviour of the HA–PEG is due to the adhering of highly insulating PEG polymers with lower insulating or comparatively conducting grains of HA NPs. This incorporation reduced the conduction behaviour of the HA grains with increasing frequency. As a result, at higher frequencies, almost a flat ε′ curve of HA–PEG core–shell NPs was observed (Fig. 5). The present results almost resemble the previous studies.2,25
3.3.2. Dielectric loss factor and capacitance analyses. Fig. 6 reveals the variation of dielectric loss factor (tan
δ = ε′′/ε′) of both HA and the HA–PEG core–shell composite NPs at 25 °C with applied frequency. Fig. 6 reveals that tan
δ values significantly satisfy the normal phenomenon of dielectric behaviour. The rate of rapid reduction in tan
δ was seen at a lower frequency range, while gradual reduction or almost frequency independent was noticed in the higher frequency region. This tan
δ behavior is associated with the dipolar or interfacial space charge relaxation effects and follows relaxation phenomena of dielectric constants (ε′) (see Fig. 5). The tan
δ behaviour at low frequency indicates a long range intermolecular hopping of electrons52 due to the strong effect of highly resistive grain boundary, leading to the more energy loss. Loss factor (tan
δ) decreases with increasing frequency. For this, charge-carrier hopping is less due to the effect of conducting grains of the materials.53 At low frequency, the tan
δ value of the HA–PEG composite NPs was lower compared with pure HA NPs due to the insulating shielding of the PEG polymer matrix over the HA grains, as found in the dielectric studies. The decreasing trends in frequency dependent capacitance (C(ω)) values (C(ω) = εoε′A/t,2 where A and t are cross-sectional area and thickness of the pellet specimens, respectively) also significantly supports our dielectric results, as depicted in Fig. 6. The similar decreasing rate in capacitance values with the dielectric constants indicates that the charge storing capacity of the HA–PEG composite NPs has improved significantly compared to pristine HA.
 |
| Fig. 6 Variations in dielectric loss factor (tan δ) and capacitance (C, pF) of HA and the HA–PEG core–shell NPs at 25 °C with frequency. Note: rapid reduction rate in tan δ in the lower frequency range and almost frequency independent in the higher frequency region indicates the dipolar or interfacial space charge relaxation effects. Capacitance plots indicate that the charge storing capacity of the HA–PEG composite NPs has improved significantly compared to the pristine HA NPs. | |
3.3.3. Impedance spectroscopy study. Fig. 7 depicts the impedance spectroscopy measurements for HA and the HA–PEG core–shell NPs at 25 °C. The Cole–Cole curves of the impedance plot from the real part (Z′) vs. the imaginary part (Z′′) of the impedance indicates the effects of the grains and grain boundaries on the conduction behaviour of the materials. In the high frequency region, the presence of bulk resistance was confirmed from the semicircular nature of the Cole–Cole plots, which consolidate at the Z′-axis for HA and the HA–PEG core–shell NPs. However, both the plots did not show any neck, plateau or second semicircle, which are generally found in sintered materials,25 indicating the insignificant existence of grain boundary resistance in the materials similar to other studies.54 However, the presence of grain boundaries in the materials was found in the microscopic studies as indicated in Fig. 4b of the HA–PEG core–shell composite nanoparticles although grain boundaries have been found in both the materials in the TEM study (see Fig. 4c and d). In this context, Gittings et al., 2009 could not confirm about the grain boundary formation in their sintered materials from the impedance Cole–Cole plots.25 Additionally, the present impedance Cole–Cole plots clearly revealed an enhancement of the diameter of the semicircle of the HA–PEG core–shell composite nanoparticles in comparison with the semicircle for bare HA NPs after the addition of PEG. It signifies the enhancement of resistance, ensures a decrease in conductivity of the HA–PEG composite NPs compared with pure HA NPs54 and also indicates the enhancement in interfacial polarization. Hence, the Cole–Cole plots significantly endorsed the approaches of dielectric as well as AC conductivity behaviours of the materials.
 |
| Fig. 7 Variation of the Cole–Cole plot of HA and the HA–PEG core–shell NPs at 25 °C with frequency. Note: the impedance property indicates the effect of grains and grain boundaries on the conduction properties of the materials. These Cole–Cole plots show a larger diameter semicircle in the HA–PEG core–shell composite than that of the pristine HA NPs. It implies the improved electrical resistance in the HA–PEG composite NPs compared to pure HA NPs. | |
3.3.4. Electric modulus study. The dielectric modulus and loss modulus characteristics of both the materials are depicted in Fig. 8. Space charge relaxation phenomena and interfacial polarization of the materials can be explained via complex electric modulus or complex dielectric modulus formalism using an alternative approach based on polarization analysis. The complex electric modulus (M*) have usually been derived from the impedance data following the eqn (2):55 |
M* = M′ + jM′′ = 1/ε* = jωεoZ*
| (2) |
where, εo is free space permittivity (8.854 × 10⁻¹² F m−1), ε* is the frequency dependent complex permittivity of the material, electric storage modulus, M′ = ωCoZ′′, electric loss modulus, M′′ = ωCoZ′, j = √(−1), and Z* is the complex impedance. The greater electric modulus value in the HA–PEG composite NPs indicates more interfacial polarization, a long-range conduction process, a dipole relaxation process and bulk relaxation properties rather than space charge injection and absorbed impurity conduction within the large mass of the material compared to pristine HA.56 Fig. 8 depicts the variations of both M′ and M′′ with frequency for HA and the HA–PEG NPs. At low frequency, the plot of M′ depicts the value that is almost zero. However, in the higher frequency region, a continuous growth following saturation near 1 MHz in modulus behaviour was observed. This phenomenon can be attributed to the movement of charge-carriers in a short range. This kind of behaviour might be observed due to an insufficient restoring force under an applied electric field which controls the movement of the charge-carriers. The maximum value or peak shift of M′′ (M′′max) vs. frequency of the HA–PEG composites had been observed in the direction of the lower frequency region compared with pure HA. It can therefore be inferred that the activation of spectral intensity of the dielectric relaxation is due to a hopping mechanism of charge-carriers and intrinsic commanding of small polarons (i.e., a combination of charge-carriers and a surrounding polarization). It is possible when a charge-carrier is placed into a solid grain, the surrounding ions of that grain can interact with the oppositely charged carriers to adjust their regular places. This adjustment of the ionic positions creates a polarization locally centred on the charge-carrier. It would be extremely important to carry the organic drug molecules or ionic crystals using van der Waals rather than covalent bonding. Thus, the loaded drug can easily be bound and safely released at the target organs, which is a supportive result of our previously discussed dielectric constant study. In comparison with HA, less hopping of charge-carriers is found in the HA–PEG composites, significantly indicating a decrease of conduction efficiency. However, the obtained peak shapes of the M′′ curves resembled an asymmetric nature. Thereby, this would imply that the relaxation process is non-Debye type in the pristine HA, corresponding to the stated analysed impedance result.
 |
| Fig. 8 Variations in the real (M′) and imaginary (M′′) parts of the dielectric modulus of HA and the HA–PEG core–shell NPs at 25 °C with frequency. Note: M′ characteristic attributed to the movement of charge-carrier in a short range is found due to an insufficient restoring force under an applied electric field which controls the movement of the charge-carriers. The asymmetric nature M′′ curve implies the non-Debye type relaxation process present in the pristine HA. The greater electric modulus value in the HA–PEG composite NPs indicates more interfacial polarization, long-range conduction process, dipole relaxation process and bulk relaxation properties rather than space charge injection, and absorbed impurity conduction within the large mass of the material compared to pristine HA. | |
3.3.5. AC conductivity (σac). Fig. 9 shows the frequency dependence σac (Ω−1 m−1 or S m−1) of the HA compound and HA–PEG composites at 25 °C. Measurement of σac (σac = ωεoε′
tan
δ)57 is more convenient for having a better understanding of the conduction mechanism and movement of the charge-carriers inside the materials. The vibrational mode and hopping of the ions provides a typical ionic conductivity behaviour to the apatite based materials.25,58 At low frequencies (<15 kHz), the conductivity of HA and the HA–PEG composite seemed to remain constant due to band conduction and it mainly possessed a frequency independent direct current (DC) conductivity (σdc) in nature.59 The σdc can be related to σac using the universal power law, σT(ω) = σdc + aωn, where σT(ω) is the total frequency dependent σac, ‘a’ and ‘n’ are constants which depend on frequency and composition.60 Constant plateau zonal effect in σdc was revealed at low frequency because of the powerful impact of grain boundaries, which had a high resistivity. Due to the long range transport of charge-carriers in between the grains of a material, conduction behaviour of the material was found to be almost constant in the low frequency range. According to universal dielectric behaviour, a gradual enhancement in conductivity of both the samples with increasing frequency was observed. This type of behaviour mainly followed relaxation of a mobile ion hopping mechanism that could be noticed among electrons, holes or ions for pursuing multiple valance state based on Jonscher’s power law, σac ∝ ωn, where n is weakly frequency dependent constant.61 In addition, highly conductive grains were more active in the high frequency region (>15 kHz) rather than at the highly resistive grain boundary. This was significantly responsible for the enhancement of the conduction behaviour of the material.62 A small polaron hopping is responsible for the enhancement of σac corresponding to the short range transport of charge-carriers inside the grains of a material. Thereby, at higher frequencies, less energy is required for accelerating the mobile charge-carriers (e.g., electrons, holes or ions) in the conducting grain. Electrical conductivity in HA typically depends on its hydroxyl (OH−) ions with mobility along the channels in the c-axis.25,58,63,64 Spontaneous polarization is significantly observed due to smooth channelizing of protons (H+) across the OH− channels in the HA crystals, this makes it a good polarizing material.43,65 Here, ionic conduction behaviour in HA takes place either due to hopping of H+, OH− ions or possibly conduction through O2−.64 The conductive nature of HA depends on the mobility of polarized surface ions, originating from the diffusion of OH− ions along the c-axis channels, resulting in enhancement of interaction among surrounding objects.
 |
| Fig. 9 Variation of the AC conductivity (σac) of HA and the HA–PEG core–shell NPs at 25 °C with frequency. Note: the reduced conduction properties of HA–PEG may cause interactions between the PEG polymer and the HA NPs by decreasing the interaction with surrounding entities. It is a result of the enhanced interfacial or space charge and dipolar polarizations inside the HA–PEG composite NPs, which broadened the interfacial area along with minimized inter-particle distances. The novel technique can void the interaction of materials with surrounding entities for accelerating the controlled delivery for targeting drug delivery applications. | |
(I) In the case of proton hopping, it may occur along the c-axis between the OH− ions,66 reaction (iii)
|
OH− + OH− ↔ O2− + HOH
| (iii) |
(II) In the case of OH− conduction, in the vacancies of OH− ions depicted in (■), reaction (iv)64
|
Ca10(PO4)6(OH)2 → Ca10(PO4)6(OH)2−2xOx(■)x + xH2O(g)↑ (x < 1)
| (iv) |
(III) Conduction at OH− ions interacting with the O2− of the PO4 groups, reaction (v)66
|
2OH− + PO43− → O2− + HPO42− + OH → O2− + PO43− + HOH + ■OH−
| (v) |
Conduction in pure HA might take place either through the movement of H+ ions in adsorbed water at room temperature or due to the vacancies of OH− ions during periods of dehydration that provide more conduction of OH− ions and hinder the conduction of H+ ions.67 However, this kind of ionic surface is not desired for the controlled release of a drug. The variation of σac at 25 °C is signified. It was found to be 5.25 × 10⁻⁵ and 2.76 × 10⁻⁴ S m−1 at 30 kHz and 2.5 MHz, respectively for HA whereas in case of HA–PEG, σac was 1.33 × 10⁻⁵ and 1.11 × 10⁻⁴ S m−1 at 30 kHz and 2.5 MHz, respectively. Therefore, this result confirmed that conductivity of HA NPs was more than the HA–PEG nanocomposites. Significant activity of the conducting grains was clearly observed in case of the HA NPs at 30 kHz and 2.5 MHz. In the case of the HA–PEG nanocomposites, no such significant increment was noticed with increasing frequency especially at 30 kHz and 2.5 MHz. Since the grain boundaries are highly insulating and more active compared to the grains at low frequencies, the conductivities in the HA–PEG nanocomposite are significantly (order of value) lower compared to the pristine HA NPs. Therefore, induction of the PEG polymer in the HA NPs contributes a major impact on the broadening of grains growth due to the synthesis technique. Further, there is a possibility for increasing hopping of charge-carriers besides larger grain size that leads to the reduction in number of grain boundaries.68 It has been observed that the conductivity of pristine HA NPs was found to decrease after with the developing the PEG coated HA core–shell nanocomposite NPs. Since it is well known69 that PEG itself is a highly insulating polymer, its induction into the HA nanocrystals reduces the conduction ability of the grains by decreasing the mobility of the charge-carriers, resulting in the reduction of the polarization behaviour of the nanocomposites among surrounding objects as depicted in Fig. 9.
Due to the saturation of charge-carriers at the interface, interfacial or space charge polarization tends to be increased inside composites besides the broadening of interfacial area owing to grain growth. The enhancement in interfacial or space charge polarization at a higher frequency regime was found to prevent dielectric permittivity of the HA–PEG composites from abrupt downfall, as depicted in Fig. 5. This led to an increase in the interaction in the composite NPs themselves. Therefore, it can be inferred that the enhanced interfacial or space charge and dipolar polarizations inside the HA–PEG composite NPs broadened the interfacial area along with the minimization of inter-particle distance. It further reduced the conduction properties and might cause interactions between the PEG polymer and the HA NPs besides decreasing interactions among the surrounding entities. This phenomenon has revealed a novel way of avoiding interaction of materials with surrounding objects for accelerating the controlled delivery of a drug for targeting drug delivery applications.
3.4. In vitro drug release kinetic study
The water soluble drug carrying ability and drug releasing mechanism have been investigated through an in vitro drug release kinetic assay similar to our previous report.28 The UV-vis absorption of a known concentration of AF drug (see Fig. 10A) was used as a standard plot to evaluate the concentration of the released drug from the carrier HA and the HA–PEG composite NPs. The in vitro drug release (%) was measured by employing concentration of the drug (Ct) in mg mL−1 present in the solution at a measured time point (t) with respect to the initial concentration (Co) used at time t = 0. At 20 and 60 min the amount of released drug is 49.8 and 62.6%, respectively for the HA carrier (plot-‘a’ in Fig. 10B) and 58.9 and 77.8%, respectively for the HA–PEG composite carrier (plot-‘b’ in Fig. 10B). The higher amount of drug can be released to the target by the HA–PEG composite carrier easily which is extremely important for nonsteroidal anti-inflammatory drugs (NSAIDs) such as AF particularly for topical applications.
 |
| Fig. 10 (A) Absorbance with unknown concentration of aceclofenac (AF) drug due to releasing by (a) HA and (b) the HA–PEG composite NPs determined from the (c) absorbance with a known concentration AF drug with surface modified using chloroform in PBS solution at their maxima of wavelength, λmax ≅ 276 nm. (B) In vitro AF drug released behaviour of (a) HA drug and (b) drug loaded-HA–PEG composite NPs in PBS solution. Note: amount of drug release of the HA–PEG core–shell composites NPs is better than HA NPs. | |
The higher amount of released drug indicates that the amount of drug carrying capacity is greater for the porous HA–PEG composites compared to HA NPs and it is significantly larger than the other study.70 The drug release mechanism is determined using a kinetic study using two different model equations eqn (3) and (4).71
|
Zero order model: Mt/Mo = Kot
| (3) |
|
First order model: ln(Mt/Mo) = K1t
| (4) |
The fitted data of zero order and first order model equations are depicted in Fig. 11. The zero order kinetics depend on the ratio of drug amount (Mt) present in the solution at a measured time, t, to the initial amount (mg) of drug (Mo) whereas “first order kinetic” depends on the logarithm of ratio of Mt to Mo. It indicates that NSAIDs such as AF can effectively be delivered by the HA–PEG composite compared to pristine HA for transdermal drug delivery applications.72 The linear correlation coefficient or regression value (R2) closer to 1 in the “zero order kinetic” (R2 = 0.9945 for HA and R2 = 0.9960 for HA–PEG) indicates a better possibility of the predicted mechanism compared to the “first order kinetic” (R2 = 0.7306 for HA and R2 = 0.7600 for HA–PEG).28 Therefore, the water soluble drugs such as AF can also be carried by the porous HA–PEG composite NPs compared for gastrointestinal (GI) tract or intravenous (IV) drug delivery applications.73 The result implies that this kinetic mechanism is more prone to be process independent.71
 |
| Fig. 11 Drug release kinetics of the AF drug loaded on (a) HA and (b) the HA–PEG core–shell composite NPs in PBS solution with incubation time employing “zero order” (Mt/Mo vs. t) and “first order” (ln(Mt/Mo vs. t)) models. Note: the regression (R2) values closer to 1 in the HA–PEG composite for both the models indicates the process independent kinetic mechanism. | |
3.5. Drug–carrier interaction particle morphology
The interaction between the drug and carrier particles has been observed using an FESEM study. Since more dispersion might interrupt the drug–NPs interaction, the SEM samples were prepared without much dispersion in isopropanol. The morphologies of the drug loaded HA and HA–PEG composite NPs carriers are depicted in Fig. 12a and b, respectively. It reveals that the AF drug particles are found to be seated mostly on the surface, whereas the AF particles are inducted not only at the surface but also in the pores. It seems that the HA–PEG composite carrier particles can easily pass the drug particles through its porous structures without much interacting on the drug surface.
 |
| Fig. 12 FESEM morphologies of the AF drug loaded (a) pristine HA and (b) HA–PEG core–shell composite NPs. Note: the horizontal (black) arrows indicate the HA or HA–PEG composite particles and vertical (blue) arrows indicate the drug particles. | |
3.6. In vitro biocompatibility study on HDF cells
Particle dispersion in PBS and cell DMEM solutions was analysed to compare the HDF cell attachment or cell uptake and lysosomal in the HA–PEG composite with HA NPs (see Fig. 13). The optical images revealed that the dispersed platelet particle size of HA (Fig. 13a – in PBS and Fig. 13c – in DMEM) and HA–PEG (Fig. 13b – in PBS and Fig. 13d – in DMEM) were found to be 0.3–4 μm (average size 0.62 μm) and 0.2–2.5 μm (average size 0.48 μm), respectively. It indicates that the HA–PEG particle can be more easily broken or degradable under vigorous dispersal conditions. The cell uptake and lysosomal escape were revealed in the HA–PEG nanoparticles (Fig. 13d) with the HDF cells, whereas no cell attachment were found in the pristine HA particle (Fig. 13c).
 |
| Fig. 13 Optical images of the dispersed HA & HA–PEG particles in PBS (a & b, respectively) and DMEM cell culture (c & d, respectively) solutions. Note: the dispersed platelet particle sizes of HA (a – in PBS & c – in DMEM) and HA–PEG (b – in PBS & d – in DMEM) are 0.3–4 μm and 0.2–2.5 μm, respectively. The particles and cells are indicated using yellow and green colour arrows, respectively. The cell uptake and lysosomal escape are there in the HA–PEG nanoparticles (d) with the cells, whereas no cell attachment is there with pristine HA particles (c). | |
In vitro biocompatibility of the drug carriers on the HDF cells was quantitatively evaluated using an Alamar blue assay as depicted in Fig. 14. It demonstrates the cell metabolic activity and cell proliferation using the detection of mitochondrial activity. In this study, cell metabolic activity of HDF cells has been observed by culturing them on the surface of HA NPs and HA–PEG core–shell nanocarrier scaffolds for up to 7 days. Our data shows that cellular growth of HDF cells on the nanocarriers was significantly **(p < 0.0001) and *(p < 0.05) increased with increasing time periods from day-1 to day-7 (see Fig. 14A) for all the samples. The relative cell proliferation (%) through AB by living HDF cells with increasing time periods is found to be compatible with the cell proliferation for all the samples as depicted in (Fig. 14B) and also indicative towards large numbers of cell proliferation. Since the cell proliferation and relative cell proliferation via the AB assay resembled other studies,4 the biocompatibility of the newly developed drug carriers on HDF cells are significantly good. Hence, this result suggests that incorporation of PEG with HA NPs significantly improved the cytocompatibility and the live-cellular activity of both the HA and HA–PEG based nanocarrier scaffolds on HDF cells is nontoxic.
 |
| Fig. 14 (A) Cell proliferation rate of all the samples and (B) relative cell proliferation of HA and HA–PEG core–shell nanocarriers with respect to positive control (Thermanox) on human dermal fibroblast (HDF) cells at day-1, day-3 and day-7 respectively. Note: the error bars represent the standard deviation from the mean for each sample (n = 5). Asterisk (*) signs indicate statistically higher significant **(p < 0.0001) and also significant *(p < 0.05). | |
An alternative method of quantitative analysis was employed using a DNA assay for 1, 3 and 7 days on HDF cells seeded on the nanocarrier scaffolds to determine the cell proliferation to prove their biocompatibility. In contrast to the AB assay, the DNA study gives total DNA from the live and dead cells. Fig. 15 represents the DNA quantification and depicts the HDF cells culture proliferation status of the scaffolds showing highly significant (n = 5, p < 0.0001) increased numbers of total DNA with time points 1, 3 and 7 days. This result clearly indicates the existence of more proliferated cells with their consistent growth noticed among all the samples. Both the samples showed better cell proliferation than the control, a special Thermanox plastic sheet, owing to the porous nature of the HA and HA–PEG nanocarrier scaffolds. It is highest for the HA–PEG core–shell nanocarrier scaffolds. It agreed with the previous AB assay result and showed significant cell proliferation and growth features of the HDF cells. Therefore, the DNA quantification results indicate the in vitro biocompatibility of our newly designed nanocarrier samples.
 |
| Fig. 15 DNA quantification assay of HA and HA–PEG core–shell nanocarriers and a positive control (Thermanox) using human dermal fibroblast (HDF) cells at day-1, day-3 and day-7 respectively. Note: results are the mean ± standard deviation. The error bars represent the standard deviation from the mean for each sample (n = 5). Total number of DNA is more significantly (p < 0.0001) increased with increasing the time periods from day-1 to day-7 for all samples. | |
Fig. 16 depicts the qualitative evaluation using a live/dead cell assay studied with HDF cells on the surface of the HA and HA–PEG nanocarriers to reconfirm their biocompatibility and cytocompatibility. Green colour stained with calcein-AM indicates the presence of live cells and red colour stained with ethidium-bromide homodimer confirms the existence of dead cells. Fluorescence images of the live/dead staining of HDF cells on the different compositions of the HA based nanocarriers is depicted in Fig. 16, which supports the cell proliferation results via the AB and DNA quantification assays. In Fig. 16, the 1st, 2nd, and 3rd columns represent the images of the control, HA and HA–PEG scaffolds, respectively and the 1st, 2nd, and 3rd rows represent the images for day-1, day-3, and day-7, respectively. Here, the number of live (green) cells present in the HA and HA–PEG nanocarriers was increasing with increasing time. It was found that on day-3, the cell density was slightly lower compared to day-1 because of the growth of HDF cell size. The tiny green live cells were also found along with larger cells. The number of live cells was also found to increase on day-7 and it is highest for the HA–PEG core–shell nanocarrier scaffolds. It evidently indicates the excellent biocompatibility of this nanocomposite carrier with the HDF cells. In addition, it implies the biodegradable nature of our selected polymer (PEG), which is functionally bonded with HA and forms a hydrated layer on the ceramic surfaces.
 |
| Fig. 16 Live/dead cell confocal microscopic images of the HA and HA–PEG core–shell nanocarriers and a positive control (Thermanox) on human dermal fibroblast (HDF) cells at day-1, day-3 and day-7 respectively. Note: vertical columns from left to right represent the samples: control, HA and HA–PEG and horizontal rows from top to bottom indicates the time points: day-1, day-3, and day-7. | |
3.7. A controlled drug release mechanism of dielectric core–shell composite
The intra-particle interfacial interaction and interfacial space charge polarization had been found to enhance interaction of HA–PEG composite NPs. The enhanced intra-particular interaction due to grain growth as well as narrowing of the grain boundaries in between the PEG polymer and the HA ceramic NPs could facilitate a reduced interaction with the surrounding matter. It further ensures a smooth and controlled release of the drug from the HA–PEG core–shell NPs (see Fig. 17).
 |
| Fig. 17 Dielectric constant and drug carrying capacity of the AF drug loaded (A) HA and (B) HA–PEG core–shell composite NPs in PBS solution as a drug delivery surrounding media. Note: rate of decrement in dielectric constant with increasing of frequency is significantly lower in HA–PEG NPs compared to HA NPs. Further, drug particles are only carried via pores in pristine HA, whereas in the case of the pristine HA–PEG composite NPs, the AF drug particles are not only integrated in the pores but also at the particle surfaces. Thus, HA–PEG NPs carry larger amounts of drug while the biodegradable PEGylated molecules of the shell neutralize the surrounding’s positively charged environments. It minimizes the direct interaction between the drug molecules and biomolecules on the delivery paths and hence, delivers larger amounts of the drug to the target site with controlled release. Therefore, number of released drug (●) particles are greater for HA (A) and are much less for HA–PEG core–shell composite NPs (B) in the delivery path. | |
Fig. 17 represents a mechanism model study of the influence of the dielectric behaviours and surface characteristics of the core–shell particles on controlled AF drug release capacity. In the case of pristine HA, the AF drug particles were only carried through pores, whereas for the pristine HA–PEG composite NPs, the AF particles were not only integrated in the pores but also at the particle surfaces. Thus, the HA–PEG NPs could have the capability of carrying larger amounts of drug compared to the HA NPs. At the same time, the biodegradable PEG molecules of the shell neutralized the surrounding’s positively charged environments, such as albumins,74 through PEGylation. In PEGylation, the PEG-layer could reduce the effective number of the terminal groups via entanglement of the chains, and hence it reduces the apparent charge of the surroundings.75 As a result, it minimized the direct interaction between the drug molecules and biomolecules on the delivery paths. Hence, the HA–PEG NP carrier delivered larger amounts of the drug to the target site with controlled release. Therefore, the above combined effects of the HA–PEG core–shell NPs could allow the drug to be released more smoothly at the target site and could help to achieve the desired therapeutic efficacy along with avoiding pre-systemic adsorption of the drug inside the HA–PEG core–shell NPs.
4. Conclusions
The synthetic novel pristine HA and HA–PEG core–shell composite NPs have, for the first time, been characterized through electrical and in vitro kinetic studies for potential drug delivery applications. The structural and morphological properties, studied using XRD, FTIR, FESEM and TEM, confirmed the functionalization between the HA surface and PEG, and a development of a HA–PEG core–shell composite. The controlled electrical parameters, such as decreasing rate of ε′, ε′′, C, tan
δ, M′, M′′, and σac, with the addition of PEG polymer in the HA–PEG composite was found expectedly, as desired for the controlled drug releasing study. The electrical properties indicated a significant decrease in charge-carrier hopping due to the induction of PEG in HA and hence, an increase in the interfacial polarization. The broadening of the interfacial area or polarization in the HA–PEG composite core–shell NPs might be responsible for the initiation of relative interactions between the PEG and HA NPs.47 Therefore, a combined effect of intra-particle interfacial interaction, and interfacial space charge polarization tends to enhance the interactions of the HA–PEG composite NPs. It is supported by a study of Reshmi et al., who stated that the interaction inside a nanocomposite rather than surrounding entities (e.g., drug molecules or biomolecules) should be more desired in an ideal drug carrier for controlled drug delivery.2
Besides controlled release, the porous HA–PEG composite NPs also have the ability to contain a greater amount of water soluble NSAIDs, as it has been found in the drug–carrier morphological study. The AF drug releasing mechanism of the newly developed NPs is process independent. In addition, both HA and the PEG polymer based materials have shown excellent biocompatibility in our previous studies.4,28 The present in vitro cell proliferation study on HDF cells through quantitative and qualitative assays evidently indicate that the HA–PEG core–shell nanocarrier has excellent biocompatibility and the biodegradable polymer (PEG) has no toxic effect despite a degradation from the HA surfaces. Therefore, the present study disclosed a novel HA–PEG core–shell NP, which would be a potential ideal candidate as a novel drug carrier compared with pure HA NPs for controlled drug delivery applications.
In addition, in the near future, this carrier might be used for anticancer drug delivery. The exact mechanism of antitumor activity of this carrier to deliver anticancer agent, such as doxorubicin (DOX), could depend on the selected anticancer cells.76 Nevertheless, the electrostatic interactions of this carrier might inhibit the DNA synthesis in cancer cells by intercalation with the free radicals, which would be responsible for damage to the DNA and cell membrane.77
Acknowledgements
This study was supported by the Postdoctoral research fellowship, IPPP, University of Malaya, Malaysia and UM/MOHE/HIR grant (Project number: D000014-16001).
References
- M. He, Z. Zhao, L. Yin, C. Tang and C. Yin, Int. J. Pharm., 2009, 373, 165–173 CrossRef CAS PubMed.
- G. Reshmi, P. M. Kumar and M. Malathi, Int. J. Pharm., 2009, 365, 131–135 CrossRef CAS PubMed.
- I. Bravo-Osuna, C. Vauthier, H. Chacun and G. Ponchel, Eur. J. Pharm. Biopharm., 2008, 69, 436–444 CrossRef CAS PubMed.
- S. Pramanik, F. Ataollahi, B. Pingguan-Murphy, A. A. Oshkour and N. A. Abu Osman, Sci. Rep., 2015, 5, 9806 CrossRef CAS PubMed.
- M. S. Lavine, Science, 2003, 301, 1633 CrossRef.
- Y. Gu, K. Khor and P. Cheang, Biomaterials, 2003, 24, 1603–1611 CrossRef CAS PubMed.
- G. Wu, B. Su, W. Zhang and C. Wang, Mater. Chem. Phys., 2008, 107, 364–369 CrossRef CAS.
- L. M. Grover, U. Gbureck, A. J. Wright, M. Tremayne and J. E. Barralet, Biomaterials, 2006, 27, 2178–2185 CrossRef CAS PubMed.
- S. Pramanik, B. Pingguan-Murphy, J. Cho and N. A. Abu Osman, Sci. Rep., 2014, 4, 5843 CAS.
- A. Y. P. Mateus, C. C. Barrias, C. Ribeiro, M. P. Ferraz and F. J. Monteiro, J. Biomed. Mater. Res., Part A, 2008, 86, 483–493 CrossRef PubMed.
- S. Deb, J. Giri, S. Dasgupta, D. Datta and D. Bahadur, Bull. Mater. Sci., 2003, 26, 655–660 CrossRef CAS.
- A. L. Rosa, M. M. Beloti and R. van Noort, Dent. Mater., 2003, 19, 768–772 CrossRef CAS PubMed.
- X. Cui, T. Liang, C. Liu, Y. Yuan and J. Qian, Mater. Sci. Eng. C, 2016, 67, 453–460 CrossRef CAS PubMed.
- S. Tarafder, S. Banerjee, A. Bandyopadhyay and S. Bose, Langmuir, 2010, 26, 16625–16629 CrossRef CAS PubMed.
- D. Kumar, J. Gittings, I. G. Turner, C. Bowen, A. Bastida-Hidalgo and S. Cartmell, Acta Biomater., 2010, 6, 1549–1554 CrossRef CAS PubMed.
- K. K. Kar and S. Pramanik, US Pat., US8652373 B2, 2014.
- S. Leprêtre, F. Chai, J.-C. Hornez, G. Vermet, C. Neut, M. Descamps, H. F. Hildebrand and B. Martel, Biomaterials, 2009, 30, 6086–6093 CrossRef PubMed.
- J. Fu, J. Fiegel, E. Krauland and J. Hanes, Biomaterials, 2002, 23, 4425–4433 CrossRef CAS PubMed.
- P. Kim, D. Kim, B. Kim, S. Choi, S. Lee, A. Khademhosseini, R. Langer and K. Suh, Nanotechnology, 2005, 16, 2420 CrossRef CAS PubMed.
- J. M. Harris, Poly(ethylene glycol) chemistry: biotechnical and biomedical applications, Springer Science & Business Media, 2013 Search PubMed.
- A. M. Eckman, E. Tsakalozou, N. Y. Kang, A. Ponta and Y. Bae, Pharm. Res., 2012, 29, 1755–1767 CrossRef CAS PubMed.
- C. R. Martinez, J. R. Vick, O. Perales and S. Singh, NSTI Nanotech., 2011, 3, 420–423 CAS.
- S. Li, Q. Liu, J. Wijn, K. Groot and B. Zhou, J. Mater. Sci. Lett., 1996, 15, 1882–1885 CrossRef CAS.
- F.-W. Huang, H.-Y. Wang, C. Li, H.-F. Wang, Y.-X. Sun, J. Feng, X.-Z. Zhang and R.-X. Zhuo, Acta Biomater., 2010, 6, 4285–4295 CrossRef CAS PubMed.
- J. Gittings, C. R. Bowen, A. C. Dent, I. G. Turner, F. R. Baxter and J. B. Chaudhuri, Acta Biomater., 2009, 5, 743–754 CrossRef CAS PubMed.
- M. Quilitz, K. Steingröver and M. Veith, J. Mater. Sci.: Mater. Med., 2010, 21, 399–405 CrossRef CAS PubMed.
- S. Pramanik and K. K. Kar, Int. J. Adv. Des. Manuf. Technol., 2013, 66, 1181–1189 CrossRef.
- A. Manna, S. Pramanik, A. Tripathy, Z. Radzi, A. Moradi, B. Pingguan-Murphy and N. A. Abu Osman, RSC Adv., 2016, 6, 25549–25561 RSC.
- S. Jana, S. Manna, A. K. Nayak, K. K. Sen and S. K. Basu, Colloids Surf., B, 2014, 114, 36–44 CrossRef CAS PubMed.
- F. Ataollahi, S. Pramanik, A. Moradi, A. Dalilottojari, B. Pingguan-Murphy, W. Abas, W. A. Bakar and A. N. Abu Osman, J. Biomed. Mater. Res., Part A, 2015, 103, 2203–2213 CrossRef CAS PubMed.
- F. Sun and F. H. Froes, J. Alloys Compd., 2002, 340, 220–225 CrossRef CAS.
- B. Nasiri-Tabrizi, B. Pingguan-Murphy, W. J. Basirun and S. Baradaran, J. Ind. Eng. Chem., 2016, 33, 316–325 CrossRef CAS.
- H. Akram, P. Azari, W. Wan Abas, N. Zain, S. Gan, R. Yahya, C. Wong and B. Pingguan-Murphy, Mater. Res. Innovations, 2014, 18, S6-520–S6-524 CrossRef.
- Y. Yajing, D. Qiongqiong, H. Yong, S. Han and X. Pang, Appl. Surf. Sci., 2014, 305, 77–85 CrossRef.
- N. Mhlanga, S. Sinha Ray, Y. Lemmer and J. Wesley-Smith, ACS Appl. Mater. Interfaces, 2015, 7, 22692–22701 CAS.
- A. Singh, S. K. Barik, R. Choudhary and P. Mahapatra, J. Alloys Compd., 2009, 479, 39–42 CrossRef CAS.
- D. Roy, B. Bagchi, S. Das and P. Nandy, Mater. Chem. Phys., 2013, 138, 375–383 CrossRef CAS.
- Z. M. Dang, L. Wang, Y. Yin, Q. Zhang and Q. Q. Lei, Adv. Mater., 2007, 19, 852–857 CrossRef CAS.
- N. Horiuchi, J. Endo, N. Wada, K. Nozaki, M. Nakamura, A. Nagai, K. Katayama and K. Yamashita, J. Appl. Phys., 2013, 113, 134905 CrossRef.
- T. Takahashi, S. Tanase and O. Yamamoto, Electrochim. Acta, 1978, 23, 369–373 CrossRef CAS.
- V. Bobnar, A. Levstik, C. Huang and Q. Zhang, Phys. Rev. Lett., 2004, 92, 047604 CrossRef CAS PubMed.
- D. Wang, W. Goh, M. Ning and C. Ong, Appl. Phys. Lett., 2006, 88, 2907 Search PubMed.
- N. Horiuchi, M. Nakamura, A. Nagai, K. Katayama and K. Yamashita, J. Appl. Phys., 2012, 112, 074901 CrossRef.
- A. Kaya, Ş. Altındal, Y. Ş. Asar and Z. Sönmez, Chin. Phys. Lett., 2013, 30, 017301 CrossRef.
- J. Li, Phys. Rev. Lett., 2003, 90, 217601 CrossRef PubMed.
- Y. Li, X. Huang, Z. Hu, P. Jiang, S. Li and T. Tanaka, ACS Appl. Mater. Interfaces, 2011, 3, 4396–4403 CAS.
- P. Thakur, A. Kool, B. Bagchi, S. Das and P. Nandy, Phys. Chem. Chem. Phys., 2015, 17, 1368–1378 RSC.
- D. Varshney, P. Sharma, S. Satapathy and P. Gupta, J. Alloys Compd., 2014, 584, 232–239 CrossRef CAS.
- D. K. Pradhan, R. Choudhary and B. Samantaray, Mater. Chem. Phys., 2009, 115, 557–561 CrossRef CAS.
- S. Lang, S. Tofail, A. Kholkin, M. Wojtaś, M. Gregor, A. Gandhi, Y. Wang, S. Bauer, M. Krause and A. Plecenik, Sci. Rep., 2013, 3, 2215 CAS.
- C. Koops, Phys. Rev., 1951, 83, 121 CrossRef CAS.
- X. Yang, Q. Wang, Y. Zhang and Z. Jiang, Polym. J., 2012, 44, 1042–1047 CrossRef CAS.
- M. Hashim, S. E. Shirsath, R. Kotnala, S. S. Meena, S. Kumar, A. Roy, R. Jotania, P. Bhatt and R. Kumar, J. Alloys Compd., 2013, 573, 198–204 CrossRef CAS.
- N. Kumari, V. Kumar and S. Singh, J. Alloys Compd., 2015, 622, 628–634 CrossRef CAS.
- S. Sen, P. Pramanik and R. Choudhary, Appl. Phys. A: Mater. Sci. Process., 2006, 82, 549–557 CrossRef CAS.
- B. G. Soares, M. E. Leyva, G. M. Barra and D. Khastgir, Eur. Polym. J., 2006, 42, 676–686 CrossRef CAS.
- N. Kumari, V. Kumar and S. Singh, RSC Adv., 2015, 5, 37925–37934 RSC.
- M. S. Khalil, H. H. Beheri and W. I. A. Fattah, Ceram. Int., 2002, 28, 451–458 CrossRef CAS.
- A. A. El Ata, M. El Nimr, S. Attia, D. El Kony and A. Al-Hammadi, J. Magn. Magn. Mater., 2006, 297, 33–43 CrossRef.
- S. Mohanty and R. Choudhary, J. Electron. Mater., 2015, 44, 1–10 CrossRef.
- A. K. Jonscher, Nature, 1977, 267, 673–679 CrossRef CAS.
- H. Bottger and V. V. Bryksin, Hopping conduction in solids, Akademie-Verlag, Berlin, 1985 Search PubMed.
- B. Singh, A. K. Dubey, S. Kumar, N. Saha, B. Basu and R. Gupta, Mater. Sci. Eng. C, 2011, 31, 1320–1329 CrossRef CAS.
- K. Yamashita, K. Kitagaki and T. Umegaki, J. Am. Ceram. Soc., 1995, 78, 1191–1197 CrossRef CAS.
- D. Liu, K. Savino and M. Z. Yates, Adv. Funct. Mater., 2009, 19, 3941–3947 CrossRef CAS.
- A. Laghzizil, N. Elherch, A. Bouhaouss, G. Lorente, T. Coradin and J. Livage, Mater. Res. Bull., 2001, 36, 953–962 CrossRef CAS.
- H. Owada, H. Nakagawa and T. Umegaki, J. Am. Ceram. Soc., 1986, 69, 590–594 CrossRef.
- R. Devan, Y. Kolekar and B. Chougule, J. Phys.: Condens. Matter, 2006, 18, 9809 CrossRef CAS.
- H. Berney, J. Alderman, W. Lane and J. K. Collins, Sens. Actuators, B, 1997, 44, 578–584 CrossRef CAS.
- P. D. Chaudhari, P. S. Uttekar, U. S. Desai and D. Pawar, Am. J. PharmTech Res., 2013, 3, 877–899 CAS.
- Z. Gu, A. C. Thomas, Z. P. Xu, J. H. Campbell and G. Q. Lu, Chem. Mater., 2008, 20, 3715–3722 CrossRef CAS.
- M. N. Freitas and J. M. Marchetti, Int. J. Pharm., 2005, 295, 201–211 CrossRef CAS PubMed.
- S. A. Bravo, M. C. Lamas and C. J. Salomón, J. Pharm. Pharm. Sci., 2002, 5, 213–219 CAS.
- A. Bonfá, R. S. Saito, R. F. França, B. A. Fonseca and D. F. Petri, Mater. Sci. Eng. C, 2011, 31, 562–566 CrossRef.
- T. Kelf, V. Sreenivasan, J. Sun, E. Kim, E. Goldys and A. Zvyagin, Nanotechnology, 2010, 21, 285105 CrossRef CAS PubMed.
- S. Wang, E. A. Konorev, S. Kotamraju, J. Joseph, S. Kalivendi and B. Kalyanaraman, J. Biol. Chem., 2004, 279, 25535–25543 CrossRef CAS PubMed.
- D. Gewirtz, Biochem. Pharmacol., 1999, 57, 727–741 CrossRef CAS PubMed.
Footnote |
† Electronic supplementary information (ESI) available. See DOI: 10.1039/c6ra21210g |
|
This journal is © The Royal Society of Chemistry 2016 |
Click here to see how this site uses Cookies. View our privacy policy here.