Novel synthetic strategy towards NiO/Ni3N composite hollow nanofibers for superior NOx gas-sensing properties at room temperature

Jiangdong Guo, Ying Yang, Xiangting Dong*, Jinxian Wang, Guixia Liu, Wensheng Yu and Tingting Wang
Key Laboratory of Applied Chemistry and Nanotechnology at Universities of Jilin Province, Changchun University of Science and Technology, Changchun 130022, P. R. China. E-mail: dongxiangting888@163.com; Fax: +86-0431-85383815; Tel: +86-0431-85582574

Received 22nd August 2016 , Accepted 4th October 2016

First published on 5th October 2016


Abstract

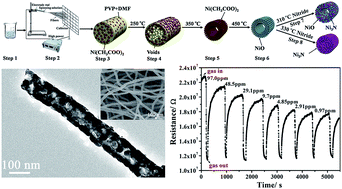
NiO hollow nanofibers were successfully synthesized via a facile electrospinning followed by post-calcination process, NiO/Ni3N composite hollow nanofibers and Ni3N nanofibers were prepared by nitridation of the prepared NiO hollow nanofibers in the presence of NH3 atmosphere at 310 °C and 330 °C, respectively. The crystal structure, morphology and compositions of NiO hollow nanofibers, NiO/Ni3N composite hollow nanofibers and Ni3N nanofibers were investigated by X-ray diffraction (XRD), scanning electron microscopy (SEM), transmission electron microscopy (TEM), energy dispersive spectrometry (EDS). Possible formation mechanism of samples was also proposed. By using NOx as a probe molecule, compared with NiO hollow nanofibers and Ni3N nanofibers, NiO/Ni3N composite hollow nanofibers exhibit more excellent sensing performances in terms of high response, fast response time, nice selectivity and excellent stability at room temperature. The outstanding performances in gas sensing of NiO/Ni3N composite hollow nanofibers owe to one-dimensional hollow fibrous nanostructure and the unique chemical composition, and NiO/Ni3N composite hollow nanofibers are promising material for NOx gas sensor at room temperature.

1. Introduction

In recent years, the increasing number of vehicles and growing industrial activities have triggered excessive nitrogen oxide (NO and NO2) release and grave pollution problems. To deal with these problems, it has become a hot topic of study to develop stable and reliable NOx gas sensors. Compared with conventional materials such as bulk or thin films applied to gas sensors, one-dimensional (1D) nanostructures, such as fibers, rods, belts, and tubes, have become the focus of intensive research owing to their unique applications in mesoscopic physics and fabrication of nanoscale devices.1 Electrospinning is an outstanding technique to process viscous solutions or melts into continuous fibers or ribbons with 1D nanostructure.2,3 This method not only attracts extensive academic investigations, but also applied in many areas such as filtration,4 luminescent materials,5–7 chemical sensors,8 biological scaffolds,9 electrode materials,10 drug delivery materials11–13 and nanocables.14

Particular semiconductor materials including metal nitrides such as GaN15–18 and InN,19 metal oxides including NiO20–22 and ZnO,23,24 and high-temperature materials such as SiC25 have seen the greatest interest for chemical gas sensing applications. Metal oxide micro-, meso-, and nanomaterials, with stable and controlled morphology and structure, have been widely studied with the objective of improving the performance of semiconductor gas sensors.26–28 Among these metal oxides, nickel oxide (NiO, band gap energy from 3.6 to 4.0 eV) nanomaterials, which are natural p-type semiconductors with high electron transport performance, have been recognized as the leading candidate for gas sensing devices due to their good sensitivity, low cost and high compatibility with micromachining.29 Many new strategies have been implemented with the focus of increasing the sensitivity, accelerating response and recovery rate, and enhancing selectivity in the past decades.30–32 However, it is still a major scientific challenge to develop the gas sensors with perfect performance in all these aspects.33 So, it is of importance to investigate low cost and ambient operation NOx gas sensors with low gas concentration and fast response. Gas sensors operated at room temperature (RT) are more suitable for practical applications.34 The central factors affecting the sensing performances of gas sensors depend not only on the structure, dimension, size, and morphology of sensing materials, but also on their compositions.22,35 As a typical example, innovative sensors with composite nanomaterials have been successfully obtained and the sensing performance of these gas sensors has been greatly improved.36–38

Herein, we employed electrospinning followed by thermal treatment to fabricate NiO hollow nanofibers, and then cleverly used the nitridation of NH3 atmosphere for preparation of NiO/Ni3N composite hollow nanofibers and Ni3N nanofibers by control of the calcination temperature, and then they were used as sensing materials to fabricate sensors for NOx sensing. To the best of our knowledge, NiO/Ni3N and Ni3N 1D nanomaterials prepared via electrospinning combined with subsequent NH3 atmosphere nitridation for NOx sensing have not been reported in the literatures. The structure, morphology, possible formation mechanism of samples and NOx sensing properties of the obtained nanofibers were systematically studied. Some new insights into the design and synthesis of gas sensing materials have been proposed, which will be very helpful for the development of future RT gas sensing devices.

2. Experimental section

2.1. Chemicals

The starting chemical reagents used in this work were as follows. Polyvinylpyrrolidone (PVP, Mw ≈ 90[thin space (1/6-em)]000) and N,N-dimethylformamide (DMF) were purchased from Tianjin Tiantai Fine Chemical Reagents Co., Ltd. Absolute ethyl alcohol (C2H5OH) was bought from Beijing Chemical Co. Ltd. Nickel acetate tetrahydrate (Ni(CH3COO)2·4H2O) was bought from Sinopharm Chemical Reagent Co., Ltd. Nitric oxide (NO), oxygen (O2), ammonia (NH3), hydrogen (H2), carbon monoxide (CO) and acetylene (C2H2) were purchased from Dalian Special Gases Co., Ltd. All chemicals were of analytical grade and directly used as received without further purification.

2.2. Synthesis of NiO, NiO/Ni3N and Ni3N nanofibers

2.2.1. Preparation of NiO hollow nanofibers. NiO hollow nanofibers were prepared by calcining electrospun Ni(CH3COO)2/PVP composite nanofibers. First, 1.0 g of Ni(CH3COO)2·4H2O was dissolved in 8.0 g of DMF, then 1.0 g of PVP was added into the above solution under magnetically stirring for 10 h to form homogeneous transparent spinning solution. In the spinning solution, the mass ratios of PVP, Ni(CH3COO)2·4H2O and DMF were 1[thin space (1/6-em)]:[thin space (1/6-em)]1[thin space (1/6-em)]:[thin space (1/6-em)]8. Subsequently, Ni(CH3COO)2/PVP composite nanofibers were prepared by electrospinning technique under a positive high voltage of 14 kV, distance between the capillary tip and the collector was 15 cm, and relative humidity was 40–60%. The collected electrospun composite nanofibers were then calcined at 450 °C in air for 2 h with a heating rate of 1 °C min−1 to obtain NiO hollow nanofibers.
2.2.2. Fabrication of NiO/Ni3N composite hollow nanofibers and Ni3N nanofibers. NiO hollow nanofibers were loaded into a graphite boat and then heated to 300 °C, 310 °C and 320 °C, respectively, with a heating rate of 1 °C min−1 under a flow of NH3 atmosphere and maintained at that temperature for 6 h, and then the calcination temperature was decreased to 100 °C with a cooling rate of 1 °C min−1, followed by natural cooling down to room temperature, thus composite hollow nanofibers with different ratios of NiO to Ni3N were obtained. In the following text, NiO/Ni3N composite hollow nanofibers refer to the sample obtained by nitriding at 310 °C unless otherwise noted. The preparative procedures for Ni3N nanofibers were the same as those for NiO/Ni3N composite hollow nanofibers except that the calcination temperature was 330 °C.

2.3. Characterization methods

Thermogravimetric analysis (TG) data was collected by using Pyris Diamond TG-DTA (TG, SDTQ600, PerkinElmer Thermal Analyzer) with the heating rate of 20 °C min−1 in air. The structural characterization of the samples was carried out by an X-ray powder diffractometer (XRD, Bruker, D8FOCUS) in a two-theta range of 30–90°, and the working voltage and current were kept at 40 kV and 30 mA, respectively. The diameter, morphology and crystal structure of the samples were analyzed using a field emission scanning electron microscope (FESEM, JSM-7610F, JEOL) and a transmission electron microscope (TEM, Tecnai G2 20 S-Twin, FEI). The elementary compositions of the samples were examined using OXFORD X-MaxN80 energy dispersive spectrometer (EDS) attached to FESEM.

2.4. Gas sensing tests

An interdigitated Au electrode (7 × 5 × 0.38 mm) was selected for gas sensing detection and the electrode spacing was 20 μm. A certain amount of nanofibers was dispersed in ethanol to form a suspension, then the suspension was spin-coated onto the interdigitated electrode to form a sensitive film and dried at 70 °C for 5 h to obtain a thin film gas sensor. The loading mass of nanofibers on the interdigitated electrode was 1.0 mg. The sensor was installed into a test chamber with an inlet and an outlet. The chamber was flushed with air for 2 min to remove any contaminants from the flask and also to stabilize the film before testing. A syringe was used to inject the required volume of NO vapor into the chamber. The changes in electrical resistance of the sample over time were recorded by a home-made automatic resistance apparatus, and the chamber was purged with air to recover the sensor resistance. The sensor response was defined as the ratio (RNR0)/R0, where R0 is the sensor resistance in air, and RN is the resistance in NOx gas. The response time is defined as the time required for the variation in resistance to reach 85% of the equilibrium value after a test gas was injected. The test was conducted at RT (20 °C) with a relative humidity around 40%.

3. Results and discussion

3.1. Structure and morphology of NiO hollow nanofibers

In order to manifest the decomposition process of Ni(CH3COO)2/PVP composite nanofibers, TG analysis was carried out. As illustrated in Fig. 1a, it shows the thermal behavior of Ni(CH3COO)2/PVP composite nanofibers. The weight loss is involved in four stages in TG curve. The first weight loss is 14.38% before 250 °C, which is caused by the loss of the surface absorbed water and the rest of solvent DMF in the composite nanofibers. The second obvious weight loss (76.95%) between 250 °C and 327 °C is mainly resulted from the decomposition of PVP. The third weight loss is 0.83% in the range from 327 °C to 365 °C, which is attributed to the COx released by the decomposition of PVP. The further weight loss (6.18%) between 365 °C and 375 °C is ascribed to the decomposition of acetate. Above 400 °C, the TG curve is unvaried, the total weight loss is 98.34%. Therefore, in this study, NiO hollow nanofibers were prepared by calcining Ni(CH3COO)2/PVP composite nanofibers at 450 °C for 2 h.
image file: c6ra21055d-f1.tif
Fig. 1 TG curve (a) of Ni(CH3COO)2/PVP composite nanofibers; XRD patterns (b) of NiO hollow nanofibers with PDF standard card of NiO.

Crystal structure and phase composition of NiO hollow nanofibers were confirmed by XRD measurements. As observed in Fig. 1b, all diffraction peaks are sharp and well-defined, implying that the sample is highly crystallized. It is seen that all the diffraction peaks of the sample can be readily indexed to cubic NiO (PDF#65-5745) with space group of Fm[3 with combining macron]m, and the diffraction peaks are situated at 2θ values of 37.25°, 43.29°, 62.88°, 75.41° and 79.41°, corresponding to (111), (200), (220), (311) and (222) crystallographic planes of the cubic NiO, respectively. No characteristic peaks are observed for other impurities, indicating the high purity of the prepared NiO.

SEM was employed to investigate the morphologies. From the low-magnification SEM images in Fig. 2a and c, it is obvious that the as-prepared nanofibers have uniform morphology on a large scale. Fig. 2b demonstrates the high-magnification SEM image of Ni(CH3COO)2/PVP composite nanofibers. It is observed that the fibers have smooth surface and fibrous morphology. The high-magnification SEM image of NiO hollow nanofibers is shown in Fig. 2d. One can see that the sample retains the morphology of fibers after calcination at 450 °C, NiO hollow nanofibers are composed of nanoparticles (NPs). The shrink of diameter of NiO hollow nanofibers after calcination is due to the decomposition of PVP and inorganic salts. Inset of Fig. 2d illustrates that NiO nanofibers possess hollow and well-defined tubular nanostructures.


image file: c6ra21055d-f2.tif
Fig. 2 SEM images of Ni(CH3COO)2/PVP composite nanofibers (a, b) and NiO hollow nanofibers (c, d).

Histograms of diameters distribution of Ni(CH3COO)2/PVP composite nanofibers and NiO hollow nanofibers are indicated in Fig. 3a and b. Under the 95% confidence level, the diameters of Ni(CH3COO)2/PVP composite nanofibers and NiO hollow nanofibers are 249.05 ± 3.24 nm, 116.64 ± 0.92 nm, respectively. EDS spectra of Ni(CH3COO)2/PVP composite nanofibers and NiO hollow nanofibers are manifested in Fig. 3c and d. EDS analysis shows that C, N, O, Ni are main elements in the composite nanofibers, and O and Ni elements exist in NiO hollow nanofibers. The element C, in NiO hollow nanofibers, comes from the used conductive tape. The Pt peaks in the spectra come from Pt conductive film plated on the surface of the samples for SEM observation. No other elements are found in the samples, indicating that pure samples are obtained.


image file: c6ra21055d-f3.tif
Fig. 3 Histograms (a, b) of diameters distribution and EDS spectra (c, d) of Ni(CH3COO)2/PVP composite nanofibers (a, c) and NiO hollow nanofibers (b, d).

Fig. 4a shows the typical TEM image of NiO hollow nanofibers. TEM image in Fig. 4a clearly indicates that NiO nanofiber consist of NPs, and it is hollow structure, which agrees with SEM observations. These tiny NiO NPs are densely anchored on the surface of fibers. Fig. 4b shows the High-resolution TEM (HRTEM) image of NiO hollow nanofibers. It is obviously demonstrated the well-textured and crystalline lattice with a distance of 0.24 and 0.21 nm matching very well with the lattice distances of (111) and (200) crystallographic planes of cubic NiO, respectively.


image file: c6ra21055d-f4.tif
Fig. 4 TEM image (a) and HRTEM image (b) of NiO hollow nanofibers.

3.2. Structure and morphology of NiO/Ni3N composite hollow nanofibers and Ni3N nanofibers

The XRD patterns (Fig. 5a) confirm the coexistence of NiO and Ni3N in the sample nitrided at 310 °C. As observed in Fig. 5b, when nitridation temperature was 330 °C, all diffraction peaks of NiO completely disappear, and all diffraction peaks are well indexed to pure Ni3N (PDF#10-0280) of hexagonal structure with space group of P6322, whose diffraction peaks are situated at 2θ values of 38.94°, 42.11°, 44.48°, 58.52°, 70.60°, 78.38°, 85.67° and 87.39°, corresponding to (110), (002), (111), (112), (300), (113), (302) and (221) crystallographic planes of the hexagonal Ni3N, respectively. Notably, no other impurities can be detected, indicating the high purity of the prepared Ni3N.
image file: c6ra21055d-f5.tif
Fig. 5 XRD patterns of NiO/Ni3N composite hollow nanofibers (a) and Ni3N nanofibers (b).

The SEM images of NiO/Ni3N composite hollow nanofibers and Ni3N nanofibers are shown in Fig. 6. From the low-magnification SEM images in Fig. 6a and c, it is obvious that the as-prepared nanofibers have uniform morphology on a large scale. As shown in Fig. 6b, all the obtained nanofibers possess uniform diameter and in random orientation. From inset of Fig. 6b, it can be found that the nanofibers are hollow structure. Fig. 6d demonstrates Ni3N nanofibers have rough surface and not hollow structure (inset of Fig. 6d).


image file: c6ra21055d-f6.tif
Fig. 6 SEM images of NiO/Ni3N composite hollow nanofibers (a, b) and Ni3N nanofibers (c, d).

Under the confidence level of 95%, the diameters of NiO/Ni3N composite hollow nanofibers and Ni3N nanofibers analyzed by Shapiro–Wilk method are normal distribution. Histograms of diameters distribution of the nanofibers are indicated in Fig. 7a and b. As seen from Fig. 7a and b, the diameters of NiO/Ni3N composite hollow nanofibers and Ni3N nanofibers are 112.05 ± 1.87 nm, 106.91 ± 0.90 nm, respectively. The diameter of NiO/Ni3N composite hollow nanofibers is reduced after nitriding because the spaces among crystallites are reduced and crystallites are more closely connected in NiO/Ni3N composite hollow nanofibers during second calcining process at 310 °C, leading to the size reduction of NiO/Ni3N composite hollow nanofibers. The similar process happens to Ni3N nanofibers. Since nitriding temperature is further increased to 330 °C, size shrink is bigger, resulting in the fact that Ni3N solid nanofibers are formed, and diameter is further decreased. The elementary compositions of NiO/Ni3N composite hollow nanofibers and Ni3N nanofibers were further confirmed by EDS, as revealed in Fig. 7c and d. The EDS spectra reveal the presence of Ni, O, and N elements in NiO/Ni3N composite hollow nanofibers, and Ni and N elements in Ni3N nanofibers. The element C, in NiO/Ni3N composite hollow nanofibers and Ni3N nanofibers, comes from the used conductive tape. The Pt peaks in the spectra come from Pt conductive film plated on the surface of the samples for SEM observation. No other elements are found in the samples, implying that the samples have high purity.


image file: c6ra21055d-f7.tif
Fig. 7 Histograms (a, b) of diameters distribution and EDS spectra (c, d) of NiO/Ni3N composite hollow nanofibers (a, c) and Ni3N nanofibers (b, d).

To provide further insights into the morphology and structure of NiO/Ni3N composite hollow nanofibers and Ni3N nanofibers, TEM investigations were carried out. Fig. 8a and c show the typical TEM images of NiO/Ni3N composite hollow nanofibers and Ni3N nanofibers. TEM image in Fig. 8a indicates that NiO/Ni3N composite nanofiber is hollow structure, which agrees with SEM observations. Fig. 8b shows the HRTEM image of NiO/Ni3N composite hollow nanofibers. From the HRTEM image of the heterojunction region (Fig. 8b), the observed two lattice-fringe spacings of 0.24 and 0.20 nm are consistent with the (111) crystallographic plane of cubic NiO and the (111) crystallographic plane of hexagonal Ni3N, respectively. Fig. 8c shows the TEM image of Ni3N nanofibers, which indicates that sample is not hollow structure. The HRTEM image (Fig. 8d) exhibits clear lattice fringes with spacing of 0.20 nm, which correspond to the (111) crystallographic plane of hexagonal Ni3N.


image file: c6ra21055d-f8.tif
Fig. 8 TEM images (a, c) and HRTEM (b, d) images of NiO/Ni3N composite hollow nanofibers (a, b), Ni3N nanofibers (c, d).

Based on above analyses, we propose a possible formation mechanism of NiO hollow nanofibers, NiO/Ni3N composite hollow nanofibers and Ni3N nanofibers, as shown in Fig. 9. Ni(CH3COO)2·4H2O was dissolved in DMF, and then PVP was added into the above solution under magnetically stirring for 10 h to form homogeneous transparent spinning solution (step 1). Ni(CH3COO)2/PVP composite nanofibers were prepared by electrospinning technique (step 2). PVP, residual DMF and Ni(CH3COO)2 were evenly dispersed in Ni(CH3COO)2/PVP composite nanofibers after electrospinning (step 3). During calcination process, as the calcination temperature reached 250 °C, lots of voids appeared in Ni(CH3COO)2/PVP composite nanofibers, which was caused by the loss of the solvent DMF. With the evaporation of the solvent, the gas produced would bring Ni(CH3COO)2 to the surface of the composite nanofibers (step 4). As the annealing temperature further increased, the PVP removed from the composite nanofibers via combustion. At the same time, the Ni(CH3COO)2 was located near the surface of the composite nanofibers (step 5). When the temperature reached the decomposition point of the Ni(CH3COO)2, NiO crystallites were produced, many crystallites were combined into NPs, then some NPs were mutually connected to generate hollow-centered NiO nanofibers (step 6). Then, NiO hollow nanofibers were heated to 310 °C in a graphite boat under a flow of NH3 atmosphere, part of NiO NPs turned to Ni3N NPs, and NiO/Ni3N composite hollow nanofibers were obtained (step 7). When nitridation temperature was 330 °C, all NiO NPs turned to Ni3N NPs, and Ni3N nanofibers were obtained (step 8).


image file: c6ra21055d-f9.tif
Fig. 9 Schematic diagram of electrospinning setup and possible formation mechanism of NiO hollow nanofibers, NiO/Ni3N composite hollow nanofibers and Ni3N nanofibers.

3.3. Sensing performance of NiO/Ni3N composite hollow nanofibers

To investigate the gas sensing application of the sensors fabricated by NiO/Ni3N composite hollow nanofibers, gas sensing behavior measurements were performed towards different NOx concentrations at RT. The sensing performances of composite hollow nanofibers with different ratios of NiO to Ni3N obtained by nitriding at 300 °C, 310 °C and 320 °C were investigated, and the details are listed in Table 1. The results manifested that the sensing performance of composite hollow nanofibers acquired by nitriding at 310 °C is the best. According to XRD data of the sample acquired by nitriding at 310 °C, optimum molar ratio of NiO to Ni3N is calculated to be 1[thin space (1/6-em)]:[thin space (1/6-em)]0.91. Fig. 10b depicts representative dynamic gas responses of NiO/Ni3N composite hollow nanofibers thin film sensor on the NOx concentrations ranging from 97.0 ppm to 0.97 ppm at RT. A sharp decrease in surface resistance of the sensor has been observed with the introduction of NOx and a drastic rise to its initial value after the sensor was exposed to air. This may be assigned to the redox reaction of NOx with the adsorbed oxygen species O2. When a p-type semiconductor is exposed to NOx gas molecules, the concentration of hole carriers on the surface of semiconductor increases due to the loss of an electron as the NOx has a higher electron affinity, which results in a decrease in resistance in the semiconductor layer. Those evidences indicate that NiO/Ni3N composite hollow nanofibers gas sensor has p-type conductivity, the adsorbed NOx molecules (NO2 or NO) are acting as an electron acceptor, and the electrons move from NiO/Ni3N composite hollow nanofibers to NOx. Obviously, the thin-film sensor based on NiO/Ni3N composite hollow nanofibers exhibits a rapid and reversible response signal to NOx gas even at the lowest exposure level (0.97 ppm), both in the adsorption and desorption process. The representative response–recovery cyclic of NiO hollow nanofibers and Ni3N nanofibers curves in Fig. 10d and e indicate that the synthesized NiO hollow nanofibers and Ni3N nanofibers are both p-type semiconductors, which displays a resistance decreases upon introducing NOx as a square concentration pulse of 97.0 ppm into the test chamber. Fig. 10f shows the corresponding relationship between response and response time for NiO/Ni3N composite hollow nanofibers sensors under different NOx concentrations. When the concentration of NOx is 97.0 ppm, the response time is only 12.0 s, while the highest response reaches to 50.0%. It is found that response declines gradually with the decrease in concentration of NOx. This is associated with the gas concentration, gas diffusion and adsorbance on the surface of the nanomaterials. It should be noted that NiO/Ni3N composite hollow nanofibers sensor exhibits the lowest detection limit of 0.97 ppm at RT, and the sensing response and response time are 32.1% and 61.5 s.
Table 1 Gas response of composite hollow nanofibers with different ratios of NiO to Ni3N obtained by nitriding at 300 °C, 310 °C and 320 °C sensors to NOx operated at RT
Nitriding temperatures (°C) Response (%)
97.0 ppm 48.5 ppm 29.1 ppm 9.70 ppm 4.85 ppm 2.91 ppm 0.97 ppm
300 43.7 39.0 31.5 25.2 24.5 13.4 5.3
310 50.0 46.8 43.9 40.9 37.5 35.0 33.2
320 42.5 40.7 34.2 31.5 20.0 13.5 7.4


image file: c6ra21055d-f10.tif
Fig. 10 Dynamic response–recovery cyclic curves of the gas response for composite hollow nanofibers with different ratios of NiO to Ni3N obtained by nitriding at 300 °C (a), 310 °C (b) and 320 °C (c), NiO hollow nanofibers (d), Ni3N nanofibers (e) sensors, and response and response time of the gas sensors based on NiO/Ni3N composite hollow nanofibers (f) for different concentrations of NOx operated at RT in air.

Fig. 11 shows the sensing performances of three sensors based on NiO hollow nanofibers, NiO/Ni3N composite hollow nanofibers and Ni3N nanofibers to NOx at RT. As seen in Fig. 11a and b, all gas sensors present different degrees of response and response time to NOx, and the details are listed in Tables 2 and 3. In Fig. 11a, the gas response of NiO/Ni3N composite hollow nanofibers to NOx with different concentrations is better than the other two kinds of nanofibers. The response of NiO/Ni3N composite hollow nanofibers to 97.0 ppm NOx is the 2.08 and 1.28 times of NiO hollow nanofibers and Ni3N nanofibers, respectively. Fig. 11b shows the response time of the three sensors. Compared with NiO hollow nanofibers and Ni3N nanofibers, the response time of NiO/Ni3N composite hollow nanofibers becomes fastest by introducing amount of NOx. So, the gas sensor based on NiO/Ni3N composite hollow nanofibers displays enhanced sensing performance for practical application since it possess the highest response and fastest response to NOx.


image file: c6ra21055d-f11.tif
Fig. 11 Bar graphs of the response (a) and the response time (b) to 97.0–0.97 ppm NOx at RT for the three sensors based on NiO hollow nanofibers, NiO/Ni3N composite hollow nanofibers and Ni3N nanofibers.
Table 2 Gas response of NiO hollow nanofibers, NiO/Ni3N composite hollow nanofibers and Ni3N nanofibers sensors to NOx operated at RT
Sample Response (%)
97.0 ppm 48.5 ppm 29.1 ppm 9.70 ppm 4.85 ppm 2.91 ppm 0.97 ppm
NiO nanofibers 24.0 20.3 18.3 18.1 16.0 16.6 14.0
NiO/Ni3N nanofibers 50.0 46.8 43.9 40.9 37.5 35.0 33.2
Ni3N nanofibers 38.9 36.3 33.8 32.7 30.9 28.7 28.9


Table 3 Gas response time of NiO hollow nanofibers, NiO/Ni3N composite hollow nanofibers and Ni3N nanofibers sensors to NOx operated at RT
Sample Response time (s)
97.0 ppm 48.5 ppm 29.1 ppm 9.70 ppm 4.85 ppm 2.91 ppm 0.97 ppm
NiO nanofibers 32.0 41.0 49.0 50.5 56.5 63.0 72.0
NiO/Ni3N nanofibers 12.0 18.0 32.0 41.0 53.0 57.5 61.5
Ni3N nanofibers 38.0 43.5 47.0 53.0 58.5 69.0 75.0


Moreover, we note that the gas response of NiO/Ni3N composite hollow nanofibers sensor presents a favorable linearity (y = 8.58x + 32.11) and correlation coefficient (R2 = 0.9776) in the investigated NOx concentration ranging from 97.0 to 0.97 ppm by plotting the gas response against log[NOx] (Fig. 12a). From calibration curves, it is possible to extract information about the gas response and an unknown concentration of NOx gas can then be identified by comparing its response value to the reference curve. Thus, NiO/Ni3N composite hollow nanofibers sensor is suitable for commercial application to NOx sensing detection.


image file: c6ra21055d-f12.tif
Fig. 12 Linear dependence relation between the gas response and relative NOx concentration for NiO/Ni3N composite hollow nanofibers sensor (a) and bar graphs for gas selectivity of NiO/Ni3N composite hollow nanofibers sensor to NOx, O2, NH3, CO, C2H2 and H2 (b).

The gas sensing selectivity is another parameter to evaluate the sensing ability of semiconductor materials. Fig. 12b is the response values of NiO/Ni3N composite hollow nanofibers sensors to different gases at the same concentrations of 97.0 ppm, respectively. From the Fig. 12b, one can see that the measured response to 97.0 ppm of NOx (50.0%) is higher than the corresponding values for 97.0 ppm of NH3 (2.3%), but it is totally insensitive to O2, H2, CO and C2H2 at the same concentration of 100 ppm. The sensor exhibits higher gas response to NOx than to other gases, which is mainly because of the enhanced reaction between the NOx and the absorbed oxygen (O2−, O) at RT.39,40

As a typical surface-based reaction, the sensor response greatly depends on the morphology, size, structure, chemical composition and exposed crystal surfaces of the sensing materials. Further, the sensing mechanism mainly includes the gas adsorption, charge transfer, and desorption process.41–43 Although the detection mechanism for NOx on the metal nitrides sensors is still not fully understood, previous suggestions for sensing include desorption of adsorbed nitrous oxides from the surface and grain boundaries, an exchange of charges between absorbed gas species and the interface leading to a change in the depletion depth or changes to the conduction at the surface by gas adsorption and desorption.19,44 Therefore, the sensing mechanism is proposed as follows. Firstly, when NiO/Ni3N composite hollow nanofibers semiconductor is used as gas sensor and exposed in air, O2 molecules will be chemisorbed and capture some electrons of NiO/Ni3N composite hollow nanofibers to be changed into O2, O, and O2− on the sensing body surfaces.45 Secondly, the adsorption of NOx on NiO/Ni3N composite hollow nanofibers leads to NO2 and NO. At the same time, the target gas NOx molecules directly adsorb on surface and react with O2 and generate bidentate NO3 and NO2.46,47 The reactions are as follows:

 
O2 + e ⇄ O2 (2O) (1)
 
NO2 + e ⇄ NO2 (2)
 
NO + e ⇄ NO (3)
 
NO2 + O → NO3 (4)
 
NO + O → NO2 (5)

According to the above comprehensive structure characterization and sensing performance of NiO/Ni3N composite hollow nanofibers, we infer that the enhanced sensing properties of NiO/Ni3N composite hollow nanofibers are attributed to 1D hollow fibrous structure and the unique chemical composition of the composites. NiO/Ni3N composite hollow nanofibers have unique 1D hollow fibrous nanostructure with two adsorbed layers on both the outer and inner surfaces, large amount of sensing activity sites, resulting in the enhanced response to NOx at RT. According to the literatures reported in recent years, the properties of composites with two or more chemical composition are superior to single-component materials.48,49 Besides, the Ni3N NPs are distributed around the NiO NPs uniformly and connect to the NiO NPs forming lots of heterojunctions in the composites. Therefore, there are lots of defects in the interfaces, which can induce trap energy levels at the surfaces and interfaces, and the trapping of carrier electrons in the trap states can cause accumulation layers in the surface and interface regions,50,51 and finally resulting in improvement of gas sensing performance.

4. Conclusions

In summary, NiO hollow nanofibers were successfully synthesized via a facile electrospinning followed by post-calcination process, and then NiO/Ni3N composite hollow nanofibers and Ni3N nanofibers were fabricated by nitridation of the prepared NiO hollow nanofibers using NH3 atmosphere through control of the calcination temperature. Compared with NiO hollow nanofibers and Ni3N nanofibers, NiO/Ni3N composite hollow nanofibers based gas sensor displays better sensing performances toward NOx at RT, such as high response of 50.0%, nice selectivity and short response time of 12.0 s to 97.0 ppm NOx. The NiO-composited Ni3N have potential application for a novel gas sensor at room temperature. More importantly, the synthetic strategy may be extended to synthesis of other metal oxides and metal nitrides nanostructures as superior performances sensor at room temperature.

Acknowledgements

This work was financially supported by the National Natural Science Foundation of China (51573023, 50972020, 51072026, 21601018), the Science and Technology Development Planning Project of Jilin Province (20130101001JC, 20070402).

References

  1. R. S. Devan, R. A. Patil, J. Lin and Y. Ma, Adv. Funct. Mater., 2012, 22, 3326–3370 CrossRef CAS.
  2. D. Li and Y. N. Xia, Adv. Mater., 2004, 16, 1151–1170 CrossRef CAS.
  3. Z. Y. Hou, G. G. Li, H. Z. Lian and J. Lin, J. Mater. Chem., 2012, 22, 5254–5276 RSC.
  4. W. Sambaer, M. Zatloukal and D. Kimmer, Chem. Eng. Sci., 2011, 66, 613–623 CrossRef CAS.
  5. W. W. Ma, W. S. Yu, X. T. Dong, J. X. Wang and G. X. Liu, Chem. Eng. J., 2014, 244, 531–539 CrossRef CAS.
  6. X. Xi, J. X. Wang, X. T. Dong, Q. L. Ma, W. S. Yu and G. X. Liu, Chem. Eng. J., 2014, 254, 259–267 CrossRef CAS.
  7. Q. L. Ma, J. X. Wang, X. T. Dong, W. S. Yu and G. X. Liu, Chem. Eng. J., 2015, 260, 222–230 CrossRef CAS.
  8. J. M. Corres, Y. R. Garcia, F. J. Arregui and I. R. Matias, IEEE Sens. J., 2011, 11, 2383–2387 CrossRef.
  9. S. A. Sell, P. S. Wolfe, J. J. Ericksen, D. G. Simpson and G. L. Bowlin, Tissue Eng., Part A, 2011, 17, 2723–2737 CrossRef CAS PubMed.
  10. S. L. Chen, H. Q. Hou, F. Harnisch, S. A. Patil, A. A. Carmona-Martinez, S. Agarwal, Y. Y. Zhang, S. Sinha-Ray, A. L. Yarin, A. Greiner and U. Schröder, Energy Environ. Sci., 2011, 4, 1417–1421 CAS.
  11. Z. Y. Hou, X. J. Li, C. X. Li, Y. L. Dai, P. A. Ma, X. Zhang, X. J. Kang, Z. Y. Cheng and J. Lin, Langmuir, 2013, 29, 9473–9482 CrossRef CAS PubMed.
  12. Z. Y. Hou, C. X. Li, P. A. Ma, G. G. Li, Z. Y. Cheng, C. Peng, D. M. Yang, P. P. Yang and J. Lin, Adv. Funct. Mater., 2011, 21, 2356–2365 CrossRef CAS.
  13. Z. Y. Hou, C. X. Li, P. A. Ma, Z. Y. Cheng, X. J. Li, X. Zhang, Y. L. Dai, D. M. Yang, H. Z. Lian and J. Lin, Adv. Funct. Mater., 2012, 22, 2713–2722 CrossRef CAS.
  14. J. Song, M. L. Chen, M. B. Olesen, C. X. Wang, R. Havelund, Q. Li, E. Q. Xie, R. Yang, P. Bøggild, C. Wang, F. Besenbacher and M. D. Dong, Nanoscale, 2011, 3, 4966–4971 RSC.
  15. C. Y. Chang, G. C. Chi, W. Wang, L. C. Chen, K. H. Chen, F. Ren and S. J. Pearton, J. Electron. Mater., 2006, 35, 738–743 CrossRef CAS.
  16. C. Y. Chang, T. W. Lan, G. C. Chi, L. C. Chen, K. H. Chen, J. J. Chen, S. Jang, F. Ren and S. Pearton, Electrochem. Solid-State Lett., 2006, 9, G155–G157 CrossRef CAS.
  17. R. Mehandru, B. Luo, B. S. Kang, J. Kim, F. Ren, S. J. Pearton, C. C. Fan, G. T. Chen and J. I. Chyi, Solid-State Electron., 2004, 48, 351–353 CrossRef CAS.
  18. S. J. Pearton, B. S. Kang, S. Kim, F. Ren, B. P. Gila, C. R. Abernathy, J. Lin and S. N. G. Chu, J. Phys.: Condens. Matter, 2004, 16, R961–R994 CrossRef CAS.
  19. J. S. Wright, W. Lim, D. P. Norton, S. J. Pearton, F. Ren, J. L. Johnson and A. Ural, Semicond. Sci. Technol., 2010, 25, 380–388 CrossRef.
  20. J. Wang, P. Yang, X. W. Wei and Z. H. Zhou, Nanoscale Res. Lett., 2015, 10, 1–6 CrossRef PubMed.
  21. J. Wang, F. Yang, X. W. Wei, Y. F. Zhang, L. M. Wei, J. J. Zhang, Q. F. Tang, B. Guo and L. Xu, Phys. Chem. Chem. Phys., 2014, 16, 16711–16718 RSC.
  22. J. Zhang, D. W. Zeng, S. Q. Zhao, J. J. Wu, K. Xu, Q. Zhu, G. Z. Zhang and C. S. Xie, Phys. Chem. Chem. Phys., 2015, 17, 14903–14911 RSC.
  23. H. T. Wang, B. S. Kang, F. Ren, L. C. Tien, P. W. Sadik, D. P. Norton, S. J. Pearton and J. Lin, Appl. Phys. Lett., 2005, 86, 243503 CrossRef.
  24. O. Lupan, G. Y. Chai and L. Chow, Microelectron. J., 2007, 38, 1211–1216 CrossRef CAS.
  25. C. K. Kim, J. H. Lee, S. M. Choi, I. H. Noh, H. R. Kim, N. I. Cho, C. Hong and G. E. Jang, Sens. Actuators, B, 2001, 77, 455–462 CrossRef CAS.
  26. O. S. Kwon, J. Y. Hong, S. J. Park, Y. Jang and J. Jang, J. Phys. Chem. C, 2010, 114, 18874–18879 CAS.
  27. D. Barreca, E. Comini, A. P. Ferrucci, A. Gasparotto, C. Maccato, C. Maragno, G. Sberveglieri and E. Tondello, Chem. Mater., 2007, 19, 5642–5649 CrossRef CAS.
  28. Z. P. Li, Q. Q. Zhao, W. L. Fan and J. H. Zhan, Nanoscale, 2011, 3, 1646–1652 RSC.
  29. S. Jana, S. Samai, B. C. Mitra, P. Bera and A. Mondal, Dalton Trans., 2014, 43, 13096–13104 RSC.
  30. Y. Q. Liang, Z. D. Cui, S. L. Zhu, Z. Y. Li, X. J. Yang, Y. J. Chen and J. M. Ma, Nanoscale, 2013, 5, 10916–10926 RSC.
  31. S. Mridha and D. Basak, Semicond. Sci. Technol., 2006, 21, 928–932 CrossRef CAS.
  32. D. Bekermann, A. Gasparotto, D. Barreca, C. Maccato, E. Comini, C. Sada, G. Sberveglieri, A. Devi and R. A. Fischer, ACS Appl. Mater. Interfaces, 2012, 4, 928–934 CAS.
  33. J. Cao, Z. Y. Wang, R. Wang, S. Liu, T. Fei, L. J. Wang and T. Zhang, J. Mater. Chem. A, 2015, 3, 5635–5641 CAS.
  34. J. Gao, L. L. Wang, K. Kan, S. Xu, L. Q. Jing, S. Q. Liu, P. K. Shen, L. Li and K. Y. Shi, J. Mater. Chem. A, 2014, 2, 949–956 CAS.
  35. J. Wang, L. M. Wei, L. Y. Zhang, J. Zhang, H. Wei, C. H. Jiang and Y. F. Zhang, J. Mater. Chem., 2012, 22, 20038–20047 RSC.
  36. M. Ahsan, T. Tesfamichael, M. Ionescu, J. Bell and N. Motta, Sens. Actuators, B, 2012, 162, 14–21 CrossRef CAS.
  37. X. Chen, Z. Guo, W. H. Xu, H. B. Yao, M. Q. Li, J. H. Liu, X. J. Huang and S. H. Yu, Adv. Funct. Mater., 2011, 21, 2049–2056 CrossRef CAS.
  38. P. Sun, L. You, Y. F. Sun, N. K. Chen, X. B. Li, H. B. Sun, J. Ma and G. Y. Lu, CrystEngComm, 2012, 14, 1701–1708 RSC.
  39. D. H. Zhang, Z. Q. Liu, C. Li, T. Tang, X. L. Liu, S. Han, B. Lei and C. W. Zhou, Nano Lett., 2004, 4, 1919–1924 CrossRef CAS.
  40. R. J. Lv, K. Y. Shi, W. Zhou, L. Wang, C. G. Tian, K. Pan, L. Sun and H. G. Fu, J. Mater. Chem., 2012, 22, 24814–24820 RSC.
  41. Z. P. Li, H. Yan, S. L. Yuan, Y. J. Fan and J. H. Zhan, J. Colloid Interface Sci., 2011, 354, 89–93 CrossRef CAS PubMed.
  42. N. Du, H. Zhang, B. D. Chen, X. Y. Ma, Z. H. Liu, J. B. Wu and D. R. Yang, Adv. Mater., 2007, 19, 1641–1645 CrossRef CAS.
  43. J. T. McCue and J. Y. Ying, Chem. Mater., 2007, 19, 1009–1015 CrossRef CAS.
  44. A. Baranzahi, A. L. Spetz and I. Lundström, Appl. Phys. Lett., 1995, 67, 3203–3205 CrossRef CAS.
  45. X. J. Huang, F. L. Meng, Z. X. Pi, W. H. Xu and J. H. Liu, Sens. Actuators, B, 2004, 99, 444–450 CrossRef CAS.
  46. Y. Yang, C. G. Tian, L. Sun, J. C. Wang, K. Y. Shi, W. Zhou and H. G. Fu, Nanoscale, 2014, 6, 7369–7378 RSC.
  47. Y. Yang, C. G. Tian, L. Sun, R. J. Lü, W. Zhou, K. Y. Shi, K. Kan, J. C. Wang and H. G. Fu, J. Mater. Chem. A, 2013, 1, 12742–12749 CAS.
  48. S. Basu and P. Bhattacharyya, Sens. Actuators, B, 2012, 173, 1–21 CrossRef CAS.
  49. S. Bai and X. P. Shen, RSC Adv., 2012, 2, 64–98 RSC.
  50. S. Park, S. An, Y. Mun and C. Lee, ACS Appl. Mater. Interfaces, 2013, 5, 4285–4292 CAS.
  51. S. Xu, J. Gao, L. Wang, K. Kan, Y. Xie, P. Shen, L. Li and K. Y. Shi, Nanoscale, 2015, 7, 14643–14651 RSC.

This journal is © The Royal Society of Chemistry 2016
Click here to see how this site uses Cookies. View our privacy policy here.