High shielding effectiveness of multilayer graphene oxide aerogel film/polymer composites

Dong Hana, Yun-Hong Zhaoa, Shu-Lin Bai*a and Wong Ching Pingb
aDepartment of Materials Science and Engineering, HEDPS/CAPT/LTCS, Key Laboratory of Polymer Chemistry and Physics of Ministry of Education, College of Engineering, Peking University, Beijing 100871, China. E-mail: slbai@pku.edu.cn; Tel: +86-10-6275 9379
bDepartment of Electronic Engineering, The Chinese University of Hong Kong, Shatin, N.T., Hong Kong, SAR, China

Received 20th August 2016 , Accepted 19th September 2016

First published on 20th September 2016


Abstract

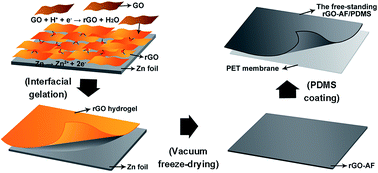
In this work, an efficient and simple method is proposed to fabricate lightweight and flexible composites composed of a reduced graphene oxide aerogel film (rGO-AF) and a polydimethylsiloxane (PDMS) matrix. Their morphology, electromagnetic interference (EMI) shielding effectiveness (SE), and corresponding mechanisms are studied. The rGO-AF was obtained by a process with combinations of zinc reduction, freeze-drying, peeling and stacking. Then, single and multilayer rGO-AF/PDMS composites were fabricated by liquid PDMS infiltrating and curing. The shielding effectiveness of the composites is found to depend on the gelation time. The prepared five-layer composite with a density of 0.122 g cm−3 and a thickness of 1.547 mm, has an SE value of 53 dB at X band (8.2–12.4 GHz), and a specific SE of up to 434 dB cm3 g−1. Based on the measurements on absorption and reflection shielding effectiveness, the high electromagnetic irradiation (EMI) shielding effectiveness of rGO-AF/PDMS composites is attributed to the absorption dominated shielding attenuation.


1. Introduction

The widespread applications of modern electronic devices packed with highly integrated circuits have generated excessive electromagnetic irradiation, which results in detrimental effects on sensitive precision electronic instruments as well as the health of human beings.1–3 Thus, great efforts have been made for the development of high-efficiency electromagnetic interference (EMI) shielding materials. In addition to high EMI shielding performance, being lightweight, flexible and noncorrosive are other key factors that drive practical applications of electromagnetic wave attenuation materials used in the aerospace, military, industry, automobiles, and fast-developing next-generation flexible electronics fields.4

Carbon-based materials including carbon filaments,5 carbon nanofibers,6 carbon nanotubes,7–10 carbon black,11,12 graphite,13 chemically derived graphene14–17 and 2D transition metal carbides18 have been used as conductive fillers in polymeric composites for EMI shielding. Those fillers have common advantages over traditional metal-based materials, such as high electrical conductivity, light weight and good mechanical flexibility. However, it is reported that high electrical conductivity and connectivity of the conductive fillers in polymeric composites are two major reasons that facilitate blocking and attenuating unexpected electromagnetic irradiations.1–3,5,14 While nano-sized or micron-sized conductive carbon-based fillers are randomly distributed inside the polymer matrix and their concentration must reach a certain value in order to establish electron percolation network. As a consequence, most works devoted to increase carbon-based fillers concentration to improve the EMI shielding effectiveness of composites. Whereas, the high filler loading may often cause the poor processability and the degradation of mechanical properties due to severe filler agglomeration and reduced polymer content.

Graphene-based polymer composites with foam and film structures have recently attracted much attention for their ultrahigh electrical conductivity and excellent mechanical strength. Zhang et al.14 fabricated nanocomposite microcellular foams by blending polymethylmethacrylate (PMMA) with graphene sheets followed by foaming with subcritical CO2 as an expanding or foamingagent. The graphene/PMMA foam with a low graphene loading of 1.8 vol% shows a high electrical conductivity of 3.11 S m−1 as well as a good EMI SE of 13–19 dB at X band. With the aim of reducing the effective thickness, Song et al.16 have designed and fabricated ultrathin and flexible graphene paper of ∼0.3 mm in thickness and have obtained a SE value of ∼46.3 dB. Similarly, Song et al.17 have further fabricated conductive composite films of graphene/poly(ethylene/vinyl acetate) which have an optimized SE of up to 27 dB. Using a template-directed chemical vapor deposition method, Chen et al.19 have prepared an ultra-lightweight and highly conductive graphene/polymer foam composite with a SE value of 22–25 dB at X band.

Herein, we demonstrate an efficient and simple method to fabricate lightweight, flexible and highly conductive composites for high-performance EMI shielding application. They are composed of reduced graphene oxide aerogel film (rGO-AF) as filler and polydimethylsiloxane (PDMS) as matrix. The EMI shielding effectiveness was measured, and the EMI shielding mechanism was analyzed and studied.

2. Experimental section

2.1 Synthesis of reduced graphene oxide aerogel film (rGO-AF)

Water-soluble graphene oxide (GO) dispersion (6 mg mL−1) was prepared from graphite powder (Sinopharm Chemical Reagent Co., Ltd) according to a modified Hummers method.20,21 The dispersion was then diluted to 3 mg mL−1 with predetermined HCl aqueous solution (10−3 mol L−1) and sonicated for 30 min. A Zn foil (Benchely) was immersed into the acidified GO solution for interfacial gelation.22 After a desired period (1–5 h) of deposition, interfacial gel grown on Zn foil was thoroughly washed with deionized water and then raised with water for 30 min in order to remove unreacted physisorbed GO sheets. Immediately following the washing steps, the gel film was detached from Zn foil by a 20 fold diluted HCl etching and transferred into an aqueous HCl solution for another 5 h to dissolve residual Zn impurities. Finally, the free-standing gel film was dialyzed for more than 12 h to remove acidic impurities.

After dialysis, a hydrated dark rGO hydrogel film with a considerably high water content was obtained. In order to keep the gel structure, the hydrogel film was put into a vacuum freeze drier for 36 h during which the spacer water molecules were evaporated. Finally, the freeze-dried anhydrous rGO aerogel film (rGO-AF) was collected for the next fabrication process. The rGO-AF formed with 1, 2, 3, 4 or 5 h gelation time is designated as rGO-AFs (s = 1, 2, 3, 4, 5).

2.2 Fabrication of single-layer (SL) and multilayer (ML) rGO-AF/PDMS composites

A diluted PDMS solution was prepared by mixing a PMDS base agent (vinyl polysiloxane), curing agent (hydrid polysiloxane) and thinner solvent (Sylgard 184, Dow Corning) in the weight ratio of 10[thin space (1/6-em)]:[thin space (1/6-em)]1[thin space (1/6-em)]:[thin space (1/6-em)]5. The freeze-dried anhydrous rGO-AF was immersed in the diluted PDMS solution for 30 min and moved on a piece of polyethylene glycol terephthalate (PET) membrane, then hung up to remove redundant PDMS solution. Followed by thermal curing at 80 °C for 4 h, as it was easy to peel off the rGO-AF coated with PDMS from the PET membrane to get SL-rGO-AF/PDMS composite.

For the fabrication of ML-rGO-AF/PDMS composite, the SL-rGO-AF coated with uncured PDMS was stacked together in suitable molds to achieve a layered structure, and then cured at 80 °C for 4 h in an electric heating air-blowing drier to get bulk materials. The composites with 1, 2, 3, 4 and 5 layers of SL-rGO-AF5/PDMS composite are designated as ML-rGO-AF5/PDMS composites (M = 1, 2, 3, 4, 5). The schematic diagram of SL- and ML-rGO-AF/PDMS composites is shown in Fig. 1.


image file: c6ra20976a-f1.tif
Fig. 1 (a) Structural schematic of SL-rGO-AF/PDMS composite. (b) Schematic fabrication procedure of ML-rGO-AF/PDMS composite.

2.3 Characterization of materials

The calculation of volume density of samples is based on weight and volume measurements. The weight was measured with a precision electronic analytical balance (PEAB, XS105DU, METTLER TOLEDO, Switzerland) and the dimensions by screw gauge measurements. The morphology and microstructure were observed using a field emission scanning electron microscope (FE-SEM, S-4800, HITACHI, Japan) operated at 10 kV, as well as a transmission electron microscope (TEM, JEM-2100F, JEOL, Japan) at 200 kV.

Laser Raman spectroscopic measurements were performed using a HORIBA Jobin Yvon LabRAM HR Evolution Raman spectrometer with He–Ne laser excited at 632.8 nm and under the power of 150 μW cm−2. X-ray photoelectron spectroscopy (XPS) measurements were carried out by Axis Ultra imaging photoelectron spectrometer (Kratos Analytical Ltd., Japan) with a monochromatic Al Kα X-ray source at 225 W.

The EMI shielding effectiveness of composites was measured at X band (8.2–12.4 GHz) using a vector network analyzer (VNA, E8363C, Agilent). The samples were cut into 22.90 × 10.20 mm2 pieces to fit exactly into the rectangular waveguide (WR90). The sample holder was placed between the flanges of the waveguide connected between the two ports of VNA. A full two port calibration was performed using a quarter wavelength offset and terminations were keeping input power level at −17 dBm.

The total EMI shielding effectiveness (SEtot) of a material is defined as the logarithmic ratio of incident power (Pi) to the transmitted power (Pt), i.e. SEtot = 10[thin space (1/6-em)]log(Pi/Pt). For commercial applications, it must reach up to 20 decibel (dB), meaning only 1% transmitted electromagnetic wave. The SEtot is the sum of the effectiveness of all attenuating mechanisms including absorption (SEA), reflection (SER) and the multiple reflections (SEM), and can be expressed as SEtot = SEA + SER + SEM. SEM is negligible when SEtot ≥ 15 dB.

3. Result and discussion

3.1 Morphology and reduction mechanisms

The schematic procedure for fabricating rGO-AF/PDMS composite is illustrated in Fig. 2. Firstly, since the reduction potential of GO/rGO (−0.4 V vs. standard hydrogen electrode (SHE) at PH = 4) is higher than that of Zn/Zn2+ (−0.76 vs. SHE),22,23 the interfacial gelation follows the reaction equation in an acidic medium, i.e. GO + Zn + H+ → rGO + Zn2+ + H2O. Because of the lower reduction potential of Zn, electrons were steadily transferred to GO sheets close to the Zn foil surface, while Zn atoms were ionized. The free Zn2+ attracted the electronegative GO sheets to tightly lean on Zn surface. Then the reduction of GO sheets occurred spontaneously based on the above reaction equation. As time went on, the rGO sheets were piled up, forming a layer-by-layer structure. Owing to the residual hydrophilic oxygen functional groups on the rGO basal plane, the water molecules can be absorbed by hydrogen-bond interaction to enable strong repulsive hydration forces between rGO sheets.24 Thus, the stacking rGO sheets are not as tight as their counterparts in graphite.
image file: c6ra20976a-f2.tif
Fig. 2 Schematic fabrication procedure of rGO-AF/PDMS composite.

Fig. 3a and b suggest that the rGO sheet is on the order of 8–10 μm in surface size and 5–10 layers in thickness, and is transparent with some wrinkles and ripples. By the vacuum freeze-drying, the inter-sheet repulsive forces disappeared, resulting in an approximately 30% shrinkage along the thickness direction of the aerogel.21 Cross-sectional SEM image of freeze-dried rGO-AF (Fig. 3c) shows that the rGO sheets form an interconnected porous network structure. The pore size ranges from few tens of nanometers to several micrometers. Owing to the porous structure, the rGO-AFs are ultra-light, but fragile. Hence, the preparation rGO-AF/PDMS composite is very careful by infiltrating diluted PDMS into rGO-AF. As shown in Fig. 3d, the SL-rGO-AF/PDMS composite obtained is flexible and elastic.


image file: c6ra20976a-f3.tif
Fig. 3 (a and b) TEM images of rGO sheets. (c) Cross-sectional SEM image of rGO-AF. (d) Digital image of SL-rGO-AF/PDMS composite.

In Table 1, it is remarked that the thickness of both rGO-AF and SL-rGO-AF/PDMS composites increases with the gelation time. By contrast, their density decreases with gelation time, meaning the increase of porosity. The density of ML-rGO-AF5/PDMS composites decreases progressively with the number of layer or thickness of samples as given in Table 2.

Table 1 Physical properties of samples (2 cm × 2 cm in surface size)
Gelation time (h) rGO-AFs SL-rGO-AFs/PDMS composite
Weight (mg) Thickness (mm) Density (g cm−3) Weight (mg) Thickness (mm) Density (g cm−3)
1 2.268 0.085 0.067 18.478 0.151 0.306
2 2.936 0.173 0.042 24.633 0.234 0.263
3 3.638 0.245 0.037 24.245 0.309 0.196
4 3.990 0.304 0.033 27.776 0.371 0.187
5 4.106 0.353 0.029 27.080 0.429 0.158


Table 2 Physical properties of ML-rGO-AF5/PDMS composite (2 cm × 2 cm in surface size)
Number of layers Weight (mg) Thickness (mm) Density (g cm−3)
1 27.080 0.429 0.158
2 42.614 0.715 0.149
3 55.305 0.947 0.146
4 66.447 1.249 0.133
5 75.494 1.547 0.122


The oxygen content of GO determined by low-resolution scanning XPS is 55.94 at%, while that of rGO-AF5 reduces to 24.63 at%, i.e. its carbon content is as high as 75.37 at% after the zinc reduction process. The contrastive XPS C1s spectra of GO and rGO-AF5 (Fig. 4a) show three peaks for graphitic structure (C–C/C[double bond, length as m-dash]C at 284.8 eV), hydroxyl/epoxy groups (C–O at 286.2 eV), and carbonyl group (O–C[double bond, length as m-dash]O at 288.4 eV). Compared with GO, sharp decrease of the peak intensities for C–O and C[double bond, length as m-dash]O bonds is noticed for rGO-AF5, indicating a high level reduction degree of GO through interfacial gelation. Furthermore, the evolution of carbon bonds is also quantified as given in Table 3. It is apparent that the carbon sp2 fraction increases with the progress of reduction, while the content of oxygen-containing functionalities decreases.


image file: c6ra20976a-f4.tif
Fig. 4 (a) XPS C1s and (b) Raman spectra of GO and rGO-AF5.
Table 3 Fitted binding energy (B.E.) and atomic ratio (at%) of GO and rGO-AF5
B.E. (eV) C1 (284.8) C2 (286.2) C3 (288.4)
Assignment C–C/C[double bond, length as m-dash]C C–O O–C[double bond, length as m-dash]O
GO 39.90 53.85 6.24
rGO-AF5 70.63 23.99 5.38


Fig. 4b shows the Raman spectra of GO and rGO-AF5, two characteristic peaks appear at ∼1348 cm−1 and ∼1594 cm−1, corresponding to D and G bands of graphene, respectively. The ratio of ID/IG rises from 0.88 of GO to 1.84 of rGO-AF5, meaning an increase in structural defects which is attributable to desorption of oxygen bonded saturated sp3 carbons as CO2 and/or CO (especially from epoxy groups).25 It is especially necessary to remove the oxygen contained in the GO in the reduction process, as sp2 clusters in GO are separated by oxygen atoms and a reduction by removal of O generates greater connectivity among the existing graphitic domains by the increased sp2 cluster.25,26 From the above results, it is deduced that the rGO-AF5 underwent a high level reduction after gelation.

3.2 EMI shielding effectiveness of SL-rGO-AF/PDMS composite

Fig. 5 shows SEtot of SL-rGO-AF/PDMS composites and pure PDMS measured at X band. A pure PDMS film with a thickness of ∼0.3 mm is obviously transparent to electromagnetic waves, exhibiting almost no shielding capability (Fig. 5, inset). However, the SL-rGO-AF/PDMS composites show much higher SEtot with highest value of 20–23 dB, suggesting an excellent EMI shielding performance. Generally, the SER of a shielding material depends on the impedance of the shield (Z1) and the medium (Z0) where incident electromagnetic waves travel.17 Therefore, the rGO-AFs with higher electrical conductivity exhibit lower impedance, thus showing greater impedance mismatch (Z0/Z1) and higher reflection. In contrast, the SEA of rGO-AF/PDMS composites enhances with increasing thickness, which is mainly attributed to the increased amount of surfaces or interfaces with longer gelation time. The thickness of rGO-AFs increases gradually with gelation time (Table 1), producing more surfaces or interfaces in the aerogel film. Incident electromagnetic waves entering the rGO-AF/PDMS composite are reflected and scattered many times between the surfaces or interfaces of rGO sheets until they are absorbed and converted to heat. Therefore, thicker rGO-AFs with more internal surfaces or interfaces exhibit better absorption performance.
image file: c6ra20976a-f5.tif
Fig. 5 Total EMI shielding effectiveness (SEtot) of rGO-AF/PDMS composites (inset is PDMS film).

As shown in Fig. 6a, it is obviously that the SER decreases with the frequency increasing. It can be seen from the inset of Fig. 6a that the external surface of rGO-AF is uneven and has some micron-sized pores. The high-frequency electromagnetic waves possess short wavelength, thus can travel into composites easily and weaken the microwave reflection. Meanwhile, as the frequency increases, more high-frequency electromagnetic waves are attenuated by absorption, so, SEA increases (Fig. 6b).


image file: c6ra20976a-f6.tif
Fig. 6 (a and b) Reflection (SER) and absorption (SEA). (c and d) Comparison of SEtot, SER, and SEA at 9 GHz and 12 GHz of SL-rGO-AF/PDMS composites.

Fig. 6c and d show SEtot, SER and SEA of the rGO-AF/PDMS composites as a function of gelation time at 9 GHz and 12 GHz, respectively. It is noted that the contribution of reflection to the SEtot is larger than that of absorption at 9 GHz, while it is inversed at 12 GHz. For the rGO-AF5/PDMS composite, SEtot, SER and SEA at 9 GHz are 22, 13 and 9 dB, respectively. At 12 GHz, they are 20, 7 and 13 dB, respectively. These results suggest that rGO-AF/PDMS composites are both reflective and absorptive to electromagnetic irradiation at X band, and reflection is the dominant shielding mechanism at low frequency, while it is absorption at high frequency. In other words, reflection and absorption complement each other at X band.

3.3 EMI shielding effectiveness of ML-rGO-AF5/PDMS composites

The multilayer structure of 5L-rGO-AF5/PDMS composite is well shown in Fig. 7a. It can be clearly seen that five rGO-AF5 films are well embedded in PDMS matrix. As expected, the ML-rGO-AF/PDMS composites exhibit a much better EMI shielding performance than SL-rGO-AF/PDMS composites and the highest SEtot of 5L-rGO-AF5/PDMS composite reaches up to 53 dB (Fig. 7b).
image file: c6ra20976a-f7.tif
Fig. 7 (a) SEM image of 5L-rGO-AF5/PDMS composite. (b) EMI SEtot of ML-rGO-AF5/PDMS composites.

Fig. 8a shows SEtot, SEA and SER at 9 GHz of ML-rGO-AF5/PDMS composites as a function of the number of rGO-AF5 layers. It can be seen that, as the number of layers increases, both SEtot and SEA increase while SER remains almost unchanged. Furthermore, it is noted that the contribution of SEA to SEtot is much larger than that of SER when the number of layers is greater than two. By taking 5L-rGO-AF5/PDMS composite as an example, the EMI shielding mechanism is further clarified at X band as shown in Fig. 8b. SEA and SER exhibit moderate increase and decrease with the frequency, respectively. The SEtot increases from 47 to 53 dB, weakly dependent on the frequency. These results suggest that the increased number of rGO-AF5 layers has little impact on the reflection efficiency of the rGO-AF5/PDMS composite. However, it can remarkably improve the absorption efficiency which turns into the dominant shielding factor.


image file: c6ra20976a-f8.tif
Fig. 8 (a) Comparison of SEtot, SER, and SEA of ML-rGO-AF5/PDMS composites at 9 GHz. (b) SEtot, SER, and SEA of 5L-rGO-AF5/PDMS composite.

In order to give a more appropriate and reasonable comparison of EMI SE among different kinds of materials, the specific EMI shielding effectiveness (SE divided by density) is calculated and given in Table 4. The 5L-rGO-AF5/PDMS composite with a density of ∼0.122 g cm−3 shows a superior specific EMI shielding effectiveness of ∼385–434 dB cm3 g−1 at X band.

Table 4 Comparison of shielding properties of different materials at X band
Materials Filler content SEtot (dB) Specific SEtot (dB cm3 g−1) Reference
Copper nanowires/PS 2.1 vol% 35 27
MWCNT/fluorocarbon foam 12 wt% 42–48 28
Colloidal graphite/polyaniline 17.4 wt% 40 29
Graphite/polyaniline 15.6 wt% 34 30
CNT/PS foam 7 wt% 19 33 4
Graphene/epoxy 15 wt% 21 31
Graphene/PVDF foam 7 wt% 28 32
CDG/PMMA foam 5 wt% 19 17–25 14
Graphene/PDMS foam 0.8 wt% 20 333 19
5L-rGO-AF5/PDMS 21.7 wt% ∼47–53 ∼385–434 This work


4. Conclusion

In summary, a series of novel composites composed of reduced graphene oxide aerogel film (rGO-AF) and polydimethylsiloxane (PDMS) matrix were designed and fabricated by simple procedure of metal reduction, freeze-drying and stacking. Their microstructures, EMI shielding effectiveness and mechanisms are measured and analyzed. It is found that the composites are lightweight and flexible due to the interconnected network of rGO. The density changes from 0.158 g cm−3 to 0.122 g cm−3 for a single layer and five layer rGO-AF/PDMS composites, respectively. The best performance of shielding effectiveness reaches 53 dB at X band for a sample of 1.547 mm in thickness. Besides, the specific shielding effectiveness is as high as 434 dB cm3 g−1, which surpasses the highest values for most metals and carbon-based composite materials. In addition, it is revealed that the absorption is the dominant factor for high shielding effectiveness, especially at high frequency range. The new method proposed in this work can be used to fabricate lightweight, flexible and high-performance EMI shielding composites. They have good potential to be applied in aerospace, wearable electronic devices and other related areas.

Abbreviations

B.E.Binding energy
dBDecibel
EMIElectromagnetic interference
FE-SEMField emission scanning electron microscope
GOGraphene oxide
MLMultilayer
PDMSPolydimethylsiloxane
PEABPrecision electronic analytical balance
PETPolyethylene glycol terephthalate
PiIncident power
PMMAPolymethylmethacrylate
PtTransmitted power
rGOReduced graphene oxide
rGO-AFReduced graphene oxide aerogel film
SEAThe absorption of EMI shielding effectiveness
SEMThe multiple reflection of EMI shielding effectiveness
SERThe reflection of EMI shielding effectiveness
SEtotThe total EMI shielding effectiveness
SLSingle-layer
TEMTransmission electron microscope
VNAVector network analyzer
XPSX-ray photoelectron spectroscopy
Z0The impedance of the medium
Z1The impedance of the shield

Acknowledgements

The authors would like to thank the support by NSFC and NSFC-RGC Joint Research Scheme (No. 11272008, 11361161001, CUHK450/13).

References

  1. N. Li, Y. Huang, F. Du, X. B. He, X. Lin, H. J. Gao, Y. F. Ma, F. F. Li, Y. S. Chen and P. C. Eklund, Nano Lett., 2006, 6, 1141–1145 CrossRef CAS PubMed.
  2. J. M. Thomassin, C. Pagnoulle, L. Bednarz, I. Huynen, R. Jerome and C. Detrembleur, J. Mater. Chem., 2008, 18, 792–796 RSC.
  3. H. Yang, M. Cao, Y. Li, H. Shi, Z. Hou, X. Fang, H. Jin, W. Wang and J. Yuan, Adv. Opt. Mater., 2014, 2, 214–219 CrossRef.
  4. Y. L. Yang and M. C. Gupta, Nano Lett., 2005, 5, 2131–2134 CrossRef CAS PubMed.
  5. D. D. L. Chung, Carbon, 2001, 39, 279–285 CrossRef CAS.
  6. Y. Yang, M. C. Gupta, K. L. Dudley and R. W. Lawrence, Adv. Mater., 2005, 17, 1999–2003 CrossRef CAS.
  7. B. Fugetsu, E. Sano, M. Sunada, Y. Sambongi, T. Shibuya, X. Wang and T. Hiraki, Carbon, 2008, 46, 1256–1258 CrossRef CAS.
  8. M. H. Al-Saleh and U. Sundararaj, Carbon, 2009, 47, 1738–1746 CrossRef CAS.
  9. B. P. Singh, Prabha, P. Saini, T. Gupta, P. Garg, G. Kumar, I. Pande, S. Pande, R. K. Seth, S. K. Dhawan and R. B. Mathur, J. Nanopart. Res., 2011, 13, 7065–7074 CrossRef CAS.
  10. T. K. Gupta, B. P. Singh, S. Teotia, V. Katyal, S. R. Dhakate and R. B. Mathur, J. Polym. Res., 2013, 20, 169 CrossRef.
  11. P. Annadurai, A. K. Mallick and D. K. Tripathy, J. Appl. Polym. Sci., 2002, 83, 145–150 CrossRef CAS.
  12. F. El-Tantawy, K. Kamada and H. Ohnabe, Polym. Int., 2002, 51, 635–646 CrossRef CAS.
  13. J. Wu and D. D. L. Chung, Carbon, 2003, 41, 1313–1315 CrossRef CAS.
  14. H. B. Zhang, Q. Yan, W. G. Zheng, Z. He and Z. Z. Yu, ACS Appl. Mater. Interfaces, 2011, 3, 918–924 CAS.
  15. T. K. Gupta, B. P. Singh, R. B. Mathur and S. R. Dhakate, Nanoscale, 2014, 6, 842–851 RSC.
  16. W.-L. Song, L.-Z. Fan, M.-S. Cao, M.-M. Lu, C.-Y. Wang, J. Wang, T.-T. Chen, Y. Li, Z.-L. Hou, J. Liu and Y.-P. Sun, J. Mater. Chem. C, 2014, 2, 5057 RSC.
  17. W.-L. Song, M.-S. Cao, M.-M. Lu, S. Bi, C.-Y. Wang, J. Liu, J. Yuan and L.-Z. Fan, Carbon, 2014, 66, 67–76 CrossRef CAS.
  18. F. Shahzad, M. Alhabeb, C. B. Hatter, B. Anasori, S. M. Hong, C. M. Koo and Y. Gogotsi, Science, 2016, 353, 1137–1140 CrossRef CAS PubMed.
  19. Z. Chen, C. Xu, C. Ma, W. Ren and H. M. Cheng, Adv. Mater., 2013, 25, 1296–1300 CrossRef CAS PubMed.
  20. W. S. Hummers Jr and R. E. Offeman, J. Am. Chem. Soc., 1958, 80, 1339 CrossRef.
  21. Z.-K. Wu, Z. Lin, L. Li, B. Song, K.-s. Moon, S.-L. Bai and C.-P. Wong, Nano Energy, 2014, 10, 222–228 CrossRef CAS.
  22. U. N. Maiti, J. Lim, K. E. Lee, W. J. Lee and S. O. Kim, Adv. Mater., 2014, 26, 615–619 CrossRef CAS PubMed.
  23. X. Mei and J. Ouyang, Carbon, 2011, 49, 5389–5397 CrossRef CAS.
  24. X. Yang, L. Qiu, C. Cheng, Y. Wu, Z. F. Ma and D. Li, Angew. Chem., 2011, 50, 7325–7328 CrossRef CAS PubMed.
  25. C. Mattevi, G. Eda, S. Agnoli, S. Miller, K. A. Mkhoyan, O. Celik, D. Mastrogiovanni, G. Granozzi, E. Garfunkel and M. Chhowalla, Adv. Funct. Mater., 2009, 19, 2577–2583 CrossRef CAS.
  26. H. L. Wang, J. T. Robinson, X. L. Li and H. J. Dai, J. Am. Chem. Soc., 2009, 131, 9910–9911 CrossRef CAS PubMed.
  27. V. Eswaraiah, V. Sankaranarayanan and S. Ramaprabhu, Macromol. Mater. Eng., 2011, 296, 894–898 CrossRef CAS.
  28. M. H. Al-Saleh, G. A. Gelves and U. Sundararaj, Composites, Part A, 2011, 42, 92–97 CrossRef.
  29. A. Fletcher, M. C. Gupta, K. L. Dudley and E. Vedeler, Compos. Sci. Technol., 2010, 70, 953–958 CrossRef CAS.
  30. P. Saini, V. Choudhary and S. K. Dhawan, Polym. Adv. Technol., 2009, 20, 355–361 CrossRef CAS.
  31. P. Saini, V. Choudhary, K. N. Sood and S. K. Dhawan, J. Appl. Polym. Sci., 2009, 113, 3146–3155 CrossRef CAS.
  32. J. Liang, Y. Wang, Y. Huang, Y. Ma, Z. Liu, J. Cai, C. Zhang, H. Gao and Y. Chen, Carbon, 2009, 47, 922–925 CrossRef CAS.

This journal is © The Royal Society of Chemistry 2016