DOI:
10.1039/C6RA20778B
(Paper)
RSC Adv., 2016,
6, 89328-89337
Reducing Li-diffusion pathways via “adherence” of ultra-small nanocrystals of LiFePO4 on few-layer nanoporous holey-graphene sheets for achieving high rate capability†
Received
18th August 2016
, Accepted 13th September 2016
First published on 13th September 2016
Abstract
Olivine structured lithium iron phosphate, LiFePO4 (LFP), is a promising alternative cathode material due to its high theoretical capacity (170 mA h g−1), low cost and higher environmental compatibility. However, due to its poor electronic conductivity and Li+-ion diffusivity the electrochemical performance of LFP deteriorates with increasing charge/discharge rates. Networking of downsized LFP particles with an improperly chosen carbon conduit may not effectively reduce the Li+-ion diffusion pathways and improve electron transport. We demonstrate here a unique 3D configuration comprising ultra-small LFP particles (size: 5 ± 2 nm) “adhered” to few-layer reduced holey-graphene oxide sheets (h-GO) that allows Li+-ions to traverse shorter non-tortuous pathways. The h-GO sheets, which are only ≤1% of the total weight of the LFP-carbon assembly, contain micro (≈1.1–1.9 nm) to meso (≈2.8–13.9 nm) scale sized chemically punctured holes and hence the probability of their blockage by the ultra-small LFP nanocrystals is negligible. On the other hand, a higher content of sp2-carbon in h-GO compared to graphene oxide (GO) simultaneously provides excellent electronic conductivity. The assembly of adhered monodispersed LFP nanocrystals on h-GO sheets displayed theoretical capacity (over nearly 1000 cycles) and extremely high rate performance at widely varying current densities (0.1–10C). Choice of h-GO leads to an increase in the lithium diffusion, DLi+ in the LFP-h-GO by nearly two orders compared to the composite of LFP with non-porous graphene oxide (GO). The novel electrode architecture discussed here, which specifically exploits tweaking the charge transport pathways at small length scales (∼nm), will also be highly applicable for electrodes of relevance to various battery chemistries and supercapacitors.
1. Introduction
Extremely rapid depletion in global fossil fuel stocks due to uncontrolled consumption by mankind has led to severe detrimental implications on the environment and sustainable growth. This has necessitated the need for the efficient harness of energy from sustainable sources such as solar, wind, hydro, wave and geothermal.1,2 It is now well recognized that harnessing energy from such intermittent natural sources needs to be integrated with energy storage devices for high value commercial applications. The rechargeable batteries based on lithium, especially Li+-ions have been demonstrated to be a very promising energy storage device.3–7 To meet the ever growing demand for high performance and safety for utilities across various platforms, electroactive components of the Li+-ion battery need to perform at the highest levels of efficiency and stability. The olivine structured lithium iron phosphate, LiFePO4 (LFP) exhibit high stable capacity and is an important alternative to the layered LiCoO2 and spinel LiMn2O4.8–11 Due to high abundance of iron, LFP is expected to be economical and its synthesis will be relatively easier to scale up for high production yields.12–15 Additionally, the Fe3+/Fe2+ redox couple is near about 3.5 V (with respect to Li+/Li) which will further enhance the carbonate based liquid electrolyte stability. In spite of these advantageous features, mass scale production of Li+-ion batteries using LFP as the cathode has not yet materialized.15,16 This is primarily attributed to the poor electronic conductivity (∼10−9 Ω−1 cm−1)11 and lithium ion diffusivity,16 which limits its performance as a function of widely varying currents. Broadly, the detrimental features related to ion and electron transport have been attempted by downsizing17–19 and carbon coating of the particles respectively.20–23 While the main motivation to downsize particle has been to reduce the diffusion path length for the Li+-ions (mainly inside the LFP crystallites), the conductive component is for providing facile pathways for the electrons during repeated charge and discharge. However, syntheses based on the above strategies are often not optimized and lead to several shortcomings in the LFP-carbon microstructure and electrochemical performance. Syntheses strategies involving in situ growth of a (carbon) conductive layer on the LFP particle are generally non-uniform leading to limitations in LFP rate capability. Additionally, non-optimized spatial configuration of small LFP particles with carbon may not necessarily lead to reduction in the Li+-ion pathways external to the LFP crystallites. All these amounts to the requirement of additional carbon black and insulating binder during the electrode assembly leading to poor packing density, cyclability and rate capability.24 So, newer approaches for LFP electrode design are necessary for it to be employed as cathodes in mass-scale commercial high rate capability Li-ion batteries.
Graphene, due to its high surface area, excellent electronic conductivity and ease of (chemical) synthesis, has often been considered as an electronic conduit in several battery electrodes including LFP. Fair enhancement in LFP capacity has been reported using reduced graphene oxide (rGO) as an additive.25–27 Composites of LFP-rGO have been prepared by mechanical mixing or pyrolyzing the graphene oxide (GO)/rGO with LFP precursors or LFP particles.28 The graphene content in such composites vary from (5–25)%.25–27 The enhancement in capacity is attributed to the enhancement in rate of electron transfer facilitated by the rGO. However, Li+-ion cannot pass through the carbon atomic arrays in the two-dimensional graphene sheets and has to detour tortuously to reach the electrolyte and vice versa. The effective diffusion path of Li+-ion in LFP thus, becomes even longer resulting in poor charge–discharge rate performance and limiting the capacity much below the theoretical limit of LFP (170 mA h g−1). Ha et al. has shown that a composite of LFP with chemically activated porous graphene (10%) can result in enhanced rate capability for LFP.29 However, the initial capacity reported in ref. 29 are much below that of the theoretical value. We discuss here a composite comprising of nano-crystalline LFP particles adhered on to the surface of few layer “holey” graphene (h-GO). This unique spatial configuration allows Li+-ions to traverse shorter non-tortuous pathways leading to high rates of diffusion and deliver nearly theoretical capacity and superior rate performance with only 1% of h-GO in the LFP-h-GO.
2. Results and discussion
2.1. Main motivation of the work
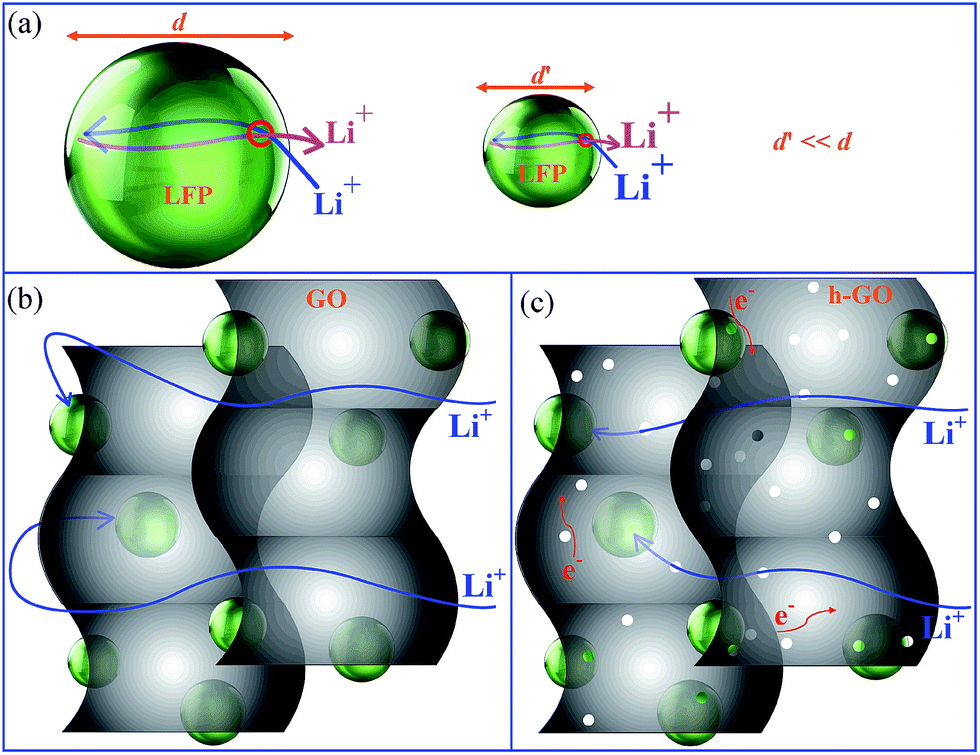
The main aim of the present work is to design an optimally configured 3D-LFP carbon composite cathode with drastically reduced Li+-ion diffusion pathways. Achieving this goal is expected to result in high current rate capability as well as obtain the desired theoretical capacity. Scheme 1a summarizes our design strategy. To start with, the LFP particles are downsized. This reduces the diffusion path traversed by Li+-ion only within the LFP crystallites. However, downsizing may not ensure an optimal spatial configuration among the LFP particles and also with the network of carbon particles. Improper arrangement often leads to poor charge kinetics, spatial packing and usage of higher quantities of carbon black and binder during the electrode assembly. Instead, graphene network is a better choice as it may adhere several of the small LFP particles together and also provide effectively superior electrical wiring to the LFP particles. In this way an extended and percolating particle to particle as well as particle to graphene electron transport pathways (Scheme 1b) is established. However, as Li+-ion cannot traverse through the carbon atomic arrays in the 2D graphene sheet, it detours tortuously to reach the electrolyte and vice versa. Thus, the diffusion paths for Li+-ion in the LFP-graphene composite electrode is not reduced and is effectively still long (Scheme 1b). We show here that holey-reduced graphene oxide (h-GO) is a better alternative than non-porous GO or rGO to adhere tiny LFP particles as it provides shorter non-tortuous pathways for the Li+-ions to reach the electrolyte and vice versa (Scheme 1c).
 |
| | Scheme 1 Schematic representation showing (a) shorter Li+-ion diffusion path in small LFP-particle, (b) Li+-ion detours tortuously longer path in LFP-1GO composite and (c) shorter diffusion path travel by Li+ ion in LFP-h-GO. | |
The composite, LFP-xh-GO (x corresponding to weight percentage of h-GO) is synthesized in three steps viz., first synthesis of LFP-C followed by synthesis of h-GO and finally the LFP-xh-GO composite (cf. Materials and methods in ESI†). The h-GO is synthesized by KOH treatment of graphene oxide (GO) followed by annealing it at ∼800 °C. The KOH reacts with GO via the reaction 6KOH + C ↔ 2K + 3H2 + 2K2CO3 followed by the decomposition of K2CO3 and/or reaction of K/K2CO3/CO2 with carbon. The intercalation of metallic K into the carbon lattices leads to lattice expansion and it's subsequent removal during washing further accelerates the chemical activation process.30 LFP-C following its synthesis is repeatedly washed by re-dispersing and ultra-sonication in DMF. It is further sonicated after mixing with h-GO. The h-GO is not added directly into the reaction mixture of LFP precursors for obtaining the composite. Instead it is blended with the pre-synthesized LFP-C. This is done to prevent blocking of the pores in h-GO and also sustain facile electron pathways. A range of compositions of LFP-xh-GO are made with x = 0.5%, 1%, 2% and 5%. However, as LFP-1h-GO (density = 3.3 g cm−3) shows the best half-cell performance in terms of Li+-ion storage capacity at varying currents, subsequent discussion will focus only on this composition. It is worth mentioning here that the total amount of carbon in LFP-1h-GO is about 6% (all carbon forms) of the total composite mass (Fig. S1†).
2.2. Structure and morphology of h-GO
The surface area and pore size distribution (PSD) of h-GO are obtained from the N2 (77.4 K) adsorption/desorption isotherm (cf. Fig. S2†) which shows hysteresis loop ranging from P/P0 of 0.4–1. This indicates the existence of both the micro (<2 nm) and meso (2–50 nm) pores in h-GO. The Brunauer–Emmett–Teller (BET) specific surface area and pore size distribution of h-GO are analyzed by the hybrid nonlocal density functional theory (NLDFT) method.31–33 The high value of BET specific surface area of ∼2250 m2 g−1 as attained for h-GO is attributed to the optimum synthesis parameters of h-GO viz. the ratio of KOH to GO, reaction synthesis and washing protocols. The PSD analysis (cf. Fig. 1a) also show hierarchical pore distribution from micropores to mesopores with major intensity peaks at 1.2, 2.8 and 3.7 nm. The broad distribution of in-plane mesopores (2.8–13.9 nm) is very beneficial for the easy diffusion of both the Li+-ion and the electrolyte. The information about the atomic structure and interlayer spacing of GO and h-GO are obtained from the powder X-ray diffraction (PXRD) patterns (Fig. S3a†). The increase in d-spacing and the shift of (002) basal reflection to a lower angle ≈10° in GO from 26.6° in graphite is an indication of oxidation of graphite. The increase in d-spacing is explained on the basis of intercalation of water molecules and the formation of oxygen-containing functional groups between the layers of graphite.34 However, the elimination of the peak at ≈10° and appearance of broad peaks at around 25° and 43° (which are very close to the (002) and (100) reflections of graphite) following KOH treatment and annealing, strongly indicates its reduction and conversion to hexagonal graphitic structures. The drastic reduction in intensity and broadening of (002) peak in h-GO as compared to GO may also indicate that h-GO is predominantly consisting of single-carbon sheets. The tapping mode atomic force microscopy (AFM) image (Fig. 1b) shows a sheet of h-GO with a lateral width of around 70 μm whereas the thickness of the sheet (obtained from the height profile (Fig. 1c) is only 1.7 nm. Considering the interlayer spacing to be 0.335 nm between the graphene sheets in graphite,35 this corresponds to only 4–5 layers of graphene in h-GO. The surface of h-GO is rougher compared to the GO (Fig. 1c and d).36 The roughness of even few nanometers on the h-GO sheet (Fig. 1c and d) is attributed to the defects (hollow network) created due to the chemical activation followed by high temperature annealing. This roughness is however, very much advantageous to adhere the LFP particles on h-GO surface. The field emission scanning electron microscopy (FESEM) image of h-GO (Fig. 1e) indicates morphology similar to wrinkled and scrolled cloth stacked side by side when viewed from the edges. BF-TEM image (Fig. 1f) also confirms rough morphology resembling a scouring pad. The h-GO roughness is of much higher degree as compared to GO (Fig. S3b†). The influences of the KOH activation process can be observed by focusing on a small portion of non-activated GO which can be observed on the edge of h-GO (Fig. S4† and inset: Fig. 1f). The high resolution TEM (HRTEM) images also reveal the fact that the h-GO (Fig. 2a) is having a rougher surface than GO (Fig. 2b) and the observation in the BFTEM images of h-GO (Fig. 1f) are not surface roughness but is in fact due to pores. Micro/meso-pores are distributed all over the surface (also evidenced by PSD for their probability of occurrence (Fig. 1a) and most-pronounced are encircled in Fig. 2a. Larger mesopores of sizes in the range of 7–13.9 nm are rare which is also in accordance with the PSD pattern of h-GO (Fig. 1a). The photograph of the h-GO dispersion in water (inset: Fig. 2a) is black in color as compared to GO (inset: Fig. 2b) which is yellowish brown). The lower water dispersivity of h-GO compared to GO and a change in color is a clear indication of the reduction of GO and elimination of oxygen functionalities from it. The microscopic observations clearly reveal that KOH does not fully digest the GO (Fig. S3b†); instead restructures it by etching and generating 3D-dimensional (3D) distribution of mesopores and micropores. The thermogravimetric analysis (Fig. S5†) shows high stability of h-GO with retention of 80% of its initial weight up to a temperature of 650 °C.
 |
| | Fig. 1 (a) Pore size distribution, (b) atomic force microscopy (AFM) image, (c) the height profile measured along the indicated line in (b), (d) the 3D view of image in (b), (e) scanning electron microscopy (SEM) image and (f) transmission electron microscopy (TEM) image (inset: remains of unreacted portion of GO) of h-GO. | |
 |
| | Fig. 2 High resolution transmission electron microscopy (HRTEM) images of (a) h-GO (inset: photograph of h-GO dispersion in water) and (b) GO (inset: photograph of GO dispersion in water). | |
2.3. Structural characterization of LFP-h-GO
The X-ray photoelectron spectroscopy (XPS) data of h-GO and LFP-1h-GO are shown in Fig. 3. While the C–O, C![[double bond, length as m-dash]](https://www.rsc.org/images/entities/char_e001.gif) O and OC–OH peaks (from C 1s) appear at 285.9 eV, 287.8 eV and 288.6 eV respectively in GO (Fig. 3i(a)), appear at 286.1 eV (C–O) and 287.6 eV (CO) in h-GO with vastly reduced intensity (Fig. 3i(b)). The CC (284.4 eV) peak, which is not a strong peak in GO, emerges as a unique intense peak in h-GO (284.4 eV). This strongly suggests the reduction and elimination of oxygen functionalities in h-GO. The presence of peak at 284.4 eV (CC) along with the π → π* (290.6 eV) shake-up satellite peak (characteristics of aromatic or conjugated system; Fig. 3i(b)) confirms that the sp2 carbon network is retained in h-GO.37 The LFP-1h-GO shows a C 1s spectrum (cf. Fig. 3i(c)) very similar to that of h-GO, confirming the presence of h-GO in the composite. The difference in Fe 2p binding energies of nearly 13 eV between the Fe 2p3/2 (711.7 eV) and Fe 2p1/2 (725.3 eV) (Fig. 3ii) in LFP-h-GO indicates that Fe is predominantly in the +2 oxidation state.38–40 This is further supported by the absence of satellite peak at around 715 eV (Fe3+) (cf. Fig. 3ii) in LFP-C or LFP-1h-GO. A single Gaussian fit to P 2p peak (centered at 133.4 eV) with a full width at half maximum of 1.8 eV (Fig. 3iii) is typical for P atom bonded to oxygen in +5 oxidation state (PO43− group).41,42 Thus, the LFP in LFP-1h-GO is pure in the pristine state and does not undergo any oxidation and is free of impurities such as iron oxide or iron phosphide. The Fe/P atomic ratio is obtained to be 1.02, further confirming the compound stoichiometry of LiFePO4.
O and OC–OH peaks (from C 1s) appear at 285.9 eV, 287.8 eV and 288.6 eV respectively in GO (Fig. 3i(a)), appear at 286.1 eV (C–O) and 287.6 eV (CO) in h-GO with vastly reduced intensity (Fig. 3i(b)). The CC (284.4 eV) peak, which is not a strong peak in GO, emerges as a unique intense peak in h-GO (284.4 eV). This strongly suggests the reduction and elimination of oxygen functionalities in h-GO. The presence of peak at 284.4 eV (CC) along with the π → π* (290.6 eV) shake-up satellite peak (characteristics of aromatic or conjugated system; Fig. 3i(b)) confirms that the sp2 carbon network is retained in h-GO.37 The LFP-1h-GO shows a C 1s spectrum (cf. Fig. 3i(c)) very similar to that of h-GO, confirming the presence of h-GO in the composite. The difference in Fe 2p binding energies of nearly 13 eV between the Fe 2p3/2 (711.7 eV) and Fe 2p1/2 (725.3 eV) (Fig. 3ii) in LFP-h-GO indicates that Fe is predominantly in the +2 oxidation state.38–40 This is further supported by the absence of satellite peak at around 715 eV (Fe3+) (cf. Fig. 3ii) in LFP-C or LFP-1h-GO. A single Gaussian fit to P 2p peak (centered at 133.4 eV) with a full width at half maximum of 1.8 eV (Fig. 3iii) is typical for P atom bonded to oxygen in +5 oxidation state (PO43− group).41,42 Thus, the LFP in LFP-1h-GO is pure in the pristine state and does not undergo any oxidation and is free of impurities such as iron oxide or iron phosphide. The Fe/P atomic ratio is obtained to be 1.02, further confirming the compound stoichiometry of LiFePO4.
 |
| | Fig. 3 (i) C 1s X-ray photoelectron spectra (XPS) of GO (a), h-GO (b) and LFP-1h-GO (c). (ii) XPS Fe 2p and (iii) P 2p spectra of LFP-1h-GO. | |
All reflections in the powder X-ray diffraction (PXRD) patterns of LFP-1h-GO and LFP-1GO (cf. Fig. S6†) can be indexed to pure and highly crystalline orthorhombic olivine structure (space group: Pnma, JCPDS no. 40-1499) of LiFePO4.43,44 The purity of the sample is also observed from the absence of reflections due to impurities like Li3PO4 as observed in earlier reports.45–47 The PXRD patterns of LFP-1h-GO and LFP-1GO are also compared with bulk LFP obtained from a commercial source (Bat-Sol, abbreviated: LFP-bat). It is observed that the PXRD patterns of the former are substantially broadened indicating smaller particle size (Fig. S6†). This strongly suggests that the LFP particles in LFP-1h-GO are very small, ∼few nm. The infrared and Raman spectra (Fig. S7, Tables ST1 and ST2†) of GO and h-GO provide clear information about the changes in surface functionalities and chemical structure as a result of KOH activation. The infrared spectrum of pristine GO (Fig. S7i(a)†) shows the characteristic oxygen functionalities such as carboxylic O–H stretch (3362 cm−1), phenolic O–H stretch (3194 cm−1), CO stretch (1724 and 1656 cm−1), carboxyl and phenolic O–H bending (1400 cm−1), epoxy C–O stretch (1225 and 1010 cm−1) and C–O–C bending of cyclic edge ether (857 cm−1). Elimination of all these bands and retention and intensification of CC stretch band of the carbon backbone (1565 cm−1) in h-GO strongly suggests that it is the chemically reduced form of GO. The O–H stretch at 3334 cm−1 in LFP-C is due to surface adsorbed water whereas O–H stretch at 3422 cm−1 with markedly reduced intensity in LFP-1h-GO is due to the presence of h-GO in it. The intensified CC stretch (1580 cm−1) in LFP-1h-GO also supports the presence of h-GO in it. This band appears as a low intensity hump in LFP-C as the sp2 carbon atoms are present in lower amount in the amorphous carbon coating on the LFP particles.48 The bands in the range (400–650) cm−1 and (900–1150) cm−1 in LFP-1h-GO which do not match with the bands of h-GO but match well with LFP-C (cf. Tables ST1 and ST2†) are assigned to the PO43− group.49 The absence of peaks at 764 cm−1, 1182 cm−1 (terminal PO3 unit) and 1271 cm−1 (M(PO3)3, M = Ga, In, etc.) further validates the purity of LFP-1h-GO sample. In the Raman spectrum of GO (Fig. S7ii(a)†), the bands at 1354 cm−1 and 1606 cm−1 corresponds to the D (arising out of the disorder induced in sp2-bonded carbon) and G (first-order scattering of the E2g phonon from sp2 carbon) bands respectively. The ratio of total area of D to G band (ID/IG) which provides indication about the degree of graphitization follows the order GO (ID/IG = 1.47) < LFP-1GO (ID/IG = 1.56) < LFP-h-GO (ID/IG = 1.67) < h-GO (ID/IG = 1.78) < LFP-C (ID/IG = 4.93) (inset: Fig. S7ii†). An increase of ID/IG ratio while going from GO (ID/IG = 1.47) to h-GO (ID/IG = 1.78) is partially due to the KOH treatment followed by annealing at high temperature of GO. These procedures results in the formation of micro and mesopores and also increases the fraction of sp3 carbons in h-GO. The increase in ID/IG ratio is also partially attributed to the increased fraction of graphene edges due to chemical reduction of GO.50 Since the ratio of 2D (2678 cm−1) to G bands intensity (I2D/IG) is related to the degree of recovery of sp2 CC bonds in graphitic structures, an increase of I2D/IG from 0.37 in GO to 0.47 in h-GO may be considered as an indication of recovery of sp2 carbon network of graphene. The recovery is expected in regions of the h-GO which are devoid of the holes. Thus, from the Raman spectroscopy it can be concluded that KOH reduction followed by annealing creates more defect free sp2 carbon atoms in h-GO. However, these sp2 domains are smaller than that in the GO thus increasing the overall structural defects in the former as compared to the latter. Defect states are expected to be formed on the periphery of the holes while maintaining sp2 bonded carbon network on non-hollow regions. Very high value of ID/IG = 4.93 for LFP-C is not a surprise and is attributed to the presence of very high quantity of sp3 disordered carbon in it (used as conductive carbon coating). The absence of LFP bands in the Raman spectrum of LFP-1h-GO under the measurement condition is accounted on the basis of screening of LFP bands by the carbon.51
2.4. Size and morphological aspect of LFP particles in LFP-h-GO
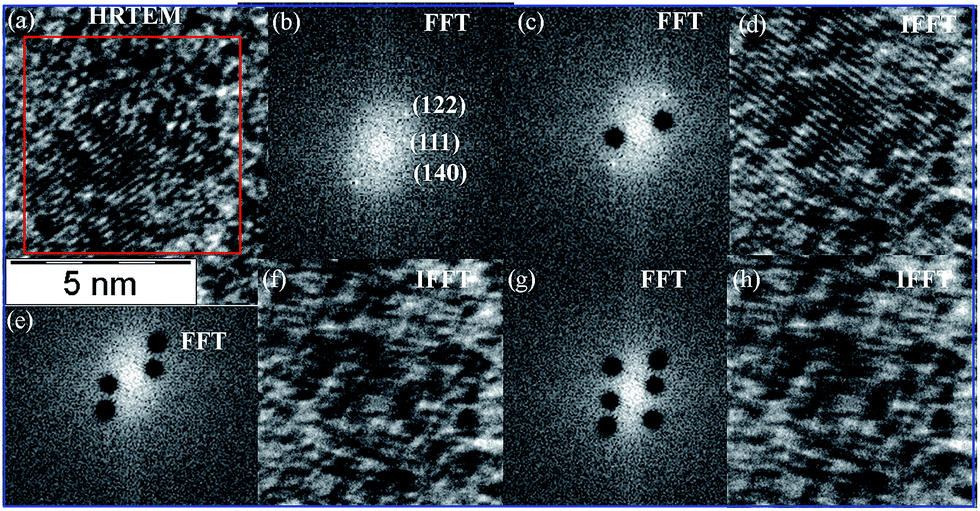
The BF-TEM images (Fig. 4a and b) of LFP-1h-GO shows that nearly mono-dispersed tiny LFP particles are adhered together by micron sized h-GO sheets. The average size of the LFP particles (calculated over 200 particles, inset: Fig. 4a) is 5 ± 2 nm. The BF-TEM image of LFP-bat (Fig. S8†) however, shows that the LFP particles are of ∼200–500 nm size which exhibits much sharper XRD pattern as compared to LFP-1h-GO (Fig. S6†). The presence of many particles in areas where h-GO is not present is not surprising as h-GO is only 1% of the LFP-1h-GO sample. However, this does not have any detrimental influence on the electrical wiring of the LFP particles. The h-GO sheets are in the order of several microns (Fig. 1b) and can accommodate innumerable ultra-small LFP particles. The small size of the LFP particles is advantageous as it is not going to block all the mesopores of the h-GO. The mesopores of h-GO range up to 14 nm. If by chance the LFP particles (rLFP) happen to block h-GO pores i.e. rLFP ≈ rh-GO, Li+-ions can still diffuse through large sized pores on the h-GO. The HRTEM images of LFP-1h-GO (Fig. 4c) show sharp atomic lattice fringes which can be indexed to several Bragg's reflections of LFP (cf. Fig. S6†), thus indicating high crystalline nature of the LFP particles in LFP-h-GO. This is also crosschecked from the fast Fourier transform (FFT) patterns generated from the HRTEM images of the LFP particles. A representative FFT pattern for a selected particle from Fig. 4c is shown as inset of Fig. 4d. Additional evidence that the LFP particles in LFP-1h-GO do not contain any non-indexed planes other than that of orthorhombic olivine structure is proved by masking the FFT pattern. Subsequent masking of (111), (122) and (140) spots (Fig. 5c, e and g) from the FFT pattern of Fig. 5b and regeneration of corresponding inverse FFT patterns (Fig. 5d, f and h, lattice fringes) for the residual diffraction spots and finally lack of any lattice fringes (Fig. 5h) when no diffraction spot is left in the FFT pattern (Fig. 5b) indicates the phase purity of the LFP-1h-GO sample. Due to particle drift under electron beam, it is not possible to record the EDS elemental mapping for individual tiny LFP particles in LFP-h-GO. The EDS pattern (Fig. S9†) from the TEM analysis (Fig. 4 and 5) convincingly show that the very small particles are indeed that of LFP.
 |
| | Fig. 4 (a, b) Bright-field TEM images (inset of (a): particle size distribution) and (c) high-resolution TEM (HRTEM) images of LFP-1h-GO. (d) HRTEM image of a single particle from (c) showing lattice fringes (inset: FFT pattern). | |
 |
| | Fig. 5 (a) HRTEM and corresponding FFT pattern (b) of a single LFP-1h-GO particle. (c), (e) and (g) represents subsequent masking of the diffraction spots in (b) and (d), (f) and (h) their respective inverse FFT (IFFT) pattern. | |
2.5. Electrochemical performance of LFP-h-GO
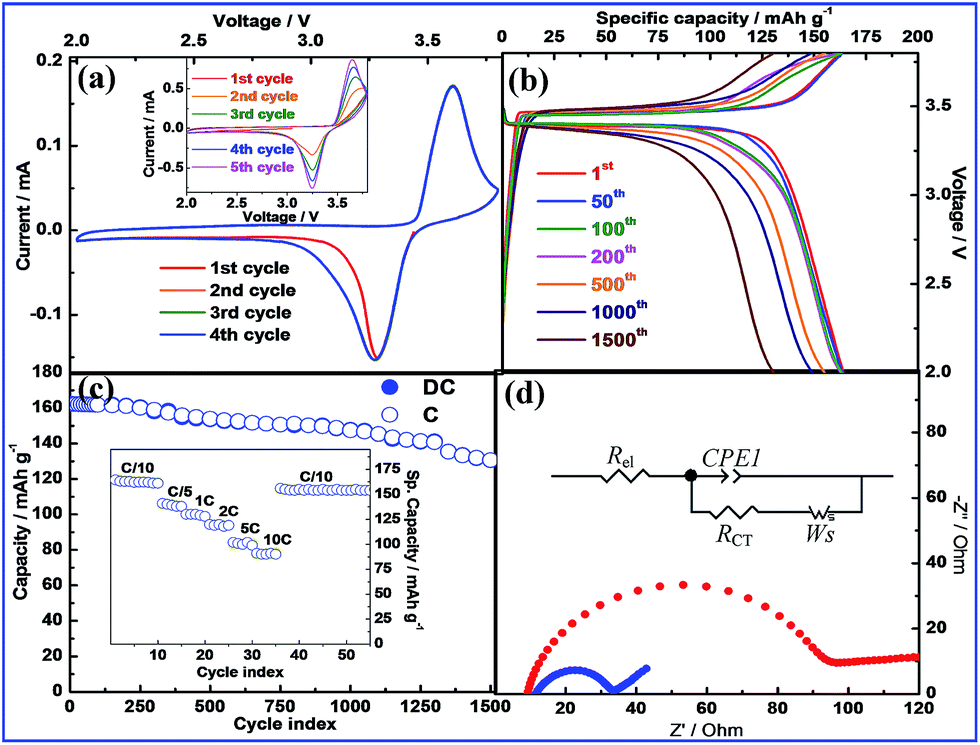
The cyclic voltammogram (CV) (Fig. 6a) of LFP-1h-GO shows excellent stability with successive cycles exactly overlapping with the first cycle. In comparison the LFP-1GO (inset: Fig. 6a), not only shows changes in the anodic peak position but also changes in current intensity in the successive cycles compared to the first cycle. The cathodic (Fe3+ ↔ Fe2+) and anodic (Fe2+ ↔ Fe3+) peaks appear at 3.3 V and 3.6 V (vs. Li/Li+) respectively. The charge–discharge profiles and specific capacity versus cycle number at 0.1C for LFP-1h-GO are shown in Fig. 6b and c respectively. The 1st cycle charge and discharge plateaus that appear at 3.45 V and 3.40 V respectively compare well with the observations from the CV. The plateau voltage gap for LFP-1h-GO varied from 0.05 V in the 1st cycle to only 0.129 V in the 1500th cycle as compared to 0.082 V recorded in the 1st discharge–charge cycle for LFP-1GO (cf. Fig. S10†). Lower polarization of the LFP-1h-GO compared to LFP-1GO strongly indicates that the lithium-ion diffusion is facilitated through the pores of h-GO. The first discharge capacity of LFP-1h-GO is 162.2 mA h g−1 which is nearly 96% of the theoretical capacity (=170 mA h g−1) of LFP. It is worth mentioning here that the electrode materials are cast on carbon coated aluminum (sp. capacity ≈ 1–2 mA h g−1) instead of a bare Al foil current collector. A decrease in charge-transfer (C-T) resistance by 55 Ω (cf. Fig. 6d) is observed when the fresh LFP-1h-GO cells (OCV ∼3.0 V) are assembled by casting the active LFP material on bare Al and carbon-coated Al foil current collector. The decrease in the C-T resistance can be attributed to the improvement in the contacts between the electrode and the current collector as a result of carbon coating. This subsequently improves the performance of the battery.52 The excellent performance of the LFP-1h-GO cell up to 1500 cycles can be partially attributed to the improved electrode-electrolyte interfacial contacts. LFP-1h-GO cell shows excellent performance delivering capacities of 161.7 mA h g−1 (∼99% retention of the initial capacity = 162.2 mA h g−1), 153.6 mA h g−1 (95% retention) and 130.5 mA h g−1 (80% retention) respectively at the end of 100th, 500th and 1500th cycles. At the end of 1500 cycles, the LFP-1h-GO cell shows an increase of C-T resistance of only 97.4 Ω as compared to the fresh cell (Fig. S11†) further indicating the excellent reversibility and cell stability of LFP-1h-GO. The LFP-1GO in contrast shows capacities of only 86 mA h g−1 in the initial cycle that reduces to 71 mA h g−1 (∼82% retention of initial capacity) at the end of 200th cycles (cf. Fig. S12†). The rate capability of LFP-1h-GO (cf. inset: Fig. 6c) is tested by running the cell at different currents ranging from 0.1–10C (1C ≈ 170 mA g−1). The excellent rate performance of the LFP-1h-GO cell is demonstrated by the high capacities of 130 mA h g−1 and 91 mA h g−1 at 1C and 10C respectively and recovery to 154 mA h g−1 at 0.1C (94% of the initial capacity). The coulombic efficiency of LFP-1h-GO remains nearly 100% throughout the 1500 cycles (Fig. S13†). As compared to LFP-1h-GO, LFP-1GO exhibits poor rate capability (Fig. S14†). When compared with LFP-xh-GO (x = 0.5%, 2% and 5%) the electrochemical performance of LFP-1h-GO is the best (Fig. S15†). Diminution of specific capacity of LFP-xh-GO for h-GO >1% is accounted on the basis that excessive carbon in the cathode may lead to blocking the facile Li+-ion transport. However, inferior performance of LFP-0.5h-GO compared to LFP-1h-GO is explained on the basis of inadequate quantity of graphene available to form extended electronic network between LFP particles. The improvement in electrochemical performance of LFP-1h-GO is also reflected in the number of Li+-ion (xLi) involved in the intercalation reaction of LiFePO4.
 |
| | Fig. 6 (a) Cyclic voltammetry (scan rate of 0.25 mV s−1) profile (inset: CV of LFP-1GO), (b) galvanostatic cycle performance (inset: rate capability) and (c) voltage vs. capacity plot of LFP-1h-GO. (d) Change in cell impedance (fresh cell, open circuit voltage, OCV ∼3 V) when LFP-hGO is coated on bare (red) and carbon coated (blue) Al current collector (inset: equivalent circuit used for fitting the impedance data. Rel represents resistance of electrolyte and cell components, RCT//CPE1 represents the charge-transfer resistance and its related constant phase element and Ws the Warburg element). | |
The values of xLi = 0.94 and 0.3 for LFP-1h-GO and LFP-1GO, respectively, signifies an efficient charge transport in the former compared to the latter. The electrochemical performance of LFP-1h-GO is very much comparable with the latest reports on LiFePO4 electrodes. The performance of LFP electrodes up to 1500 cycles as demonstrated here is unique among the recent reports.8–11,23,53
2.6. Kinetics of Li+-ion diffusion in LFP-h-GO
The rate determining step for the electrochemical reactions at the electrode surface and hence the transport through the electrodes is governed mainly by the translational diffusion of ions which in turn is guided by the concentration gradients in the system. Faster ion diffusion implies better electrochemical performance. Galvanostatic intermittence titration techniques (GITT) for calculating DLi+ for two-phase system like LFP (where ions are transported by not only the concentration gradient but also the movement of an interface boundary)54–56 has limitations and that the apparent DLi+ in the two-phase region is nearly 2–3 orders of magnitude lower than that in the single phase region.57 The use of GITT is to ascertain the difference in the Li+-ion transport in the presence and absence of h-GO in LFP. In the nanometer sized LFP particles the interface boundary is less. Although the predicted intrinsic DLi+ (referred as the anti-site defects free condition) along the b (010) direction of LiFePO4 is ∼10−8 cm2 s−1,58,59 the experimentally obtained values are found to range from 1.8 × 10⁻¹⁴ to 2.8 × 10⁻¹⁶ cm2 s−1 for LiFePO4 and FePO4, respectively.60 The improvement of at least 2-orders of DLi+ in LFP-h-GO (DLi+ = 6.3 × 10⁻¹² cm2 s−1, cf. Fig. 7 and S16†) validates the above results of ion diffusion in nano-scale miniaturized LFP particles. This also ascertains the DLi+ through the pores of h-GO. The actual diffusion coefficient in the nanometer sized LFP channels will however, be higher than this value. In comparison, DLi+ in LFP-1GO is estimated to be 3.79 × 10⁻¹³ cm2 s−1. Reduction in DLi+ values by one order in case of LFP-1GO compared to LFP-1h-GO suggests faster diffusion of Li+-ion through the h-GO. At least one order lower value of DLi+ for LFP-1GO compared to LFP-1h-GO indicates faster ion diffusion and nevertheless mass transport through the holey network provided by the h-GO. The tortuous path traversed by Li+-ion in LFP-1GO due to the presence of non-porous GO reduces the overall value of DLi+ in it. This also explains the superior electrochemical performance of LFP-1h-GO as compared to LFP-1GO.
 |
| | Fig. 7 Galvanostatic intermittent titration technique (GITT) charge–discharge curve (inset: polarization curve for a single GITT discharge process at plateau potential) for LFP-1h-GO. | |
3. Conclusions
In summary, we have convincingly shown here that the average Li+-ion diffusion pathways can be reduced and hence the cell performance drastically improved by optimizing the morphology and quantity of the carbon conduit in the LiFePO4-carbon composite. This is accomplished using a synthesis design strategy involving two major steps. Firstly, the LFP particles are downsized and secondly, assembling them with few layer holey-graphene sheets instead of the conventional non-porous graphene in a 3D configuration. This also results in the reduction of the usage of quantities of insulating polymer binder and carbon black employed during cell assembly, which often have negative influence on the overall performance of the cell. We envisage that this novel modification in the electric conduit material demonstrated here will be beneficial for varied electrode materials relevant for different battery chemistries and also for supercapacitors where carbon plays a pivotal role in energy storage.
Acknowledgements
We thank the Centre for Nanoscience and Engineering (CENSE) (Mr Venu V. Bhat) and Solid State and Structural Chemistry Unit (Mr I. S. Jarali), Indian Institute of Science (IISc) for providing various instrumentation facilities and assistance with the measurements. We thank the Nano Mission under the Department of Science and Technology (DST), India, India-Taiwan Programme of Cooperation in Science and Technology (GITA/DST/TWN/P-46/2013) for financial support. The authors acknowledge Dr Jason Fang, ITRI, Hsinchu, Taiwan for providing carbon black samples. DD acknowledges Nano Mission, DST for Research Associateship.
References
- M. Winter and R. Brodd, Batteries, fuel cells and supercapacitors, Chem. Rev., 2004, 104, 4245–4269 CrossRef CAS PubMed.
- P. G. Bruce, Energy storage beyond the horizon: Rechargeable lithium batteries, Solid State Ionics, 2008, 179, 752–760 CrossRef CAS.
- J. B. Goodenough and K.-S. Park, The Li-ion rechargeable battery: a perspective, J. Am. Chem. Soc., 2013, 135, 1167–1176 CrossRef CAS PubMed.
- P. G. Bruce, B. Scrosati and J.-M. Tarascon, Nanomaterials for rechargeable lithium batteries, Angew. Chem., Int. Ed., 2008, 47, 2930–2946 CrossRef CAS PubMed.
- B. Kang and G. Ceder, Battery materials for ultrafast charging and discharging, Nature, 2009, 458, 190–193 CrossRef CAS PubMed.
- F. Cheng, J. Liang, Z. Tao and J. Chen, Functional materials for rechargeable batteries, Adv. Mater., 2011, 23, 1695–1715 CrossRef CAS PubMed.
- L. Ji, O. Toprakci, M. Alcoutlabi, Y. Yao, Y. Li, S. Zhang, B. Guo, Z. Lin and X. Zhang, α-Fe2O3 nanoparticle-loaded carbon nanofibers as stable and high-capacity anodes for rechargeable lithium-ion batteries, ACS Appl. Mater. Interfaces, 2012, 4, 2672–2679 CAS.
- D. Bian, Y. Sun, S. Li, Y. Tian, Z. Yang, X. Fan and W. Zhang, A novel process to recycle spent LiFePO4 for synthesizing LiFePO4/C hierarchical microflowers, Electrochim. Acta, 2016, 190, 134–140 CrossRef CAS.
- J. Song, B. Sun, H. Liu, Z. Ma, Z. Chen, G. Shao and G. Wang, Enhancement of the rate capability of LiFePO4 by a new highly graphitic carbon-coating method, ACS Appl. Mater. Interfaces, 2016, 8, 15225–15231 CAS.
- Y. Zhou, J. Lu, C. Deng, H. Zhu, G. Z. Chen, S. Zhanga and X. Tian, Nitrogen-doped graphene guided formation of monodisperse microspheres of LiFePO4 nanoplates as the positive electrode material of lithium-ion batteries, J. Mater. Chem. A, 2016, 4, 12065–12072 CAS.
- L. Hu, T. Zhang, J. Liang, Y. Zhu, K. Zhang and Y. Qian, Trace Fe3+ mediated synthesis of LiFePO4 micro/nanostructures towards improved electrochemical performance for lithium-ion batteries, RSC Adv., 2016, 6, 456–463 RSC.
- M. Koltypin, D. Aurbach, L. F. Nazar and B. Ellis, On the stability of LiFePO4 olivine cathodes under various conditions (electrolyte solutions, temperatures), Electrochem. Solid-State Lett., 2007, 10, A40–A44 CrossRef CAS.
- A. Yamada, S. C. Chung and K. Hinokuma, Optimized LiFePO4 for lithium battery cathodes, J. Electrochem. Soc., 2001, 148, A224–A229 CrossRef CAS.
- A. K. Padhi, K. Nanjundaswamy and J. B. Goodenough, Phospho-olivines as positive-electrode materials for rechargeable lithium batteries, J. Electrochem. Soc., 1997, 144, 1188–1194 CrossRef CAS.
- J.-P. Jegal, K.-C. Kim, M. S. Kim and K.-B. Kim, A lithium iron phosphate/nitrogen-doped reduced graphene oxide nanocomposite as a cathode material for high-power lithium ion batteries, J. Mater. Chem. A, 2014, 2, 9594–9599 CAS.
- X. Lou and Y. Zhang, Synthesis of LiFePO4/C cathode materials with both high-rate capability and high tap density for lithium-ion batteries, J. Mater. Chem., 2011, 21, 4156–4160 RSC.
- K. F. Hsu, S. Y. Tsay and B. J. Hwang, Synthesis and characterization of nano-sized LiFePO4 cathode materials prepared by a citric acid-based sol–gel route, J. Mater. Chem., 2004, 14, 2690–2695 RSC.
- P. Gibot, M. Casas-Cabanas, L. Laffont, S. Levasseur, P. Carlach, S. Hamelet, J.-M. Tarascon and C. Masquelier, Room-temperature single-phase Li insertion/extraction in nanoscale LixFePO4, Nat. Mater., 2008, 7, 741–747 CrossRef CAS PubMed.
- B. L. Ellis, W. R. M. Makahnouk, Y. Makimura, K. Toghill and L. F. Nazar, A multifunctional 3.5 V iron-based phosphate cathode for rechargeable batteries, Nat. Mater., 2007, 6, 749–753 CrossRef CAS PubMed.
- Z. Chen and J. R. Dahn, Reducing carbon in LiFePO4/C composite electrodes to maximize specific energy, volumetric energy, and tap density, J. Electrochem. Soc., 2002, 149, A1184–A1189 CrossRef CAS.
- R. Dominko, M. Bele, M. Gaberscek, M. Remskar, D. Hanzel, S. Pejovnik and J. Jamnik, Impact of the carbon coating thickness on the electrochemical performance of LiFePO4/C composites, J. Electrochem. Soc., 2005, 152, A607–A610 CrossRef CAS.
- M. M. Doeff, J. D. Wilcox, R. Yu, A. Aumentado, M. Marcinek and R. Kostecki, Impact of carbon structure and morphology on the electrochemical performance of LiFePO4/C composites, J. Solid State Electrochem., 2008, 12, 995–1001 CrossRef CAS.
- R. Tian, H. Liu, Y. Jiang, J. Chen, X. Tan, G. Liu, L. Zhang, X. Gu, Y. Guo, H. Wang, L. Sun and W. Chu, Drastically enhanced high-rate performance of carbon-coated LiFePO4 nanorods using a green chemical vapor deposition (CVD) method for lithium ion battery: a selective carbon coating process, ACS Appl. Mater. Interfaces, 2015, 7, 11377–11386 CAS.
- L.-H. Hu, F.-Y. Wu, C.-T. Lin, A. N. Khlobystov and L.-J. Li, Graphene-modified LiFePO4 cathode for lithium ion battery beyond theoretical capacity, Nat. Commun., 2013, 4, 1687 CrossRef PubMed.
- X. Zhou, F. Wang, Y. Zhub and Z. Liu, Graphene modified LiFePO4 cathode materials for high power lithium ion batteries, J. Mater. Chem., 2011, 21, 3353–3358 RSC.
- Y. Tang, F. Huang, H. Bi, Z. Liu and D. Wan, Highly conductive three-dimensional graphene for enhancing the rate performance of LiFePO4 cathode, J. Power Sources, 2012, 203, 130–134 CrossRef CAS.
- X. Zhu, J. Hu, W. Wu, W. Zeng, H. Dai, Y. Du, Z. Liu, L. Li, H. Jib and Y. Zhu, LiFePO4/reduced graphene oxide hybrid cathode for lithium ion battery with outstanding rate performance, J. Mater. Chem. A, 2014, 2, 7812–7818 CAS.
- J. Muna, H.-W. Hab and W. Choi, Nano LiFePO4 in reduced graphene oxide framework for efficient high-rate lithium storage, J. Power Sources, 2014, 251, 386–392 CrossRef.
- J. Ha, S.-K. Park, S.-H. Yu, A. Jin, B. Jang, S. Bong, I. Kim, Y.-E. Sung and Y. Piao, A chemically activated graphene-encapsulated LiFePO4 composite for high-performance lithium ion batteries, Nanoscale, 2013, 5, 8647–8655 RSC.
- J. Wang and S. Kaskel, KOH activation of carbon-based materials for energy storage, J. Mater. Chem., 2012, 22, 23710–23725 RSC.
- C. Lastoskie, K. E. Gubbins and N. Quirke, Pore size distribution analysis of microporous carbons: a density functional theory approach, J. Phys. Chem., 1993, 97, 4786–4796 CrossRef CAS.
- J. P. Olivier, W. B. Conklin and M. V. Szombathely, Determination of pore size distribution from density functional theory: a comparison of nitrogen and argon results, Stud. Surf. Sci. Catal., 1994, 87, 81–89 CrossRef CAS.
- P. I. Ravikovitch, S. C. O'Domhnaill, A. V. Neimark, F. Schuth and K. K. Unger, Capillary hysteresis in nanopores: theoretical and experimental studies of nitrogen adsorption on MCM-41, Langmuir, 1995, 11, 4765–4772 CrossRef CAS.
- D. R. Dreyer, S. Park, C. W. Bielawski and R. S. Ruoff, The chemistry of graphene oxide, Chem. Soc. Rev., 2010, 39, 228–240 RSC.
- G. E. Bacon, The interlayer spacing of graphite, Acta Crystallogr., 1951, 4, 558–561 CrossRef CAS.
- J. Zhang, H. Yang, G. Shen, P. Cheng, J. Zhang and S. Guo, Reduction of graphene oxide via L-ascorbic acid, Chem. Commun., 2010, 46, 1112–1114 RSC.
- A. V. Murugan, T. Muraliganth and A. Manthiram, Rapid, facile microwave-solvothermal synthesis of graphene nanosheets and their polyaniline nanocomposites for energy strorage, Chem. Mater., 2009, 21, 5004–5006 CrossRef CAS.
- S. Praneetha and A. V. Murugan, A rapid, one-pot microwave-solvothermal synthesis of a hierarchical nanostructured graphene/LiFePO4 hybrid as a high performance cathode for lithium ion batteries, RSC Adv., 2013, 3, 25403–25409 RSC.
- M. Herstedt, M. Stjerndahl, M. Armand, J. O. Thomas and K. Edstrom, Surface chemistry of carbon-treated LiFePO4 particles for Li-ion battery cathodes studied by PES, Electrochem. Solid-State Lett., 2003, 6, A202–A206 CrossRef CAS.
- M. Manikam, P. Singh, S. Thurgate and K. Prince, Redox behavior and surface characterization of LiFePO4 in lithium hydroxide electrolyte, J. Power Sources, 2006, 158, 646–649 CrossRef.
- A. M. Andersson and K. Edstrom, Chemical composition and morphology of the elevated temperature SEI on graphite, J. Electrochem. Soc., 2001, 148, A1100–A1109 CrossRef CAS.
- C. D. Wagner, W. M. Riggs, L. E. Davis, J. F. Moulder and C. E. Muielenberg, Handbook of X-ray photoelectron spectroscopy, Physical electronics industries, New York, 1976 Search PubMed.
- J. Hong, L. LV, Y. Wang, M. He and G. He, Solid State Ionics: ionics for sustainable world-proceedings of the 13th Asian conference, ed. B. V. R. Chowdari, J.-I. Kawamura, J. Mizusaki and K. Amezawa, World Scientific Publishing, Sendai, 2012 Search PubMed.
- C. Masquelier and L. Croguennec, Polyanionic (phosphates, silicates, sulfates) frameworks as electrode materials for rechargeable Li (or Na) batteries, Chem. Rev., 2013, 113, 6552–6591 CrossRef CAS PubMed.
- P. Axmann, C. Stinner, M. Wohlfahrt-Mehrens, A. Mauger, F. Gendron and C. M. Julien, Nonstoichiometric LiFePO4: defects and related properties, Chem. Mater., 2009, 21, 1636–1644 CrossRef CAS.
- D. Y. W. Yu, K. Donoue, T. Kadohata, T. Murata, S. Matsuta and S. Fujitani, Impurities in LiFePO4 and their influence on material characteristics, J. Electrochem. Soc., 2008, 155, A526–A530 CrossRef CAS.
- M. Talebi-Esfandarani, S. Rousselot, M. Gauthier, P. Sauriol, M. Duttine, A. Wattiaux, Y. Liu, A. X. Sun, G. Liang and M. Dolle, Control of the LiFePO4 electrochemical properties using low-cost iron precursor in a melt process, J. Solid State Electrochem., 2016 DOI:10.1007/s10008-016-3324-2.
- P. K. Chu and L. Li, Characterization of amorphous and nanocrystalline carbon films, Mater. Chem. Phys., 2006, 96, 253–277 CrossRef CAS.
- H. Yang, X.-L. Wu, M.-H. Cao and Y.-G. Guo, Solvothermal synthesis of LiFePO4 hierarchically dumbbell-like microstructures by nanoplate self-assembly and their application as a cathode material in lithium-ion batteries, J. Phys. Chem. C, 2009, 113, 3345–3351 CAS.
- S. Bose, T. Kuila, A. K. Mishra, N. H. Kim and J. H. Lee, Dual role of glycine as a chemical functionalizer and a reducing agent in the preparation of graphene: an environmentally friendly method, J. Mater. Chem., 2012, 22, 9696–9703 RSC.
- C. M. Julien, K. Zaghib, A. Mauger, M. Massot, A. Ait-Salah, M. Selmane and F. Gendron, Characterization of the carbon coating onto LiFePO4 particles used in lithium batteries, J. Appl. Phys., 2006, 100, 063511 CrossRef.
- S. Yoshihara, H. Isozumi, M. Kasai, H. Yonehara, Y. Ando, K. Oyaizu and H. Nishide, Improving charge/discharge properties of radical polymer electrodes influenced strongly by current collector/carbon fiber interface, J. Phys. Chem. B, 2010, 114, 8335–8340 CrossRef CAS PubMed.
- S. H. Ha and Y. J. Lee, Core–shell LiFePO4/carbon-coated reduced graphene oxide hybrids for high-power lithium-ion battery cathodes, Chem.–Eur. J., 2015, 21, 2132–2138 CrossRef CAS PubMed.
- K. Weichert, W. Sigle, P. A. van Aken, J. Jamnik, C. Zhu, R. Amin, T. Acartürk, U. Starke and J. Maier, Phase boundary propagation in large LiFePO4 single crystals on delithiation, J. Am. Chem. Soc., 2012, 134, 2988–2992 CrossRef CAS PubMed.
- M. J. Welland, D. Karpeyev, D. T. O'Connor and O. Heinonen, Miscibility gap closure, interface morphology, and phase microstructure of 3D LixFePO4 nanoparticles from surface wetting and coherency strain, ACS Nano, 2015, 9, 9757–9771 CrossRef CAS PubMed.
- D. Robert, T. Douillard, A. Boulineau, G. Brunetti, P. Nowakowski, D. Venet, P. Bayle-Guillemaud and C. Cayron, Multiscale phase mapping of LiFePO4-based electrodes by transmission electron microscopy and electron forward scattering diffraction, ACS Nano, 2013, 7, 10887–10894 CrossRef CAS PubMed.
- Y. Zhu and C. Wang, Galvanostatic intermittent titration technique for phase-transformation electrodes, J. Phys. Chem. C, 2010, 114, 2830–2841 CAS.
- R. Malik, D. Burch, M. Bazant and G. Ceder, Particle size dependence of the ionic diffusivity, Nano Lett., 2010, 10, 4123–4127 CrossRef CAS PubMed.
- M. S. Islam, D. J. Driscoll, C. A. J. Fisher and P. R. Slater, Atomic-scale investigation of defects, dopants, and lithium transport in the LiFePO4 olivine-type battery material, Chem. Mater., 2005, 17, 5085–5092 CrossRef CAS.
- P. P. Prosini, M. Lisi, D. Zane and M. Pasquali, Determination of the chemical diffusion coefficient of lithium in LiFePO4, Solid State Ionics, 2002, 148, 45–51 CrossRef CAS.
Footnote |
| † Electronic supplementary information (ESI) available: Methodologies, N2 adsorption–desorption isotherm, PXRD and TEM images of h-GO, PXRD, EDS, IR and Raman spectra and assignment of bands, galvanostatic cycling and GITT plot for LFP-h-GO (LFP-1GO), TEM images of LFP-bat. See DOI: 10.1039/c6ra20778b |
|
| This journal is © The Royal Society of Chemistry 2016 |
Click here to see how this site uses Cookies. View our privacy policy here. 
 a,
A. L. Santhoshaa,
A. K. Soodb and
Aninda J. Bhattacharyya*a
a,
A. L. Santhoshaa,
A. K. Soodb and
Aninda J. Bhattacharyya*a