DOI:
10.1039/C6RA20698K
(Paper)
RSC Adv., 2016,
6, 98663-98673
Determination of triazine herbicides from honey samples based on hydrophilic molecularly imprinted resins followed by high performance liquid chromatography-tandem mass spectrometry
Received
17th August 2016
, Accepted 7th October 2016
First published on 7th October 2016
Abstract
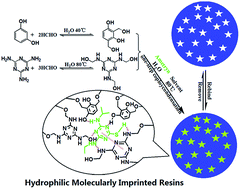
A facile, novel and efficient approach to extract six triazine herbicides from honey samples based on hydrophilic molecularly imprinted resins (MIRs) was described. The MIRs were prepared in a one-pot polycondensation with resorcinol and melamine as the double functional monomers, formaldehyde as a crosslinking agent, and ametryn as the template. The obtained MIRs have a uniform spherical morphology and excellent dispersibility in water due to them having a large number of hydrophilic groups. The MIRs were successfully used as a solid-phase extraction material to rapidly extract and clean up to six triazines in honey samples followed by high performance liquid chromatography-tandem mass spectrometry detection. Under optimal conditions, the method showed higher recoveries and a shorter extraction time. The detection limits of the six triazines are in the range of 0.02–0.15 ng g−1. The recoveries of the six triazines are in the range of 83 ± 4% to 97 ± 4% at the spiked level of 5 ng g−1. The proposed method is simple and quick and has the potential to detect triazine herbicides in other aqueous samples.
1. Introduction
Bees collect pollen and nectar from contaminated flowers, which have undergone frequent exposure to contaminants that can pollute honeycombs and honey.1,2 Triazine herbicides are one of the most widely used herbicides in agriculture. When triazine herbicides are introduced into the honey, they have the potential to threaten human health, such as with teratogenic effects, hormonal disorders and cancer.3–6 Consequently, the monitoring and determination of triazine herbicides residues in honey samples are crucial and essential.
There are many different techniques that have been used to monitor triazine herbicides in different complex real samples, such as gas chromatography (GC),7 gas chromatography-tandem mass spectrometry (GC-MS),8 high-performance liquid chromatography (HPLC),9 high performance liquid chromatography-tandem mass spectrometry (HPLC-MS/MS),4,10 and capillary electrophoresis (CE).11 In the technologies mentioned above, HPLC-MS/MS is the most selective and sensitive method for the analysis of triazine herbicides in both quantitative and qualitative terms.10
Generally, the low levels of analytes in complex matrices which can be accurately quantified are required to be separated and enriched before introducing into apparatuses. Solid phase extraction (SPE) is a widely used sample pretreatment technique due to its solvent saving and efficient procedure.12 However, the frequently used adsorbents such as octadecylsilane (C18), Oasis HLB, and graphitized carbon black (GCB), lack selectivity.13 Molecular imprinting is a powerful technique for fabricating selective recognition materials.14–16 It is of particular interest when the molecular imprinting technique combines with SPE due to the high selectivity and stability.10,12,17 The previously developed molecular imprinted polymers (MIPs) were synthesized and applied predominantly in organic environments.18–20 However, a lot of target analytes to be detected often appear in aqueous media such as beverages, environmental waters, and body fluids.21 Therefore, it is necessary to develop a kind of MIP for the selective adsorbing of the target analytes in aqueous media. Various approaches have been attempted, including tuning the polarity of porogen,22,23 changing the pH of the porogen,24 incorporating hydrophilic co-monomers or cross-linkers,25–29 and covering in a hydrophilic shell layer or hydrophilic restricted access material.30–33 In addition, Qiao et al. prepared water-compatible MIPs using water/oil/water suspension polymerization to extract triazine herbicides in environmental water.13 Shen et al. synthesized MIPs via a Pickering emulsion polymerization, which can selectively recognize propranolol in water.34 To some extent, the methods mentioned above more or less exhibit some flaws, such as complicated preparation processes, difficult to obtain hydrophilic monomers or hydrophilic shell layers, lower yields, or requiring nitrogen and stirring throughout the whole preparation process. It is highly desirable to develop a useful strategy for preparing hydrophilic molecular imprinted materials through a simple and convenient method.
The condensation of hydroxyl, amino and aldehyde groups often forms abundant hydrophilic groups, such as hydroxyls, iminos, carbonyls, and ether linkages. Introducing the condensation into the molecular imprinting technique would be beneficial for obtaining molecularly imprinted materials with large numbers of hydrophilic groups. To date, there are few reports based on this strategy to synthesise molecularly imprinted materials. Guo et al. synthesized an excellent molecularly imprinted resin using water-soluble melamine–urea–formaldehyde (MUF) gel as the functional monomer, and ligustrazine as the template.35 However, the preparation process required a longer solidifying time and this was followed by grinding and sieving. Hao et al. prepared water-compatible MIPs with aldehyde-functionalized magnetic nanoparticles copolymerized with functional monomer gelatin and template 17β-estradiol (E2) through a surface imprinting method.36 The obtained imprinted materials were successfully applied to specifically separate and detect E2 in environmental water samples. Yang et al. fabricated a new type of molecularly imprinted resin with glyoxal–urea–formaldehyde gel as the functional monomer.37 By the condensation of urea, glyoxal and formaldehyde, abundant carbonyls, hydroxyls and ether linkages were generated on the resin. The large number of hydrophilic groups made the resin very suitable for extracting organochlorine pesticides in water media. Lv et al. prepared hydrophilic molecularly imprinted resorcinol–formaldehyde–melamine resin (MIRFM) for specifically recognizing sulfonamides (SAs) from milk samples.38 The water-compatibility of MIPs has been significantly improved by using hydrophilic monomers and hydrophilic crosslinking agents. The obtained MIRFM has excellent water dispersibility and remarkable specificity, which combines the advantages of the hydrophilic phenolic resin and the molecular imprinting technique. This novel and facile strategy for fabricating hydrophilic molecularly imprinted materials has promise for further applications to analyze other analytes in complex water media samples.
In this work, we have successfully prepared a hydrophilic molecularly imprinted resin based on a phenolic resin. In this one-pot synthesis process, melamine and resorcinol were employed as double functional monomers, formaldehyde served as the crosslinking agent. The obtained MIRs have uniform spherical morphology and excellent dispersibility in water. The MIRs were successfully applied as a solid-phase extraction material to rapidly extract and clean up six triazines in honey samples followed by HPLC-MS/MS detection for the first time. The higher recoveries and shorter extraction time showed that the proposed method has the potential to detect triazine herbicides in other aqueous samples.
2. Experiment
2.1. Reagents and materials
Melamine (99%), resorcinol (99%), formaldehyde (37 wt%), and florfenicol (97%) were obtained from the National Institute for the Control of Pharmaceutical and Biological Products (Beijing, China). The standards (purity > 98%) of simazine, desmetryn, atrazine, ametryn, propazine and prometryn were purchased from Dr Ehrenstorfer (Augsburg, Germany). Acetonitrile, ammonia, acetic acid and methanol of analytical grade were purchased from Beijing Chemical (Beijing, China). Acetonitrile of chromatographic grade was obtained from Fisher (Pittsburgh, PA, USA). High purity water with a resistivity of 18.2 MΩ cm was prepared from a Milli-Q water system (Millipore, Billerica, MA). The chemical structures of the relevant substances are shown in Fig. 1.
 |
| Fig. 1 Chemical structures of the relevant substances. | |
Stock standard solutions (500 μg mL−1) of the six triazines were prepared in methanol, stored at −18 °C in a refrigerator and found to be stable for as long as 2 months. The mixed solutions should be replaced every two weeks and stored at 4 °C in the refrigerator before use. Working standard solutions were prepared by diluting with deionized water every day.
Five honey samples were randomly purchased from different supermarkets and farms located in Changchun (China), Hebei (China), Henan (China) and the Changbai Mountains (China) respectively. The samples were maintained at room temperature in the dark. We chose a honey sample which was determined to not contain any of the six triazines as a blank honey sample. The spiked honey samples were prepared by adding appropriate amounts of the six triazine standard solutions to the blank honey samples and were stored at 4 °C in the refrigerator away from light.
2.2. The preparation of the hydrophilic MIRs
The hydrophilic MIRs for the triazines were prepared by using ametryn as the template, melamine and resorcinol as the hydrophilic functional monomers, and formaldehyde as the hydrophilic crosslinking agent. First, 10 mL of water, 3.303 g of resorcinol, and 4.5 mL of 37 wt% formaldehyde solution were successively added into a three-necked flask (100 mL) and stirred for 1 h at 40 °C. At the same time, 10 mL of distilled water, 1.261 g of melamine and 2.25 mL of 37 wt% formaldehyde were added into another flask in turn and stirred at 80 °C until the mixture became clear. The mixture cooled to 40 °C was added into the three-necked flask mentioned above followed by the addition of 10 mL of ametryn acetonitrile solution (0.1 mol L−1) and stirring at 300 rpm for 1 h under the 40 °C for the self-assembly. The reaction proceeded at 80 °C for 16 h in the stationary state. The obtained MIRs were collected using centrifugation, were washed several times with deionized water for removing the unreacted raw material and impurities, and then eluted with methanol–water–acetic acid (8/1/1, v/v/v) thoroughly until the ametryn could not be checked using HPLC. At last, the MIRs were washed with methanol to neutrality and dried at 60 °C. The corresponding non-molecularly imprinted resins (NIRs) were synthesized with the same whole procedure as the MIRs but without adding the template (ametryn).
2.3. Characterizations of the resins
The morphology and size of the resins were observed by using a field-emission scanning electron microscope (FE-SEM, S-4800, Hitachi, Japan). The characteristic functional groups were observed using Fourier transform infrared spectroscopy (Nicolet AVATAR 360 FT-IR spectrophotometer) and KBr powders acted as the sample matrix. Thermal gravimetric analysis of the MIRs was studied using a PerkinElmer calorimeter.
2.4. Adsorption experiments
The adsorption experiments were performed as follows: 10.0 mg of the MIRs or NIRs were equilibrated with 2.0 mL of one of the ametryn standard solutions, which were prepared in water with sequential concentrations varying from 5 to 150 μg mL−1. After shaking the mixtures for 24 h at room temperature, the supernatants were separated and analyzed using HPLC with UV detection at 228 nm. The ametryn standard solutions would not be degraded during 24 h at 25 °C. The amount of ametryn adsorbed on the resins could be calculated according to the equation: |
 | (1) |
where Qe (mg g−1) is the equilibrium adsorption capacity of the resins for ametryn, and Co (μg mL−1) and Ce (μg mL−1) are the initial concentrations and equilibrium concentrations of the ametryn in the solutions, respectively. V (mL) is the volume of the solutions and m (g) means the mass of the resins.
Atrazine and propazine were selected as the structural analogs of ametryn, and florfenicol was selected as the reference compound to assess the selectivity of the prepared MIRs and NIRs. 10.0 mg of the MIRs or NIRs was dispersed in 2.0 mL of standard solution containing 30 μg mL−1 of triazines or florfenicol. After the mixed solutions were mechanically shaken for 24 h at room temperature, the suspensions were separated and analyzed using HPLC. The triazines and florfenicol standard solutions would not be degraded during 24 h at 25 °C. The amount of the analytes adsorbed on the resins could be calculated using eqn (1).
2.5. Molecularly imprinted solid phase extraction (MISPE) of honey samples
The MISPE was carried out as follows: 60 mg of the MIRs were packed into a 1 mL SPE cartridge. Two pieces of cotton were placed at both ends of the cartridge to avoid leakage and contamination of the MIRs. Prior to the sample loading, the cartridge was sequentially activated with 4 mL of methanol (2 × 2 mL, every volume washed twice) and 2 mL of Milli-Q water consecutively. One gram of the spiked honey sample was diluted with 5 mL of Milli-Q water. The obtained homogeneously mixed solution was loaded onto the activated cartridge and washed with 2 × 1 mL of 5% methanol aqueous solution. Afterwards, 2 × 1 mL of methanol/water (90/10, v/v) solution was used to elute the target compounds adsorbed on the MIRs. The eluent was dried under nitrogen gas at 40 °C and redissolved in methanol, filtered through microfilters with a pore size of 0.22 μm and analyzed using HPLC. The entire extraction process took less than 10 min. Each experiment was repeated three times to guarantee the accuracy of this work, except for the intra- and inter-day precisions (n = 6).
2.6. HPLC-MS/MS analysis
The six triazines were separated and analyzed using an Agilent 1100 HPLC system equipped with an Eclipse XDB-C18 column (4.6 mm × 150 mm, 5 μm particle size, Agilent, USA). The mobile phase was ACN–water (68/32, v/v) at a flow rate of 1.0 mL min−1, the column temperature was maintained at 40 °C and the injection volume was 20 μL. The mobile phase was split into the mass spectrometer detector at a flow rate of 0.2 mL min−1. The Q-Trap mass spectrometer (Applied Biosystems/MDS Sciex, Concord, Canada) was connected to an ESI source and operated in positive electrospray ionization mode under multiple reaction monitoring (MRM) conditions. The optimal conditions for detecting the six triazines with the ESI-MS/MS were as follows: ion spray voltage, 5000 V; source temperature, 430 °C; collision gas, N2 (medium); curtain gas, N2 (30 psi); gas 1, N2 (55 psi); gas 2, N2 (50 psi). The selected precursor ion and product ion, as well as the corresponding declustering potential (DP), collision energy (CE), entrance potential (EP), collision cell entrance potential (CEP) and collision cell exit potential (CXP) are shown in Table 1. The Applied Biosystems Analyst software (version 1.4.2) was used for the data processing.
Table 1 Precursor ion, product ion and corresponding DP, EP, CEP, CE and CXP for the six triazines
Analytes |
Precursor ion (m/z) |
Product ion (m/z) |
DP (V) |
CE (eV) |
EP (V) |
CEP (V) |
CXP (V) |
The product ion used for quantification. |
Simazine |
202.1 |
104.1a |
52 |
40 |
8 |
20 |
3 |
96.1 |
52 |
25 |
8 |
20 |
3 |
Atrazine |
216.2 |
174.1a |
52 |
40 |
8 |
20 |
3 |
104.0 |
45 |
25 |
9 |
20 |
3 |
Desmetryn |
214.2 |
172.1a |
30 |
25 |
10 |
20 |
6 |
82.1 |
30 |
45 |
8 |
20 |
6 |
Propazine |
230.2 |
146.1a |
50 |
40 |
8 |
25 |
3 |
188.2 |
50 |
25 |
8 |
20 |
3 |
Ametryn |
228.2 |
186.1a |
30 |
25 |
10 |
20 |
8 |
96.1 |
30 |
30 |
10 |
25 |
6 |
Prometryn |
242.2 |
158.2a |
40 |
30 |
10 |
28 |
3 |
200.2 |
40 |
30 |
10 |
30 |
3 |
3. Results and discussion
3.1. The preparation of the MIRs
Common hydrophilic or water-compatible molecularly imprinted materials are often based on an allyl-dependent molecular imprinting polymerization method.21–34 Herein, we have successfully prepared hydrophilic MIRs based on phenolic resins. The simple one-pot preparation process did not require vigorous stirring or purging with nitrogen. The preparation and rebinding processes of the MIRs are schematically illustrated in Fig. 2.
 |
| Fig. 2 Illustration of the preparation and rebinding processes of the MIRs. | |
The resorcinol and melamine functional monomers can co-condense with formaldehyde to generate hydroxymethyl monomers which can produce nuclei with a number of reactive hydrophilic groups. Those hydrophilic groups can self-assemble with ametryn and further react with the free formaldehyde and monomers via co-polycondensation, which is like the Stöber method. The hydroxyl groups of the resorcinol can form hydrogen bonding interactions with the ametryn. The imino groups, part of the unreacted amino groups, as well as the triazine ring of the melamine can attract the ametryn through hydrogen bonding and π–π interactions. Under the heating conditions, the three-dimensional (3D) molecularly imprinted networks were formed. The imprinting process has no need for the addition of an auxiliary acid or base because the weak bases of melamine and ametryn can accelerate the condensation process.38,39 The multiple hydrogen bonds, π–π interactions and hydrophobic interactions combine the three-dimensional match leading to MIRs that have a strong affinity and selectivity to ametryn and its analogs.
3.2. Characterization of the resins
The morphological features of the MIRs (Fig. 3a) and NIRs (Fig. 3b) were observed using SEM. As shown in Fig. 3, the MIRs and NIRs exhibit similar spherical morphologies and a narrow size distribution with a mean diameter of 2 μm. It is indicated that the ametryn did not exhibit an obvious effect on the morphology of the resins. In addition, the uniform microspheres are suitable to be used as an SPE adsorbent which can form a homogeneous solid layer to guarantee sufficient contact with the solution.40
 |
| Fig. 3 The SEM images of the MIRs (a) and NIRs (b), photographs of the C18, HLB, and MIRs dispersed in pure water (1.0 mg mL−1) at 25 °C (c is 0 h and d is 1 h later), FT-IR spectra of the MIRs and NIRs (e), thermogravimetric behavior of the MIRs (f). | |
The chemical structures of the MIRs and NIRs were investigated using FT-IR. As displayed in Fig. 3e, the two resins have similar functional groups. The two strong characteristic absorption bands at 1560 and 1350 cm−1 can be assigned to the aromatic stretching vibration and “breathing” modes of the C–N in the triazine ring of melamine respectively.38,39,41 The bands around 1505 and 1467 cm−1 correspond to the C
C stretching vibrations in the aromatic ring of resorcinol.41 The FT-IR spectra demonstrated that the two functional monomers were successfully merged into the resins. The strong and broad band around 3405 cm−1 is assigned to the stretching vibrations of the N–H and O–H, and the peak at 810 cm−1 is ascribed to the out-of-plane bending vibration of the N–H.38,41,42 In addition, the peak at 2925 cm−1 is attributed to the C–H stretching vibration of the –NH–CH2– and 1090 cm−1 corresponded to the stretching vibration of the C–O–C.38,42 These characteristic peaks indicated that hydrophilic groups such as iminos, aminos, ether linkages and hydroxyls exist in the resins, which are beneficial for the dispersion of the MIRs into the aqueous system. Fig. 3c and d showed the dispersion stability of the C18, HLB and MIRs (1.0 mg mL−1) in pure water at 25 °C. After ultrasonic dispersion, the C18 immediately aggregated into clusters floating on the water, while the HLB and MIRs can disperse homogeneously (Fig. 3c). After standing for 1 h (Fig. 3d), the HLB precipitated to the bottom of the vial and most of the MIRs are continuously dispersed in the water. Despite the HLB having the quality of a hydrophilic–lipophilic balance, its water dispersibility is significantly lower than that of the MIRs. The excellent water dispersion indicated that the MIRs are very suitable for application in water samples.
Thermogravimetric analysis was performed to further estimate the thermal stability behavior of the MIRs. Fig. 3f revealed the TG-DTG profile of the MIRs in the temperature range of 20–800 °C under a nitrogen atmosphere. In the TG curve, an initial slight mass loss of about 4 wt% happened in the temperature range of 20–102 °C, corresponding to the elimination of water or some small organic molecules such as formaldehyde. The slight weight loss (ca. 4–12 wt%) from 102 to 340 °C was assigned to the desorption of water existing in the deepest layers of the MIRs or the condensation of hydroxyl groups on the MIRs.43–45 The obvious weight loss approximately started at 340 °C, which corresponded to the decomposition of the resins. The three peaks of the DTG curve in 20–400 °C are approximately consistent with the three temperature ranges of the TG curve. The TG-DTG curve of the MIRs is in good agreement with the thermal analysis of resorcinol formaldehyde melamine condensation resins. The results indicated that the hydrophilic MIRs have been prepared successfully and can be used under 340 °C.
3.3. Adsorption isotherms
To explore the adsorption properties of the resins, batch rebinding experiments were carried out. The adsorption isotherms plotted in Fig. 4a indicate that the adsorption capacity of the MIRs increased rapidly along with the increasing concentration of ametryn from 5 to 150 μg mL−1. Meanwhile, the amount of the ametryn bound to the MIRs was significantly higher than that bound to the NIRs, indicating that the recognition sites on the MIRs are suitable for ametryn in spatial complementary and functional interactions.
 |
| Fig. 4 Adsorption isotherm of the MIRs and NIRs for ametryn (a), evaluation of the selectivity (b). | |
The selectivity of the resins was confirmed by selecting two other triazines (atrazine and propazine) as the structural analogs, with florfenicol as the reference compound. Their chemical structures were illustrated in Fig. 1. Fig. 4b shows the adsorption capacities of the MIRs towards ametryn, propazine and atrazine were much higher than those of the NIRs, while the adsorption capacity of florfenicol on the MIRs showed no obvious difference to the adsorption capacity on the NIRs. This indicated that the MIRs exhibited a high specificity to ametryn and its structural analogs. The adsorption of atrazine is higher than the adsorption of propazine probably because of a higher degree of similarity to ametryn. In addition, the amounts of ametryn and the structural analogs bound to the NIRs were higher than those of florfenicol, which may be attributed to the melamine ring on the NIRs interacting with the triazine ring via π–π interactions. It was further illustrated that the recognition performances of the MIRs resulted from π–π interactions, hydrogen bonding and three-dimensional cavities that were complementary to the ametryn and structural analogs in shapes, sizes and functional groups. The results in Fig. 4b were consistent with expectations.
3.4. Optimization of the extraction conditions
To achieve higher recoveries, the extraction conditions were optimized by analyzing the six triazine herbicides in spiked honey samples (1 μg g−1). The factors affecting the extraction efficiency of the MIRs, including the pH of the diluted honey samples, amount of the MIRs, washing and elution conditions were all investigated and optimized. When one factor as a variable was to be optimized, the other factors were kept at the optimum values.
3.4.1. pH of diluted honey sample. The effect of pH on the recoveries of the six triazines was investigated by adjusting the pH of the diluted honey samples from 4.0 to 10.0 with HCl (1 mol L−1) or NaOH (1 mol L−1). As shown in Fig. 5a, with the pH increasing, the recoveries of the six triazines increased until the pH reached 6, then it was relatively stable in the range of 6.0–8.0. When the pH was higher than 8.0, the recoveries tended to decrease. The recoveries dropped in strong basic or acidic conditions, such pH-dependent behavior may be attributed to the hydrogen bonding interactions between the triazines and the MIRs. Under acidic conditions, the six triazines (pKa 1.65–4.1) will be protonated, this is not favorable for the formation of hydrogen bonds between the amino groups and hydroxyl groups. Strongly acidic media could even result in the hydrolysis of the trazines.4 Under alkaline conditions, the acidic functional groups (hydroxyl groups of the resorcinol) of the MIRs would give priority to combination with the hydroxide in solution, resulting partially in the weakness of the hydrogen bonding interactions between the triazines and the MIRs. Besides, π–π interactions and hydrophobic interactions between the triazines and the MIRs were favorable for keeping the recoveries of the triazines in a strong acidic or basic media as well. Based on the results, considered to simplify the SPE procedure, we did not adjust the pH of the diluted honey samples for the next studies.
 |
| Fig. 5 Effect of the pH of diluted honey sample (a), MIR amount (b), washing solution (c), washing volume (d), elution solution (e), and elution volume (f) on the recoveries of six triazines (n = 3). | |
3.4.2. MIR amount. Different amounts of the MIRs ranging from 30 mg to 70 mg were applied to extract six triazines to attain the high recoveries in Fig. 5b. The recoveries increased from 33–47% to 86–98% with the increasing of the MIR amount from 30 mg to 60 mg, further increasing the amount of the MIRs gave no significant improvement for the recoveries. On the contrary, excessive amount of the MIRs packed into the SPE cartridge would exhibit high back-pressure, requiring much more time and organic solvent for the elution, making the sample pretreatment more complex and time-consuming. Therefore, the amount of the MIRs was fixed at 60 mg in the subsequent experiments.
3.4.3. Effect of the washing solution and volume. Honey is a complex biological sample. Sugars, organic acids, and other impurities in honey samples not only seriously interfere with the accurate quantification of analytes, but also shorten the lifetime of a HPLC column.46 Hence, a wash step after the loading step is crucial to eliminate the possible interferences and reduce the matrix effects.A series of washing solvents including water, methanol–water (5/95 and 10/90, v/v), acetonitrile–water (10/90, v/v), and acetone–water (10/90, v/v) was investigated. The results indicated that methanol–water (5/95, v/v) as a washing solvent could obtain satisfactory recoveries of the six triazines (Fig. 5c) and produce a clear chromatogram. Therefore, methanol–water (5/95, v/v) was selected and its volume (2 × 0.3 mL, 2 × 0.5 mL, 2 × 0.75 mL, 2 × 1 mL) was optimized. As shown in Fig. 5d, 2 × 1 mL of methanol–water (5/95, v/v) was chosen as the washing solvent.
3.4.4. Effect of elution solution and volume. Methanol, methanol–water (9/1, v/v), methanol–acetic acid (9/1, v/v), methanol–water–acetic acid (8/1/1, v/v/v), methanol–ammonia (9/1, v/v) and acetonitrile were evaluated as the eluents to ensure that the six triazines were completely removed (Fig. 5e). The experimental results indicated that the best recoveries of the six triazines were obtained by using methanol–water (9/1, v/v) as the eluent. The six triazines are easily dissolved in methanol. Compared to acetic acid, water added into methanol would be beneficial to penetrate the MIRs. It is beneficial for the eluent to come into sufficient contact with the adsorbed triazines. Furthermore, the acid eluents are not conducive to destroying the hydrogen bond between the triazines and the acid phenolic hydroxyl of the resorcinol. Since the methanol–water (9/1, v/v) already obtained a higher recoveries, we selected it as the eluting solvent based on a simple green solvent consumption. The effects of elution volume on the recoveries were then optimized. As shown in Fig. 5f, the recoveries of the six triazines increased until the volume of methanol–water (9/1, v/v) reached 2 × 1 mL and then the recoveries were almost unchanged. Therefore, the optimal elution solvent is 2 × 1 mL of methanol–water (9/1, v/v).
3.5. Reusability of the MIRs
To investigate the reusability of the MIRs, consecutive adsorption–regeneration cycles were performed with the same MIRs. After each cycle, the MIRs were consecutively regenerated with 10 mL of methanol–water (9/1, v/v) and 10 mL of methanol under ultrasound conditions. The substantial amounts of solvents were used to reduce carryover effects and interferences between each adsorption–regeneration process. The first desorption was used to investigate the carryover effects of the six triazines. No triazines were detected. The MIR cartridges have been shown to be reusable up to 20 times. The first six adsorption–regeneration results are shown in Fig. 6. The results demonstrated that the MIRs are stable and may become an ideal candidate for pretreatment of aqueous samples.
 |
| Fig. 6 Reusability of the MIRs. | |
3.6. Evaluation of the method performance
3.6.1. Matrix effect. The matrix effects were evaluated by comparing the calibration curves of the blank honey extract and pure solvent at a concentration ranging from 0.5–100 ng g−1 for six triazines (Table 2). The results showed that the matrix effects of the proposed method had signal suppression (−1.0% to −10.8%) on the MS for the six triazines in the honey sample. The co-extracts and co-eluents of the honey samples during the enrichment process can seriously interfere in the analyte signals, which may affect accurate quantification of the trace analytes.12 Zhang et al. reported the signal enhancement (3.4–10.7%) for the same six triazines in milk samples.4 Zhao et al. reported the signal suppression or enhancement of the same six triazines in cereal samples.10 It also indicated that matrix effects could be greatly reduced by the method of selective extraction based on matrix calibration curves. Some other researchers have demonstrated that matrix effects can affect the accuracy of the results in HPLC-ESI-MS-MS.12,47,48 In order to reduce the errors caused by matrix effects, matrix-based calibration curves were applied for the reliable quantification of the six triazines in unknown honey samples in this method.
Table 2 Validation of the method
Analytes |
Calibration curve |
R2 |
Linearity range (ng g−1) |
LOQ (ng g−1) |
LOD (ng g−1) |
Matrix effects (%) |
Ametryn |
Y = 3521X + 19 555 |
0.999 |
0.5–100 |
0.08 |
0.03 |
−7.29 |
Atrazine |
Y = 527X + 200 |
0.999 |
0.5–100 |
0.06 |
0.02 |
−10.82 |
Desmetryn |
Y = 5872X + 3385 |
0.999 |
0.5–100 |
0.06 |
0.02 |
−7.77 |
Prometryn |
Y = 4035X + 1564 |
0.999 |
0.5–100 |
0.06 |
0.02 |
−7.65 |
Propazine |
Y = 150X + 18 |
0.999 |
0.5–100 |
0.50 |
0.15 |
−0.95 |
Simazine |
Y = 99X + 3 |
0.999 |
0.5–100 |
0.35 |
0.11 |
−8.14 |
3.6.2. Linearity and limit of detection. The excellent linearity of the method was obtained in the concentration range of 0.5–100 ng g−1 and the correlation coefficients were up to 0.999. The data from the calibration curves are also shown in Table 2. The limit of detection (LOD) and limit of quantification (LOQ) should be the minimum level of analyte which can be accurately identified and quantified using the method. The LODs and LOQs were defined as the signal-to-noise ratio of 3
:
1 and 10
:
1, respectively. The LODs and LOQs were ranging from 0.02 to 0.15 ng g−1 and 0.06 to 0.5 ng g−1 for the six triazines (Table 2), which is lower than other reported methods for the determination of triazines in honey samples.1,3,7–9,49 The HPLC-MS/MS extracted ion chromatograms of the spiked honey samples (0.5 ng g−1) are displayed in Fig. 7.
 |
| Fig. 7 HPLC-MS/MS extracted ion chromatograms of the six triazines obtained by the analysis of spiked honey samples (0.5 ng g−1). | |
3.6.3. Precision and recovery. Intra- and inter-day relative standard deviations (RSDs) were used to evaluate the precision of the proposed method (Table 3). Intra-day precision was performed by measuring the spiked honey sample six times in one day at three fortified levels of 0.5, 2, and 10 ng g−1. The values of the RSDs were in the range of 2.5–6.8%. The inter-day precision was performed by measuring spiked honey samples for six consecutive days at three levels of 0.5, 2, and 10 ng g−1. The obtained RSDs were in the range of 2.9–7.8%. In all three fortified concentrations, the recoveries of the six triazines ranged from 80% to 99%.
Table 3 The intra- and inter-day precisions and recoveries of the assay (n = 6)
Analyses |
Intra-day precision |
Inter-day precision |
0.5 ng g−1 |
2 ng g−1 |
10 ng g−1 |
0.5 ng g−1 |
2 ng g−1 |
10 ng g−1 |
Recovery (%) |
RSD (%) |
Recovery (%) |
RSD (%) |
Recovery (%) |
RSD (%) |
Recovery (%) |
RSD (%) |
Recovery (%) |
RSD (%) |
Recovery (%) |
RSD (%) |
Ametryn |
92 |
3.8 |
95 |
4.1 |
99 |
5.1 |
91 |
5.7 |
93 |
7.7 |
97 |
3.1 |
Atrazine |
84 |
6.3 |
92 |
5.7 |
93 |
4.8 |
82 |
4.6 |
88 |
5.5 |
94 |
4.6 |
Desmetryn |
89 |
3.2 |
95 |
5.9 |
96 |
3.9 |
88 |
4.5 |
89 |
7.4 |
96 |
4.8 |
Prometryn |
85 |
6.8 |
92 |
2.4 |
94 |
3.3 |
82 |
5.0 |
85 |
2.9 |
97 |
2.9 |
Propazine |
82 |
3.4 |
91 |
4.0 |
93 |
4.4 |
80 |
6.7 |
86 |
6.9 |
93 |
3.7 |
Simazine |
80 |
6.4 |
91 |
3.3 |
92 |
2.5 |
80 |
7.8 |
84 |
5.2 |
93 |
4.8 |
3.7. Application of the developed method
To further illustrate the applicability of the method, five honey samples were obtained from different supermarkets and farms (see 2.1. Reagents and materials). In sample 3 from Hebei ametryn was detected at a level of 1.3 ± 0.2 ng g−1. In order to further verify the accuracy of the method, the recoveries were investigated by spiking the five honey samples with the six triazines at a level of 5 ng g−1 (Table 4). Excellent recoveries in the range of 83 ± 4% to 97 ± 4% were obtained for the six triazines.
Table 4 Application of the method for the determination of triazines in different honey samples (%, mean ± S.D., n = 3)
Analytes |
Added (ng g−1) |
Sample 1 Changchun |
Sample 2 Changchun |
Sample 3 Hebei |
Sample 4 Henan |
Sample 5 Changbai Mountains |
Found (ng g−1) |
Recovery (%) |
Found (ng g−1) |
Recovery (%) |
Found (ng g−1) |
Recovery (%) |
Found (ng g−1) |
Recovery (%) |
Found (ng g−1) |
Recovery (%) |
Ametryn |
0 |
— |
— |
— |
— |
1.3 ± 0.2 |
— |
— |
|
— |
|
5 |
4.8 ± 0.2 |
97 ± 4 |
4.9 ± 0.2 |
99 ± 3 |
6.0 ± 0.1 |
95 ± 3 |
4.7 ± 0.2 |
93 ± 5 |
4.9 ± 0.2 |
97 ± 4 |
Atrazine |
0 |
— |
— |
— |
— |
— |
— |
— |
— |
— |
— |
5 |
4.7 ± 0.1 |
95 ± 2 |
4.6 ± 0.1 |
91 ± 3 |
4.6 ± 0.2 |
90 ± 5 |
4.7 ± 0.3 |
90 ± 5 |
4.9 ± 0.2 |
93 ± 4 |
Desmetryn |
0 |
— |
— |
— |
— |
— |
— |
— |
— |
— |
— |
5 |
4.7 ± 0.3 |
93 ± 5 |
4.6 ± 0.2 |
91 ± 3 |
4.7 ± 0.1 |
94 ± 2 |
4.6 ± 0.2 |
92 ± 4 |
4.6 ± 0.2 |
93 ± 4 |
Prometryn |
0 |
— |
— |
— |
— |
— |
— |
— |
— |
— |
— |
5 |
4.6 ± 0.2 |
91 ± 5 |
4.7 ± 0.2 |
93 ± 5 |
4.7 ± 0.2 |
94 ± 4 |
4.6 ± 0.2 |
92 ± 4 |
4.7 ± 0.2 |
95 ± 3 |
Propazine |
0 |
— |
— |
— |
— |
— |
— |
— |
— |
— |
— |
5 |
4.6 ± 0.2 |
91 ± 4 |
4.7 ± 0.2 |
93 ± 4 |
4.6 ± 0.2 |
92 ± 4 |
4.5 ± 0.2 |
91 ± 4 |
4.5 ± 0.2 |
90 ± 4 |
Simazine |
0 |
— |
— |
— |
— |
— |
— |
— |
— |
— |
— |
5 |
4.5 ± 0.3 |
90 ± 6 |
4.5 ± 0.3 |
90 ± 5 |
5.1 ± 0.3 |
88 ± 5 |
4.2 ± 0.2 |
83 ± 4 |
4.4 ± 0.1 |
88 ± 2 |
4. Conclusion
In this work, we have first developed a facile, novel and efficient approach to detect six triazine herbicides in honey samples based on hydrophilic MIRs followed by HPLC-MS/MS. The MIRs were prepared by using resorcinol and melamine co-condensation with formaldehyde in one pot instead of an allyl-dependent molecular imprinting polymerization process. The obtained MIRs have excellent dispersibility in water and a uniform spherical morphology. Owing to the higher selectivity and affinity to ametryn and its analogs, the MIRs were successfully applied as solid-phase extraction materials to rapidly extract and clean up six triazines in diluted honey samples. The proposed method has the potential to detect triazine herbicides in other water samples.
Acknowledgements
This work was supported by the Development Program of the Ministry of Science and Technology of Jilin Province, China (Grant number 20150204070GX).
Notes and references
- M. Hu, L. Wu, Y. Song, Z. Li, Q. Ma, H. Zhang and Z. Wang, Anal. Methods, 2015, 7, 9114–9120 RSC.
- I. Rezic, A. J. Horvat, S. Babic and M. Kastelan-Macan, Ultrason. Sonochem., 2005, 12, 477–481 CrossRef CAS PubMed.
- Y. Zhang, D. Chen and Y. Zhao, Anal. Methods, 2015, 7, 9867–9874 RSC.
- F. Zhang, Q. Zhao, X. Yan, H. Li, P. Zhang, L. Wang, T. Zhou, Y. Li and L. Ding, Food Chem., 2016, 197, 943–949 CrossRef CAS PubMed.
- N. Li, H. Jin, L. Nian, Y. Wang, L. Lei, R. Zhang, H. Zhang and Y. Yu, J. Chromatogr. A, 2013, 1304, 18–27 CrossRef CAS PubMed.
- P. Li, X. Yang, H. Miao, Y. Zhao, W. Liu and Y. Wu, Anal. Chim. Acta, 2013, 781, 63–71 CrossRef CAS PubMed.
- M. A. Farajzadeh, B. Feriduni and M. R. Mogaddam, J. Food Sci., 2014, 79, 2140–2148 CrossRef PubMed.
- C. Sánchez-Brunete, B. Albero, G. Martín and J. Tadeo, Anal. Sci., 2005, 21, 1291–1296 CrossRef.
- Y. Wang, J. You, R. Ren, Y. Xiao, S. Gao, H. Zhang and A. Yu, J. Chromatogr. A, 2010, 1217, 4241–4246 CrossRef CAS PubMed.
- Q. Zhao, H. Li, Y. Xu, F. Zhang, J. Zhao, L. Wang, J. Hou, H. Ding, Y. Li, H. Jin and L. Ding, J. Chromatogr. A, 2015, 1376, 26–34 CrossRef CAS PubMed.
- A. A. Elbashir and H. Y. Aboul-Enein, Biomed. Chromatogr., 2015, 29, 835–842 CrossRef CAS PubMed.
- H. Chen, S. Son, F. Zhang, J. Yan, Y. Li, H. Ding and L. Ding, J. Chromatogr. B, 2015, 983–984, 32–38 CrossRef CAS PubMed.
- F. Qiao, K. H. Row and M. Wang, J. Chromatogr. B, 2014, 957, 84–89 CrossRef CAS PubMed.
- R. Babine and S. Bender, Chem. Rev., 1997, 97, 1359–1472 CrossRef CAS PubMed.
- J. M. Lehn, Angew. Chem., Int. Ed. Engl., 1990, 29, 1304–1319 CrossRef.
- N. M. Maier and W. Lindner, Anal. Bioanal. Chem., 2007, 389, 377–397 CrossRef CAS PubMed.
- S. Xu, J. Li and L. Chen, J. Mater. Chem., 2011, 21, 4346–4351 RSC.
- A. Afkhami, H. Ghaedi, T. Madrakian, M. Ahmadi and H. Mahmood-Kashani, Biosens. Bioelectron., 2013, 44, 34–40 CrossRef CAS PubMed.
- H. Bao, T. Wei, X. Li, Z. Zhao, H. Cui and P. Zhang, Chin. Sci. Bull., 2012, 57, 2102–2105 CrossRef CAS.
- P. Cakir, A. Cutivet, M. Resmini, B. T. Bui and K. Haupt, Adv. Mater., 2013, 25, 1048–1051 CrossRef CAS PubMed.
- Q. Zhang, L. Jing, J. Zhang, Y. Ren, Y. Wang, Y. Wang, T. Wei and B. Liedberg, Anal. Biochem., 2014, 463, 7–14 CrossRef CAS PubMed.
- H. Yan, X. Cheng, N. Sun, T. Cai, R. Wu and K. Han, J. Chromatogr. B, 2012, 908, 137–142 CrossRef CAS PubMed.
- F. Horemans, A. Weustenraed, D. Spivak and T. J. Cleij, J. Mol. Recognit., 2012, 25, 344–351 CrossRef CAS PubMed.
- L. Mergola, S. Scorrano, R. Del Sole, M. R. Lazzoi and G. Vasapollo, Biosens. Bioelectron., 2013, 40, 336–341 CrossRef CAS PubMed.
- E. Benito-Pena, S. Martins, G. Orellana and M. C. Moreno-Bondi, Anal. Bioanal. Chem., 2009, 393, 235–245 CrossRef CAS PubMed.
- L. Qin, X. W. He, W. Y. Li and Y. K. Zhang, J. Chromatogr. A, 2008, 1187, 94–102 CrossRef CAS PubMed.
- W. Ji, H. Xie, J. Zhou, X. Wang, X. Ma and L. Huang, J. Chromatogr. B, 2016, 1008, 225–233 CrossRef CAS PubMed.
- W. Ji, M. Zhang, D. Wang, X. Wang, J. Liu and L. Huang, J. Chromatogr. A, 2015, 1425, 88–96 CrossRef CAS PubMed.
- W. Wei, R. Liang, Z. Wang and W. Qin, RSC Adv., 2015, 5, 2659–2662 RSC.
- R. Song, X. Hu, P. Guan, J. Li, C. Du, L. Qian and C. Wang, Mater. Sci. Eng., C, 2016, 60, 1–6 CrossRef CAS PubMed.
- C. Li, Y. Ma, H. Niu and H. Zhang, ACS Appl. Mater. Interfaces, 2015, 7, 27340–27350 CAS.
- S. Xu, H. Lu and L. Chen, J. Chromatogr. A, 2014, 1350, 23–29 CrossRef CAS PubMed.
- F. Puoci, F. Iemma, G. Cirillo, M. Curcio, O. I. Parisi, U. G. Spizzirri and N. Picci, Eur. Polym. J., 2009, 45, 1634–1640 CrossRef CAS.
- X. Shen and L. Ye, Chem. Commun., 2011, 47, 10359–10361 RSC.
- Z. F. Guo, T. T. Guo and M. Guo, Anal. Chim. Acta, 2008, 612, 136–143 CrossRef CAS PubMed.
- Y. Hao, R. Gao, L. Shi, D. Liu, Y. Tang and Z. Guo, J. Chromatogr. A, 2015, 1396, 7–16 CrossRef CAS PubMed.
- C. Yang, T. Lv, H. Yan, G. Wu and H. Li, J. Agric. Food Chem., 2015, 63, 9650–9656 CrossRef CAS PubMed.
- T. Lv, H. Yan, J. Cao and S. Liang, Anal. Chem., 2015, 87, 11084–11091 CrossRef CAS PubMed.
- H. Zhou, S. Xu, H. Su, M. Wang, W. Qiao, L. Ling and D. Long, Chem. Commun., 2013, 49, 3763–3765 RSC.
- Y. Hu, J. Pan, K. Zhang, H. Lian and G. Li, TrAC, Trends Anal. Chem., 2013, 43, 37–52 CrossRef CAS.
- J. Yu, M. Guo, F. Muhammad, A. Wang, G. Yu, H. Ma and G. Zhu, Microporous Mesoporous Mater., 2014, 190, 117–127 CrossRef CAS.
- G. P. Hao, W. C. Li, D. Qian and A. H. Lu, Adv. Mater., 2010, 22, 853–857 CrossRef CAS PubMed.
- H. Shen, E. Liu, X. Xiang, Z. Huang, Y. Tian, Y. Wu, Z. Wu and H. Xie, Mater. Res. Bull., 2012, 47, 662–666 CrossRef CAS.
- G. Rasines, P. Lavela, C. Macías, M. C. Zafra, J. L. Tirado, J. B. Parra and C. O. Ania, Carbon, 2015, 83, 262–274 CrossRef CAS.
- R. N. Singru, W. B. Gurnule, V. A. Khati, A. B. Zade and J. R. Dontulwar, Desalination, 2010, 263, 200–210 CrossRef CAS.
- M. W. Kujawski and J. Namieśnik, TrAC, Trends Anal. Chem., 2008, 27, 785–793 CrossRef CAS.
- B. K. Matuszewski, M. L. Constanzer and C. M. Chavez-Eng, Anal. Chem., 2003, 75, 3019–3030 CrossRef CAS PubMed.
- E. L. McClure and C. S. Wong, J. Chromatogr. A, 2007, 1169, 53–62 CrossRef CAS PubMed.
- L. Wu, Y. Song, M. Hu, C. Yu, H. Zhang, A. Yu, Q. Ma and Z. Wang, J. Sep. Sci., 2015, 38, 2953–2959 CrossRef CAS PubMed.
|
This journal is © The Royal Society of Chemistry 2016 |
Click here to see how this site uses Cookies. View our privacy policy here.