
High efficient light-emitting diodes based on liquid-type carbon dots
Xingru Chena,
Xue Bai*a,
Chun Suna,
Liang Sua,
Yiding Wanga,
Yu Zhang*a and
William W. Yuab
aState Key Laboratory on Integrated Optoelectronics, College of Electronic Science and Engineering, Jilin University, Changchun 130012, China. E-mail: baix@jlu.edu.cn; yuzhang@jlu.edu.cn
bDepartment of Chemistry and Physics, Louisiana State University, Shreveport, LA 71115, USA
First published on 30th September 2016
Abstract
Carbon dots (CDs) are considered as potential luminescent sources in light-emitting devices but CDs in the dry and solid aggregate state have strong luminescence quenching. Here we report monochromatic light-emitting diodes originating from the carbon dots in liquid format. The CDs were stored in a glass box and packaged with a UV-LED chip. These devices emitted stable luminescence colors ranging from blue to red, which were determined by the concentration of CDs in toluene. The maximum luminous efficiency was 2.27 times higher than that of solid devices. We further fabricated liquid type white light-emitting diodes with blue emissive CDs and green and red emissive colloidal semiconductor quantum dots which showed a high color rendering index (CRI) of 91 and a good stability.
1. Introduction
Since carbon dots (CDs) were first synthesized in 2006,1 they have attracted more and more attention due to their outstanding advantages such as chemical stability, biocompatibility, low toxicity, no optical blinking and low photobleaching.2–6 CDs have been applied in a lot of fields such as light-emitting diodes,7–9 bioimaging,4,10 cancer therapy,10–12 fluorescent inks13,14 and sensing.15–17 Furthermore, their excitation-dependent photoluminescence (PL) behavior is a promising character. Wang et al. dispersed CDs in the ionogel matrix to form CD-ionogels with simple full-color tunability of the emitting light which was promising for fabrication of flexible displays. Their work was achieved by the simple variation of the thickness of the CD-ionogels and the effects of combination of light reabsorption and excitation-dependent PL of CDs.18 Sun et al. further made use of the excitation wavelength dependent emission of CDs to fabricate a serious of monochrome light-emitting diodes (LEDs) by changing the thickness of the down conversion layers and the CD doping concentration in the polymer matrix.19 And a luminescent logo pattern with anti-counterfeiting security features was fabricated to show their potential in full-color displays.However, there is an issue that the CD-based solid-state luminescent devices are with relatively low luminescence because of luminescence quenching of CDs in dry and solid aggregate state.20–22 To prevent this issue, the CDs are generally dispersed in a polymer matrix to fabricate luminescent films or gel glasses.23–25 Nevertheless, these reported CD-based polymer materials generally have a fixed shape and CDs can't be recycled. It's inconvenient to use compared with phosphors in some applications.22
Therefore, we fabricated a serious of liquid-type CD-based LEDs which were pumped by UV-LED to avoid luminescence quenching and enhance the efficiency of LEDs. A glass-side-formed cavity was used to contain liquid type nanophosphors to protect them from environmental influences and enhance their stability. The emission colors of the monochromatic LEDs were determined by the concentration of CDs in toluene. This effect is based on the combination of reabsorption, reemission of light and the excitation-dependent PL behavior of CDs. In order to make full use of the advantage of CDs and the device, we made liquid-type white light-emitting diode (WLED). In addition to CDs for blue emitting, CdSe/CdS/ZnS red and CdSe/ZnS green quantum dots (QDs) were chosen as other two primary colors for their high quantum efficiency and high photostability.26 The as-prepared WLEDs exhibited a high CRI of 91 and a good optical stability against the increasing current.
2. Experimental section
2.1 Materials
N-(β-Aminoethyl)-γ-aminopropyl methyldimethoxy silane (AEAPMS, 97%) and anhydrous citric acid were purchased from Alfa Aesar. CdO (99.9%), zinc acetate (Zn(Ac)2, 99.99%), oleic acid (OA, 90%), 1-octadecene (ODE, 90%), trioctylphosphine (TOP, 90%), tributylphosphine (TBP, 90%) and decanethiol were purchased from Sigma-Aldrich. Other solvents and reagents were obtained from Beijing Chemical Factory. All chemicals were used directly without further purification. UV-LEDs (LTPL-C034UVH365) were purchased from Mouser Electronics.2.2 Synthesis of CDs
CDs were synthesized by an existing method with minor changes.27 10 mL of N-(β-aminoethyl)-γ-aminopropyl methyldimethoxy silane (AEAPMS) was placed in a 50 mL three-neck round-bottom flask, degassed with nitrogen for 20 min, and then heated up. 0.5 g of anhydrous citric acid was added under vigorous stirring when the temperature reached 240 °C. The mixture solution was kept at this temperature for 1 min, and then cooled down to room temperature naturally. The final solution was purified by precipitation with petroleum ether three times, and we obtained about 2 mL CDs.2.3 Synthesis of CdSe/CdS/ZnS multishell red quantum dots
CdSe/CdS/ZnS QDs were prepared by a typical method with multiple injections of precursors.26 1 mmol of CdO, 4 mmol of OA and 20 mL of ODE were loaded in a 100 mL three-neck flask, and elevated up to 300 °C with nitrogen to form clear precursors of Cd(OA)2. 0.25 mL of TOP dissolving 0.25 mmol of Se was swiftly injected into the reaction flask and the reaction mixture was maintained at 300 °C for 90 s for the growth of CdSe QDs. Then, to form CdS shell on top of CdSe cores, 0.75 mmol of decanethiol was dropwise added into the reaction flask. After 30 min of reaction, 4 mmol Zn(OA)2 and 2 mL of TBP dissolving 4 mmol of S were injected into the reactor in sequence to form ZnS outer shell on top of CdSe/CdS QDs. After the reaction temperature maintaining at 300 °C for 10 min, the reaction mixture was cooled down to room temperature to stop the reaction and purified by adding acetone to remove the unreacted precursors.28–30 After repeating this washing process three or five times, the QDs were precipitated with toluene three times and dispersed in toluene.2.4 Synthesis of CdSe/ZnS green quantum dots31
The synthesis of PbSe QDs was performed based on the method reported by Yu et al.32 First, PbO (0.892 g), OA (2.600 g) and ODE (12.848 g) were loaded into a three-neck flask. After removing the air in the flask with flowing N2, the flask was heated to 170 °C until the mixture turned to colorless. Then 6.9 mL Se–TOP (10 wt%) solution was quickly injected into the flask and the solution turned to brown. To obtain 4.5 nm PbSe QDs, the reaction temperature was kept at 140 °C for QD growth. After 3 min 50 s, the reaction was stopped by injecting room-temperature toluene. Then purification was performed.31 Methanol and hexane/acetone were employed to extract the PbSe QDs, respectively. Finally, the purified PbSe QDs were dispersed in toluene and stored in a N2-filled glove box.2.5 Fabrication of LEDs
The procedure of making glass-side-formed cavity is on the basis of the previous report.32 First, the glass substrate (thickness = 0.1 cm) was cut into strips and squares with the size of 1.6 cm × 0.3 cm, 1 cm × 0.3 cm, 0.8 cm × 0.3 cm and 1.6 cm × 1.6 cm, respectively. Second, sandwich two pieces of square glass together with four of these strips under the effect of epoxy adhesive. Different sizes of strips would make up two gaps for injecting liquid QDs and deairing. Finally, after injecting, the gaps were sealed with epoxy adhesive. UV-LED chips (0.345 cm × 0.345 cm) with the peak emission wavelength centered at 370 nm were used for the fabrication of LEDs.2.6 Characterizations
For Fourier transform infrared (FTIR) spectroscopy, AEAPMS and CD toluene solution were dropped onto the KBr pellets and the transmittance of each resulting pellet was taken on an FTIR spectrophotometer (IFS-66V/S). A fluorescence spectrometer (FLS920P, Edinburgh Instruments) equipped with an integrating sphere with its inner face coated with BENFLEC® was used to measure the absolute PL quantum yields of the liquid sample. Absorption and PL spectra measurements were recorded using a Shimadzu UV-3600 UV-visible spectrophotometer and an Edinburgh Instrument FLS920P fluorescence spectrometer, respectively. A 200 kV JEOLJEM-2100F high resolution transmission electron microscopy (HRTEM) was employed to obtain the images of the CDs. Transmission electron microscope (TEM) measurements were performed on a Philips TF-F20 at an operating voltage of 200 kV for researching the morphology of the CdSe/CdS/ZnS red QDs and CdSe/ZnS green QDs.Images of the LEDs outputs were recorded with a Nikon D7000 camera. Time-resolved photoluminescence measurements (TRPL) were measured using a time-correlated single-photon counting (TCSPC) lifetime spectroscopy system with a picosecond pulsed diode laser (EPL-390 nm) as the single wavelength excitation light source. A Keithley 2400 source meter and a Newport 1936-R power meter were used to measure the electrical characterization of the monochrome LEDs. A Zolix Omni-λ300 Monochromator/Spectrograph was used to perform the emission spectra of the monochrome LEDs at different working time intervals. All measurements were performed under dark condition. Optical parameters including chromaticity points (x, y), the correlated color temperature (CCT) and the color rendering index (CRI) were obtained from the SpectraWin software. The surface temperature of the WLEDs were measured using an infrared thermal image camera (FLIR T250).
3. Results and discussion
The blue luminescent CDs were prepared following the above-mentioned method. The morphology of CDs was characterized using high resolution transmission electron microscopy (HRTEM). HRTEM image of the CDs (Fig. 1a) shows they are monodisperse and spherical. In order to analyze the size of CDs, the histogram of particle size distributions was made (Fig. 1b), and the average diameter is 1.7 nm. FTIR spectrometer was used to detect the surface functional groups of AEAPMS and CDs (Fig. 1c). Both samples have similar stretching vibrations as follows: O–H, N–H, C–H, CH2, Si–O–C, Si–O–Si and Si–CH2. According to previous studies,27 the C![[double bond, length as m-dash]](https://www.rsc.org/images/entities/char_e001.gif) O absorption band at 1650 cm−1 which is only observed in CDs spectrum, together with two signals at 1005 and 1120 cm−1 from Si–O–C and Si–O–Si vibrations confirm that AEAPMS are capped onto the CD surfaces.
O absorption band at 1650 cm−1 which is only observed in CDs spectrum, together with two signals at 1005 and 1120 cm−1 from Si–O–C and Si–O–Si vibrations confirm that AEAPMS are capped onto the CD surfaces.
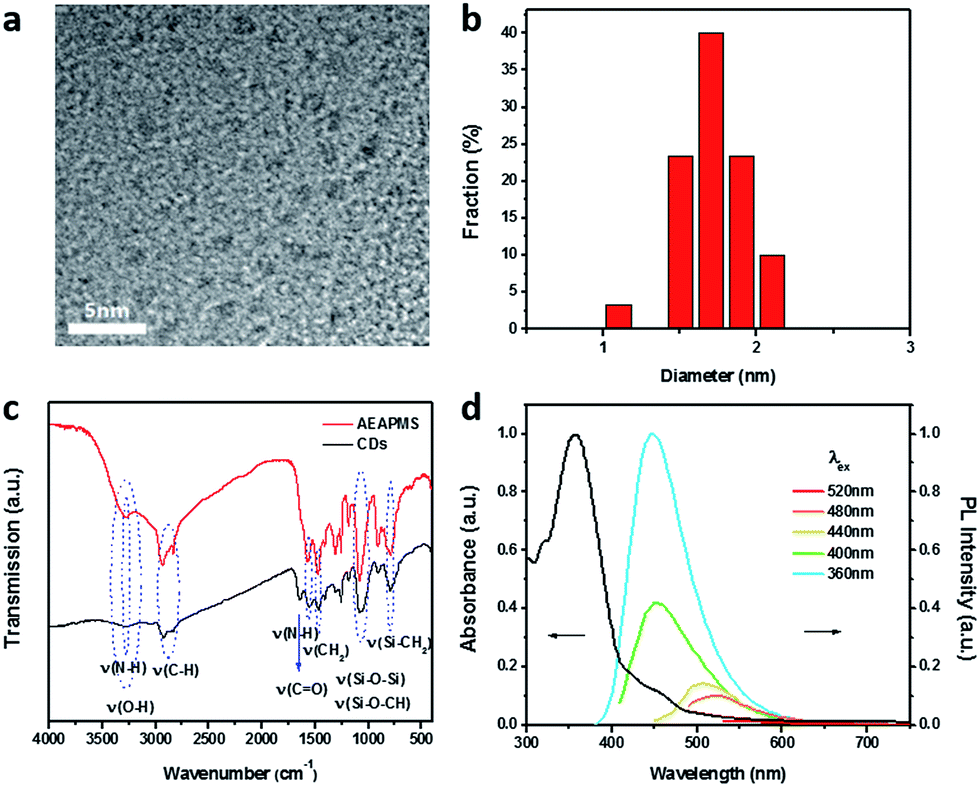 | ||
| Fig. 1 (a) TEM image of CDs; (b) particle size distribution of CDs; (c) FTIR spectra of AEAPMS and CDs; (d) UV-vis absorption and PL emission spectra of CDs obtained at excitation wavelengths in the range of 360 to 520 nm with 60 nm increments. | ||
The UV-vis absorption spectrum of CDs (Fig. 1d) displays an apparent absorption peak at 358 nm, which is ascribed to the presence of the n–π* transition of the CO bond. For PL spectra, the as-prepared CDs show excitation-dependent emission behaviour which is similar to the previous report.27,33–35 When the CDs are excited in the range of 360 to 400 nm, the emission peaks are at ∼450 nm. As the excitation wavelength further increases, the corresponding emission peak red-shifts. The whole process is accompanied continuously with an obvious decrease of PL intensity. The strongest PL intensity of CDs centers at 450 nm, with a PL quantum yield (QY) of 47% under the excitation wavelength at 360 nm (as shown in Table 1).
| Excitation wavelength (nm) | 320 | 340 | 360 | 380 | 400 | 420 |
| PL QY (%) | 22 | 39 | 47 | 43 | 41 | 18 |
A series of multicolor CD-LEDs were prepared by adjusting the concentration of CDs in toluene. The corresponding concentration is listed in Table 2. The four kinds of CD solutions with red, yellow, green and blue luminescence colors were respectively injected into glass-side-formed cavities which were prepared in advance. The corresponding PL spectra of the CD-LEDs are over the whole visible spectral range (Fig. 2a). As Fig. 2b shows, the Commission Internationale de L'Eclairage (CIE) coordinates of the blue, green, yellow and red emissive CD-LEDs are (0.164, 0.191), (0.276, 0.468), (0.429, 0.540) and (0.648, 0.347), respectively. The corresponding emitting images (Fig. 2c) show high brightness.
| Color | Red (R) | Yellow (Y) | Green (G) | Blue (B) |
| Concentration (mg mL−1) | 358 | 106 | 58 | 12 |
 | ||
| Fig. 2 (a) CD-LEDs' PL spectra of blue, green, yellow and red luminescence (under 3 V of UV-LED); (b) CIE color coordinates of blue, green, yellow and red emissive CD-LEDs; (c) true color photographs of monochrome CD-LEDs. | ||
We used time-resolved PL spectroscopy to make the physical origin of this effect clearly. In Fig. 3, the relatively large delay of the PL signal maximum and a gradually slower rise time are notably observed with increasing concentration. Meanwhile, the observed peak delay increased with the emission wavelength red shift. The decay rates and the rates in the tails of the decays are obviously similar. It is identical with the previous report,18 which indicates that the accumulation of the delay and rise time are attributed to the absorption and emission cycles. Our multicolor CD-LEDs are driven by consecutive reabsorption and reemission of light, accompanied by excitation-dependent PL behavior of CDs. When CDs with low concentration was excited by a UV-LED, the blue light emission peaked at 455 nm was obtained. As the increase of concentration, the number of CD particles in the solution increased, and the emission at 455 nm excited surrounding particles a green emission at 525 nm; excitation at that wavelength further results in a yellow luminescence peaked at 565 nm; eventually, a red emission peaked at 627 nm was obtained through the excitation by 565 nm.
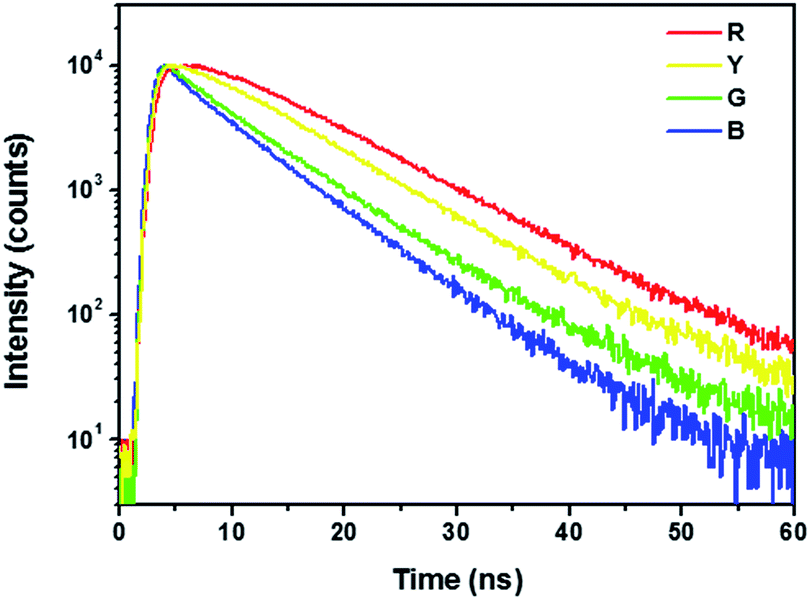 | ||
| Fig. 3 PL decay curves of the multicolour CDs under 390 nm excitation. | ||
To show the electrical characterization of CD-LEDs, we measured and calculated the luminous efficiency, as shown in Fig. 4a. The highest luminous efficiency reached 44.36 lm W−1 (2.75 cd A−1, which is higher than solid CD-LED of 1.21 cd A−1 (ref. 19)), corresponding to green CD-LED. The luminous efficiency of red CD-LED is relatively low. Besides of the low eye sensitivity to red light, red-emission CDs has strong reabsorption due to the high concentration and a low PL QY. The emission intensities at different working time intervals were measured to analyze the LEDs' stability. After 6 hours of continuous work, the emission intensities of all devices decreased slightly (Fig. 4b).
 | ||
| Fig. 4 (a) The luminous efficiency vs. current density of the LEDs with different concentration of the CDs; (b) PL intensity of the LEDs with different concentration of the CDs measured at different working time intervals. | ||
For WLEDs, we chose CdSe based QDs to compensate blue-emitting CDs on the longer wavelength luminescence. Fig. 5a and b show UV-vis absorption spectra, PL spectra and true-color images under UV light excitation of CdSe/ZnS green QDs and CdSe/CdS/ZnS red QDs, respectively. Two kinds of CdSe based QDs centered at 519 nm and 640 nm. The intensity ratio of three major peaks in emission spectra of WLEDs could be adjusted by varying the volume ratio of these three luminescence materials, as shown in Fig. 5c and Table 3. Table 3 shows the characteristics of the three fabricated WLED devices 1–3 (under 20 mA, 3 V), including CCT, CIE coordinate, and CRI. With the increase of red QDs and the decrease of green QDs, the CCT reduced from 5001 K to 3447 K, indicating that the white emission became warmer. When CIE color coordinates of the three devices were changed from (0.35, 0.39) to (0.40, 0.39), CRI ranged from 84 to 91.
 | ||
| Fig. 5 UV-vis absorption and PL spectra of (a) CdSe/ZnS green QDs, (b) CdSe/CdS/ZnS red QDs. The inset images are the corresponding true-color photographs of QDs emission in toluene under UV light excitation; (c) emission spectra of WLED device 1–3; (d) emission spectra of device 3 as a function of working current from 20 to 60 mA, with insets showing corresponding CIE color coordinates variation and true-color image of device 3 under 20 mA. | ||
![[thin space (1/6-em)]](https://www.rsc.org/images/entities/char_2009.gif) :CdSe/ZnS green QDs (9 mg mL−1):CDs (12 mg mL−1)), CCT, CIE color coordinates (x, y) and CRI of WLED devices 1–3
:CdSe/ZnS green QDs (9 mg mL−1):CDs (12 mg mL−1)), CCT, CIE color coordinates (x, y) and CRI of WLED devices 1–3
| Device | Volume ratio | CCT | CIE (x, y) | CRI |
|---|---|---|---|---|
| D1 | 0.2:0.8:0.1 |
5001 | (0.35, 0.39) | 84 |
| D2 | 0.5:0.1:0.1 |
3716 | (0.39, 0.39) | 86 |
| D3 | 0.8:0.1:0.05 |
3447 | (0.40, 0.39) | 91 |
To examine the optical stability of WLED, the emission spectra, the CCT, the color coordinates and the surface temperature of device 3 were recorded when working currents changed from 20 mA to 60 mA at intervals of 10 mA. Table 4 shows the tiny change of the WLED's surface temperature with the increase of working current. According to the previous report, as the temperature increases, the emission intensity of QDs decreases. Because the ligand is broken, and the QDs are aggregated and enlarged.36 The altering of the band structure leads to the red shift emission wavelength according to the quantum confinement effect.37 But the peaks of all three kinds of QDs in device 3 increased with the forward current and the peak wavelength didn't shift as shown in Fig. 5d. The insets in which the color coordinates changed from (0.40, 0.391) to (0.393, 0.384) around the black body locus and the CCT increased from 3447 K to 3533 K. The stable performance indicate the liquid-type WLED can reduce the influence of thermal effects on CdSe based QDs, keep the efficiency of the QDs, and have a good reliability.
| Current (mA) | 20 | 30 | 40 | 50 | 60 |
| Temperature (°C) | 24 | 25 | 27 | 29 | 31 |
4. Conclusions
In summary, we have fabricated full-color LEDs which were based on CDs in liquid format to solve the luminescence quenching of CDs in solid aggregate state. The glass box used in our LED devices prevents the volatilization of toluene and the influence of external condition. The monochrome CD-LEDs were made by adjusting the concentration of CDs in toluene and the maximum luminous efficiency of 44.36 lm W−1 was apparently higher than the solid-state LEDs. The LEDs showed good stability over continuous working. Liquid-type WLEDs with good stability against increased current and high CRI of 91 were fabricated by combining blue-emitting CDs with CdSe/CdS/ZnS red QDs and CdSe/ZnS green QDs. This work provides a new way to develop high efficient liquid-type CD-based LEDs applicable for displays and lighting.Acknowledgements
This work was supported by the National Natural Science Foundation of China (51272084, 61306078, 61225018, 61475062, 61675086), the Jilin Province Key Fund (20140204079GX), NSF (1338346), and BORSF LA.References
- Y. Sun, B. Zhou, Y. Lin, W. Wang, K. A. S. Fernando, P. Pathak, M. J. Meziani, B. A. Harruff, X. Wang, H. Wang, P. G. Luo, H. Yang, M. E. Kose, B. Chen, L. M. Veca and S. Y. Xie, J. Am. Chem. Soc., 2006, 128, 7756–7757 CrossRef CAS PubMed.
- L. Cao, M. J. Meziani, S. Sahu and Y. Sun, Acc. Chem. Res., 2013, 46, 171–180 CrossRef CAS PubMed.
- S. Yang, X. Wang, H. Wang, F. Lu, P. G. Luo, L. Cao, M. J. Meziani, J. Liu, Y. Liu, M. Chen, Y. Huang and Y. Sun, J. Phys. Chem. C, 2009, 113, 18110–18114 CAS.
- S. C. Ray, A. Saha, N. R. Jana and R. Sarkar, J. Phys. Chem. C, 2009, 113, 18546–18551 CAS.
- S. Yang, L. Cao, P. G. Luo, F. Lu, X. Wang, H. Wang, M. J. Meziani, Y. Liu, G. Qi and Y. Sun, J. Am. Chem. Soc., 2009, 131, 11308–11309 CrossRef CAS PubMed.
- R. Liu, D. Wu, S. Liu, K. Koynov, W. Knoll and Q. Li, Angew. Chem., 2009, 121, 4668–4671 CrossRef.
- C. Sun, Y. Zhang, Y. Wang, W. Liu, S. Kalytchuk, S. V. Kershaw, T. Zhang, X. Zhang, J. Zhao, W. W. Yu and A. L. Rogach, Appl. Phys. Lett., 2014, 104, 261106 CrossRef.
- X. Zhang, Y. Zhang, Y. Wang, S. Kalytchuk, S. V. Kershaw, Y. Wang, P. Wang, T. Zhang, Y. Zhao, H. Zhang, T. Cui, Y. Wang, J. Zhao, W. W. Yu and A. L. Rogach, ACS Nano, 2013, 7, 11234–11241 CrossRef CAS PubMed.
- C. Sun, Y. Zhang, K. Sun, C. Reckmeier, T. Zhang, X. Zhang, J. Zhao, C. Wu, W. W. Yu and A. L. Rogach, Nanoscale, 2015, 7, 12045–12050 RSC.
- K. Hola, Y. Zhang, Y. Wang, E. P. Giannelis, R. Zboril and A. L. Rogach, Nano Today, 2014, 9, 590–603 CrossRef CAS.
- S. Nie, Nanomedicine, 2010, 5, 523–528 CrossRef PubMed.
- V. Kumar, G. Toffoli and F. Rizzolio, ACS Med. Chem. Lett., 2013, 4, 1012–1013 CrossRef CAS PubMed.
- J. Wang, C. Wang and S. Chen, Angew. Chem., 2012, 124, 9431–9435 CrossRef.
- S. Qu, X. Wang, Q. Lu, X. Liu and L. Wang, Angew. Chem., 2012, 124, 12381–12384 CrossRef.
- C. Sun, Y. Zhang, P. Wang, Y. Yang, Y. Wang, J. Xu, Y. Wang and W. W. Yu, Nanoscale Res. Lett., 2016, 11, 1–9 CrossRef CAS PubMed.
- L. Zhang, Y. Han, J. Zhu, Y. Zhai and S. Dong, Anal. Chem., 2015, 87, 2033–2036 CrossRef CAS PubMed.
- H. Nie, M. Li, Q. Li, S. Liang, Y. Tan, L. Sheng, W. Shi and S. X. A. Zhang, Chem. Mater., 2014, 26, 3104–3112 CrossRef CAS.
- Y. Wang, S. Kalytchuk, Y. Zhang, H. Shi, S. V. Kershaw and A. L. Rogach, J. Phys. Chem. Lett., 2014, 5, 1412–1420 CrossRef CAS PubMed.
- C. Sun, Y. Zhang, S. Kalytchuk, Y. Wang, X. Zhang, W. Gao, J. Zhao, K. Cepe, R. Zboril, W. W. Yu and A. L. Rogach, J. Mater. Chem. C, 2015, 3, 6613–6615 RSC.
- D. Pan, J. Zhang, Z. Li, Z. Zhang, L. Guo and M. Wu, J. Mater. Chem., 2011, 21, 3565–3567 RSC.
- Z. Xie, F. Wang and C. Liu, Adv. Mater., 2012, 24, 1716–1721 CrossRef CAS PubMed.
- M. Sun, S. Qu, Z. Hao, W. Ji, P. Jing, H. Zhang, L. Zhang, J. Zhao and D. Shen, Nanoscale, 2014, 6, 13076–13081 RSC.
- W. Kwon, G. Lee, S. Do, T. Joo and S. Rhee, Small, 2014, 10, 506–513 CrossRef CAS PubMed.
- S. K. Bhunia, S. Nandi, R. Shikler and R. Jelinek, Nanoscale, 2016, 8, 3400–3406 RSC.
- W. Wei, C. Xu, L. Wu, J. Wang, J. Ren and X. Qu, Sci. Rep., 2014, 4, 3564 Search PubMed.
- L. Yan, Y. Zhang, X. Zhang, J. Zhao, Y. Wang, T. Zhang, Y. Jiang, W. Gao, J. Yin, J. Zhao and W. W. Yu, Nanotechnology, 2015, 26, 135201–135207 CrossRef PubMed.
- F. Wang, Z. Xie, H. Zhang, C. Liu and Y. Zhang, Adv. Funct. Mater., 2011, 21, 1027–1031 CrossRef CAS.
- X. Zhang, Y. Zhang, L. Yan, C. Ji, H. Wu, Y. Wang, P. Wang, T. Zhang, Y. Wang, T. Cui, J. Zhao and W. W. Yu, J. Mater. Chem. A, 2015, 3, 8501–8507 CAS.
- P. Gu, Y. Zhang, Y. Feng, T. Zhang, H. Chu, T. Cui, Y. Wang, J. Zhao and W. W. Yu, Nanoscale, 2013, 5, 10481–10486 RSC.
- Y. Zhang, Q. Dai, X. Li, B. Zou, Y. Wang and W. W. Yu, J. Nanopart. Res., 2011, 13, 3721–3729 CrossRef CAS.
- W. K. Bae, K. Char, H. Hur and S. Lee, Chem. Mater., 2008, 20, 531–539 CrossRef CAS.
- C. W. Sher, C. H. Lin, H. Y. Lin, C. C. Lin, C. H. Huang, K. J. Chen, J. R. Li, K. Y. Wang, H. H. Tu, C. C. Fu and H. C. Kuo, Nanoscale, 2016, 8, 1117–1122 RSC.
- H. Li, X. He, Y. Liu, H. Huang, S. Lian, S. T. Lee and Z. Kang, Carbon, 2011, 49, 605–609 CrossRef CAS.
- X. Bai, G. Caputo, Z. Hao, V. T. Freitas, J. Zhang, R. L. Longo, O. L. Malta, R. A. S. Ferreira and N. Pinna, Nat. Commun., 2014, 5, 5702 CrossRef CAS PubMed.
- X. Bai, A. Pucci, V. T. Freitas, R. A. S. Ferreira and N. Pinna, Adv. Funct. Mater., 2012, 22, 4275–4283 CrossRef CAS.
- V. Biju, Y. Makita, A. Sonoda, H. Yokoyama, Y. Baba and M. Ishikawa, J. Phys. Chem. B, 2005, 109, 13899–13905 CrossRef CAS PubMed.
- K. J. Chen, H. C. Chen, M. H. Shih, C. H. Wang, M. Y. Kuo, Y. C. Yang, C. C. Lin and H. C. Kuo, J. Lightwave Technol., 2012, 30, 2256–2261 CrossRef CAS.
| This journal is © The Royal Society of Chemistry 2016 |