Synergy of graphene oxide–silver nanocomposite and amphiphilic co-polymer F127 on antibacterial properties and permeability of PVDF membrane

Gui-E Chen*a, Qiong Wua, Wei-Guang Suna, Zhen-Liang Xu*b, Sun-Jie Xuab, Wei-Wei Zhua and Xiao-Peng Zhenga
aSchool of Chemical and Environmental Engineering, Shanghai Institute of Technology, 100 Haiquan Road, Shanghai 201418, China. E-mail: chenguie@sit.edu.cn; Fax: +86-21-64941192; Tel: +86-21-64941192
bState Key Laboratory of Chemical Engineering, Membrane Science and Engineering R&D Lab, Chemical Research Center, East China University of Science and Technology, 130 Meilong Road, Shanghai 200237, China. E-mail: chemxuzl@ecust.edu.cn; Fax: +86-21-64252989; Tel: +86-21-64253670

Received 14th August 2016 , Accepted 15th October 2016

First published on 17th October 2016


Abstract

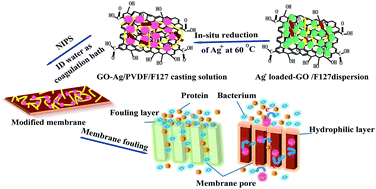
A graphene oxide–silver (GO–Ag) nanocomposite was formed by in situ reduction in the casting solution and was employed to decorate polyvinylidene fluoride (PVDF) membrane, together with amphiphilic co-polymer F127. The finger-like macro-voids morphology and surface roughness of modified membranes were presented by SEM and AFM microscopy. The FTIR spectrum and XPS analysis confirmed that the hydrophilic component contributed to the membrane wettability and permeability, while the graphene oxide–silver nanocomposite was conductive to membrane antimicrobial activity. Results indicated that under the comprehensive optimal conditions the prepared membranes possessed pure water flux of 269 L m−2 h−1 and BSA rejection ratio of 98.2%, the dynamic contact angles ranged from 60.5° to 10° within 80 s and the inhibition zone sizes against E. coli and S. aureus were 3 mm and 2 mm, respectively. Overall, the permeability, hydrophilicity and antibiofouling of modified membranes were regulated by the synergism between multifunctional modifier GO–Ag and F127 in a controllable blending-reaction modification process.


1 Introduction

The promising applications of modified membranes in refined separation processes have sparked considerable attention for improving the hydrophilicity and anti-fouling of conventional polymer membranes.1,2 As the protagonist of membrane modification, PVDF has received great favor with regard to its outstanding properties such as high thermal stability, hydrolytic stability, good chemical resistance as well as mechanical and membrane forming properties.3–5 To endow the pristine PVDF membranes with superior hydrophilicity and antibiofouling properties without changing the original performance via suitable modification method is the tendency to embroad applications.6–8

Typically, a feasible way to achieve the hydrophilization of hydrophobic surface of PVDF membranes is to blending hydrophilic modifier or surfactant into casting solution,9,10 such as polyvinyl alcohol (PVA)11 polyvinyl pyrrolidone (PVP)12 and polyethylene glycol (PEG).13 It is noteworthy that these polymers are preferably water soluble and will be washed out of the matrix during membrane formation and subsequent operation due to the poor compatibility between hydrophilic polymers and hydrophobic PVDF matrix.14–16 On the contrary, the amphiphilic co-polymer Pluronic F127 is a highly appropriate modifier for PVDF membrane because membrane compatibility can be guaranteed by the interaction between hydrophobic polymer PVDF and the hydrophobic PPO segments, while membrane stability and water-insoluble property can be enhanced owing to the abundant hydrophilic chains PEO onto the hydrophobic membrane backbone. Many meaning works on improving the porosity, permeability and ionic conductivity of membranes using F127 as modifier have been reported.17–19 For instance, the remarkable enhancement of membrane porosity and electrolyte uptake owing to the excellent affinity between F127 and membrane matrix was supported by Cui et al.20

Recently, many attempts of introducing inorganic functional materials into hybrid membranes to enhance performances such as permeability, wettability, thermal stability and mechanical properties have pioneered an advantageous path to achieve the ideal modification of membrane. Especially, the increasing prevalence of antibiotic-resistant strains have resulted in the devotion of much more efforts to the development of effective, non-toxic, and durable antibacterial modified membranes.21–23 The antibacterial properties of nanomaterials have been employed decorating membrane to meet antibiotic-resistant challenges, including silver nanoparticles24–27 and graphene.28–30 Among them, silver nanoparticles (AgNPs) have attracted much attention due to their unique electronic, antibacterial ability, optical and catalytic properties in membrane modification. Although AgNPs can cause aggregation easily and get deterioration of their antibacterial properties, the agglomeration can be minimized by the methods of in situ formation via sol–gel process or addition auxiliary component to create an interactional bridge for nanoparticles in membrane formation process.

It is interestingly found that graphene oxide (GO) featured of hydrophilicity, extraordinary electrical, thermal, mechanical, structural properties and low systemic toxicity is a promising candidate supporting substrate bridge. Kumar et al. confirmed that GO–TiO2 nanocomposite can be synthesized by in situ sol–gel reaction and the membranes blending GO–TiO2 achieved the outstanding porosity, hydrophilicity, charge density and fully developed finger-like macro-voids.31 Traditionally, preparation methods of graphene-based AgNPs involve chemical reaction process occurring in solution using chemical agent as a reductant, such as sodium citrate,32 sodium borohydride (NaBH4)33 and organic solvents. Many studies seeked ideas from the developed chemical reduction technique to obtain AgNPs embedded on graphene. Li et al. verified that a simple and green synthetic method of graphene supported AgNPs composite was employed to modify PVDF membrane employing DMF as reaction medium and metal salts as reactants for preparing non-aqueous Ag colloids.34 Vatanpour et al. proclaimed that the prepared Ag-loaded graphene oxide contributed to the anti-fouling, anti-bacterial and asymmetric micro-structure of modified PES membranes.35

It's reported that the hydrophilic groups on the surface of nanocomposite contribute to the overall properties of membrane, especially water permeability, hydrophilicity and anti-biofouling ability.36 A sparking inspiration to manufacture a novel membrane with high antimicrobial activity and good hydrophilicity is from comparison of quantities of outstanding literature researches37–43 shown in ESI T1. In this paper, a facial in situ reduction method was employed to make an ingenious combination that implants the unique synergism between antimicrobial activity of graphene-based AgNPs and the affinity of amphiphilic F127 into casting solution to obtain superior membrane. It is expected that the modified PVDF membranes could exhibit significant advantages, such as uniform and run-through fingerlike structure, high permeability, splendid antimicrobial activity and admirable hydrophilicity.

2 Experimental

2.1. Materials

Polyvinylidene fluoride (PVDF, Solef® 6010) was purchased from Solvay Advanced Polymers, L.L.C (Alpharetta GA, USA). PEO–PPO–PEO triblock co-polymer Pluronic F127 (MW = 12.6 kg mol−1; PEO weight content, % PEO = %70) was purchased from BASF Corporation (USA). Silver nitrate (AgNO3, AR), graphite, potassium permanganate (KMnO4, AR) hydrochloric acid (HCl, 37%), and sulphuric acid (H2SO4, 98%) ere acquired from Shanghai Sinopharm Chemical Reagent Co. LTD (China). Polyvinylpyrrolidone (PVP K25) and dimethylformamide (DMF, purity > 99.0%, AR) were purchased from Shanghai Titan Scientific Co., Ltd. Bovine serum albumin (BSA) (MW = 67 kDa) was obtained from Lianguan Biochemical Reagent Company of Shanghai. Culture solution, S. aureus and E. coli were offered by microbiology Lab. Deionized water and GO were manufactured by our own lab. All other chemicals used for experiments were analytical grade.

2.2. Synthesis of GO

GO was synthesized by a pressurized oxidation:44 graphite, potassium permanganate (KMnO4), sulphuric acid (H2SO4, 98%) and a Teflon reactor were completely cooled in ice bath at 2 °C before use. The cooled graphite (1.0 g) and KMnO4 (5.0 g) were put into the reactor (100 mL) in a stainless steel autoclave and followed by the addition of sulphuric acid (50 mL). As soon as the sulphuric acid was added, the reactor and stainless steel autoclave were covered and fasten down. The autoclave firstly was kept at 2 °C in an ice bath for 1.5 h and then heated at 80 °C in an oven for further reaction of 1.5 h. Then obtained brown dope solution was diluted with 150 mL water, after H2O2 (30%) was dripped into the aforementioned suspension with mechanical stirring until the slurry turned bright yellow. Subsequently, the suspension was centrifugally washed several times with HCl and deionized water at 10[thin space (1/6-em)]000 rpm for 10 min to remove residues until the pH value reached to 7, and then the humid GO was dried in a vacuum oven at 60 °C for use.

2.3. In situ preparation of GO–Ag/PVDF/F127 membranes

GO–Ag/PVDF/F127 membranes were prepared by non-solvent induced phase inversion (NIPS) method. The formulae of casting solutions were shown in Table 2. The homogeneous GO dispersion was obtained by sonication in DMF (as a reagent and reducer) in a conical flask, after PVP and various amounts of AgNO3 were added. Then PVDF and F127 were put into previous mixture with vacuum degassing and magnetic stirring for 6 h at 20 °C to attain pre-reaction solution followed by in situ reduction of Ag+ at 60 °C for 10 h. After degassing for 8 h, the uniform casting solutions were cast on glass plates with a steel knife and then immersed in the deionized water (DI water) coagulation. Afterwards, the peeling membranes were washed repeatedly for 72 h with DI water to thoroughly remove residues and kept in DI water before further characterization. The preparation mechanism schematic diagram of the modified membranes was shown in Scheme 1.
image file: c6ra20513e-s1.tif
Scheme 1 The synthesis mechanism of the modified membrane.

2.4. Characterization

2.4.1. Membrane porosity and pore size measurement. The membrane porosity ε (%) was measured using gravimetric method.45 A prepared membrane was cut into a platelet with a constant area (A) of 38.5 cm2 and weighed for w1 after the surface moisture being wiped out. Then the membrane was dried in an oven until its weight had been constant and the weight was taken as w2. The membrane porosity ε (%) was calculated with eqn (1):
 
image file: c6ra20513e-t1.tif(1)
where w1 is denoted the weight (g) of wet membrane and w2 is denoted the weight of dry membrane (g). ρw is the water density (0.998 g cm−3). δ is average thickness (cm) of five samples from different membranes with an identical content.

Mean pore size rm was determined by the filtration velocity method according to the Guerout–Elford–Ferry eqn (2):46,47

 
image file: c6ra20513e-t2.tif(2)
where ε is the porosity of the operating membrane. d is the average thickness (m) of selected samples in the filtration process. Q (m3 s−1) is the flux of the pure water. ΔP is the operating pressure (0.1 MPa). A is the effective area of membrane (m2) and γ is the viscosity of the pure water in the filtrating (8.9 × 10⁻⁴ Pa s).

2.4.2. Contact angle measurement. The dynamic contact angle (θ) of the membranes was investigated by the contact angle measurement (JC2000D, Shanghai Zhongcheng Digital Technology Apparatus Co., Ltd., China) at ambient temperature with image capture of 4 frames per s. To ensure that the results were fully authentic and reduce the experimental errors in measuring θ values, each set of sample was measured in quintuplicate, and the average data of the contact angles was used.
2.4.3. Membrane chemical composition analysis. The resultant membranes surface was detected by UV-visible spectroscopy (UV-vis, UV-3600, Japan) over the range of 200–800 nm to affirm the introduction of GO and the formation of AgNPs in membrane preparation process.

The Fourier transform infrared (FT-IR, Thermo Nicolet iZ10, USA) spectroscopy was employed to analyze membranes composition at the wavelength range of 500 to 4000 cm−1.

X-ray diffraction (XRD, X/Pert Pro, Holland) were applied to analyze the membrane composition and crystal structure.

X-ray photo-electron spectroscopy (XPS, Thermo ESCALAB 250Xi, USA) was applied to examine the chemical compositions of blend membrane surfaces and confirmation of Ag element using Mg Kα X-ray radiation (1361 eV) as radiation source.

2.4.4. Membrane morphology. The surface and cross-sectional morphology of modified membranes were observed by scanning electronic microscopy (SEM, Hitachi S-3400N, Japan). The membrane samples were fractured in liquid nitrogen and sputtered with gold to make good conductivity.

Atomic force microscopy (AFM, Veeco, NanoScope IIIa Multimode AFM, USA) was conducted to analyze the surface topography and roughness of prepared membranes. The membrane surfaces were imaged with a scan size of 5 μm × 5 μm. The surface roughness was obtained in terms of arithmetical mean deviation roughness (Ra) and root mean square roughness (Rms).

2.4.5. Thermal property of membranes. The thermal behaviors of the membranes were determined by a simultaneous TG/DTA measuring instrument (Diamond TG/DTA, USA). The selected membranes were cut into small pieces (5–8 mg) prior to experiments and sealed in aluminum pans, and thermograms were recorded from 50 to 600 °C at a heating rate of 10 °C min−1 under a constant flow of nitrogen.

2.5. Ultra-filtration experiments

The filtration performance of the pristine and modified PVDF membrane was measured by a dead-end filtration equipment designed by our lab. All filtration experiments were carried out at 25 °C and membranes were preloaded at 0.15 MPa for 30 min before measurement. The pure water flow rate of a membrane was characterized at the pressure of 0.1 MPa for 1 h, Jw1 (L m−2 h−1) calculated as follow:47
 
image file: c6ra20513e-t3.tif(3)
where V (L) is volume of water permeation during an experimental time interval Δt (h) and A (A = 0.385 m2) is the effective area of membrane. Afterwards, BSA solution (1 mg mL−1) was forced to permeate through the membrane for 2 h to measure polluted flux Jp (L m−2 h−1) and protein rejections, which were computed by determining the concentration of proteins in the feed and permeate solutions by UV-spectrophotometer (UV-9200) at a wavelength of 278 nm. The protein rejection ratio (R) was defined by the following expression:48
 
image file: c6ra20513e-t4.tif(4)
where Cp and Cf (mg mL−1) are the protein concentrations of permeation and feed solutions, respectively. After the filtration of protein solution, the membranes were washed with deionized water for 20 min and the water fluxes of cleaned membranes Jw2 (L m−2 h−1) was measured again. In order to evaluate the fouling-resistant ability of membranes, flux recovery ratio (FRR) was calculated using the equation:47,48
 
image file: c6ra20513e-t5.tif(5)

Rt is defined to further describe the fouling-resistant ability of the modified membranes at the degree of total flux loss caused by total fouling:49,50

 
image file: c6ra20513e-t6.tif(6)
where Jp and Jw1 are polluted flux and water flux, respectively.

2.6. Microorganism attachment test

The antibacterial activities of the prepared membranes were tested on both Gram-positive and Gram-negative bacteria. In this study, E. coli and S. aureus were used as model organisms, which were grown in the prepared liquid Luria-Bertani (LB) media at 37 °C for use. Then solid LB media were prepared, each code of membranes was cut into a 1 cm diameter disk and the model bacterial solutions were freshly prepared for each experiment, respectively. Afterwards two kinds of bacteria were inoculated on the prepared media by plate smearing method and the membrane disks were placed on the inoculated agar plates culturing for 24 h at 37 °C. All experiments were done under bacteria-free environment. The inhibition zone formed after 24 h served as an indicator for the antibacterial property and was recorded by a digital camera.

3 Results and discussion

3.1. Characterization of modified membrane

In the formation process of AgNPs, abundant of oxygenated groups on the GO nanolamellas51 (as shown in Fig. 1 and ESI F1) provide Ag+ absorption sites and act as stabilizer. Compared with control membranes (PPM, PFM and PPFM0), there are some characteristic absorption peaks of modified membranes (from PPFM1 to PPFM4) on GO and AgNPs as shown in Fig. 2. The UV-vis spectra of prepared membranes decorated by graphene oxide–silver nanocomposite exhibited maximum peaks at 253 nm corresponding to the electronic π–π* transitions of aromatic of C–O bonds and at 414 nm assigning to the characteristic surface plasmon band of AgNPs, which indicated the formation of AgNPs on GO nanosheets in fabricated membranes.
image file: c6ra20513e-f1.tif
Fig. 1 SEM image of GO nanolamella dispersed in ethanol.

image file: c6ra20513e-f2.tif
Fig. 2 UV-vis absorption spectra of prepared membranes.

Conventionally, FTIR spectrum is a valuable technique in detecting the composition and conformation of the polymeric segments in the modified membrane. The weak absorption peak of –OH stretching at 3400 cm−1 can been seen in the ESI F2, which may be ascribed to the appeared dampening of the peak around 3400 cm−1 due to the layered GO in modified membranes. Comparison of membrane absorbance spectra from PPM to PPFM4 was shown in Fig. 3, the expected absorbance for carbonyl groups at 1653 cm−1 and the characteristic absorbance for the C–O or C–O–C bands at 1073 cm−1, 1170 cm−1 and 2350 cm−1 are observed, of which the absorbance at 2350 cm−1 was attributed to the stretching vibration of C–O–C of PEO and PPO blocks, while GO consists of distinctive absorbance of carbonyl groups and C–O–C bands at 1170 cm−1, testified that these functional groups had been imported successfully in prepared membranes. Additionally, there is an obvious absorption change that the intensity of peak at 1275 cm−1 gradually increase but the intensity of peak at 1232 cm−1 became weak from membrane PPM to PPFM4, which may indicated crystalline transformation from γ-crystal phase absorption at 1232 cm−1 to β-crystal phase absorption at 1275 cm−1 in prepared membranes15,40,52 (as shown in ESI F3 and F4). That may be induced by the crystallization behavior of graphene oxide–silver nanocomposite.


image file: c6ra20513e-f3.tif
Fig. 3 FTIR spectra of the prepared membranes.

The main elements of different membrane surfaces were shown by XPS analysis evaluations. Fig. 4(A and B) shown wide-scan spectra for C1s, O1s, F1s and Ag3d spectra of selected membranes, of which there were different intensity signs of Ag3d existed in modified membranes (from PPFM1 to PPFM4). The surface elemental compositions of prepared membranes were summarized in Table 2, in which the relative Ag and O atom percent remained increase with the additives adding. But membrane PPFM4 given a less increase of Ag content compared with PPFM3 according to the Table 1, which may be caused by the accumulation of GO nanolamellas harmful for Ag loading. In addition, the C/F rations in as-prepared membranes have no dramatic change and kept high value, which may be attributed to the fact that C–F binding is not damaged in test condition, and element F did not go away by repeating scans and segregate to the membrane surface to increase the F ratio.


image file: c6ra20513e-f4.tif
Fig. 4 The XPS wide-scan spectra (A) and Ag3d core-level spectra (B) of prepared membranes.
Table 1 The formation of casting solution for modified membranes
M. N. Composition of casting solution (g) Aga (%)
PVDF PVP F127 GO AgNO3 DMF
a The weight ratios of Ag in the casting solution.
PPM 18.0 1.8 0.00 0.00 0.00 80.2 0.00
PFM 18.0 0.0 1.8 0.00 0.00 80.2 0.00
PPFM0 18.0 1.8 1.8 0.00 0.00 78.4 0.00
PPFM1 18.0 1.8 1.8 0.05 0.25 78.1 0.16
PPFM2 18.0 1.8 1.8 0.10 0.50 77.8 0.32
PPFM3 18.0 1.8 1.8 0.20 1.00 77.2 0.64
PPFM4 18.0 1.8 1.8 0.30 1.50 76.6 0.96


Table 2 Elemental compositions of different membranes analyzed by XPS
Sample Atom percent (at%)
C1s O1s F1s Ag3d (C/F)a
a The atom percent ratio of elemental C and F in prepared membranes. Measurement conditions: 1 scan, 2 m 16.0 s, 500 μm CAE 50.0, 1.00 eV.
PPM 57.40 0.00 42.60 0.00 1.35
PFM 52.90 6.20 40.90 0.00 1.29
PPFM0 50.99 4.76 44.25 0.00 1.15
PPFM1 52.84 4.98 42.09 0.09 1.26
PPFM2 53.56 5.20 40.75 0.13 1.31
PPFM3 54.12 5.57 40.14 0.17 1.35
PPFM4 53.09 5.84 40.89 0.18 1.30


Furthermore, the high-resolution spectra of C1s shown in Fig. 5 were employed to further investigate the chemical constitution of resultant membranes. As for control membranes (PPM, PFM and PFM0), the pristine membrane PPM presented a symmetric peak with binding energy of 285.8 eV for CH2 and 290.5 eV for CF2, while all modified membranes from PFM to PPFM4 emerged some featured peaks, of which membranes with F127 showed CH peak at 284.6 eV and CO peak at 286.2 eV, and membranes contained GO exhibited unique C[double bond, length as m-dash]O peak at 288.5 eV for carboxyl and carbonyl groups in GO layers. By comparison, the increase of Ag content corresponding to the in situ reduction of Ag+ with the increase of silver nitrate in different code membrane systems and the augment of O attributed to the introduce of GO and F127.


image file: c6ra20513e-f5.tif
Fig. 5 High-resolution XPS spectra of C1s for fabricated membranes.

3.2. Dynamic contact angle of the prepared membranes

Generally, membrane surface relative hydrophilicity was evaluated by a contact angle measurement. The dynamic contact angles of different membranes within 80 s are shown in Fig. 6. On the whole, time dependence values of water contact angle for membranes PPM and PFM had little change, initial water contact angles of modified membranes reduced significantly with the increase of test time from PPFM0 to PPFM4 and the contact angle values of different code membranes presented a regular decrease from 73° to 61°, but the change trend of the dynamic contact angles for PPFM4 turned to gradual within last 40 seconds even surpassed PPFM2 values. These are consistent with an explanation that the synergy of graphene oxide–silver nanocomposite and Pluronic F127 availed to enlarge the specific surface energy and enhance membrane surface wettability within a certain content of GO and silver nitrate, once exceeding the content, the surface moisture capacity would be dropped. Furthermore, the hydrophilic GO layer and amphiphilic F127 could contribute to the increasing hydrophilicity of surface and internal pores of membranes with the GO and silver nitrate increase, while the partial reduction of GO or the conglomeration of Ag nanoparticles could weaken the wettability of membrane surface. Compared comprehensively, PPFM3 membrane possessed better hydrophilicity with the contact angle varying from 61° to 7° within 80 s.
image file: c6ra20513e-f6.tif
Fig. 6 Time dependence of water contact angle on the prepared membrane surfaces.

3.3. Thermal behaviors of membranes

The thermal property of the selected membranes with different functional additive content can be investigated using TG/DTA instrument shown in Fig. 7. The thermo-gravimetric (TG) curves indicated the fact that modified membranes (PPFM1 and PPFM3) are thermally stable and give no obvious mass loss (<2%) at 100 °C, which can be attributed to evaporation loss of the less small amounts of adsorbed water in the tested membranes. When mass loss reached to 5% at 249 °C for membrane PPFM1 (at 270 °C for membrane PPFM3), its TG curve began to present an obvious downward trend that may be caused by the intramolecular dehydration. Another weight loss stage occurs in the range of 250–400 °C corresponding to the pyrolysis of the oxygen functionalities, chain segment degradation or carbon skeleton decomposition of GO and F127. In addition, the main weight loss ratio of PPFM1 and PPFM3 increase dramatically in the region 400–600 °C up to 50% at 470 °C and 486 °C, respectively, which may be caused by the degradation of the PVDF membrane substrate. Moreover, the difference in mass loss between PPFM1 and PPFM3 exists a narrow gap in this temperature range, which is attributed to graphene oxide–silver nanocomposite distributed in the prepared membranes in good agreement with the initial feed ratio of Ag ions in casting solution.
image file: c6ra20513e-f7.tif
Fig. 7 TGA curves and DTA curves of selected membranes.

DTA curves of the selected membranes displayed two characteristic “dual endothermic peak” in high-temperature region and low-temperature region, which mainly derived from the melting–recrystallization–decomposition process of some semi-crystalline polymers according to the considerable literature discussions.53 Obviously, the weak peak appears in the 150–200 °C, which can be attributed to the melting endotherm of semi-crystalline polymers F127 and PVDF, the weaker exothermic peak at ∼450 °C was ascribed to the oxidation of the polymer PVDF, and the strong exothermic peak grows in 480–560 °C concerning the carbonization and decomposition of polymers in resultant membranes.

3.4. Porosity, mean pore size and membrane morphology

The results for membrane pore parameters analysis are listed in Table 4 and Fig. 8. The porosity and mean pore size of the prepared membranes possessed better values using PVP and F127 as blending additives and the values augmented with the increase of GO and silver nitrate, which imputed the fact that water-soluble PVP as a pore-forming agent and amphiphilic additive F127 as an affinity modifier uniformized pore distribution in membrane formation process. Obviously, Fig. 8 revealed the cross-sectional morphology transformation of fabricated membranes with different feed ratio of GO and silver nitrate were accord with the results that the finger-like macro-void sizes of membrane section tended to be diminished and the sponge-like voids emerged into the thickened pore wall gradually. It could result from the diffusion rate between non-solvent and solvent decelerated by the coefficient of graphene oxide–silver nanocomposite and F127. In addition, top surface morphology of prepared membranes from PPFM0 to PPFM4 can be observed in Fig. 8, in which each membrane presented a uniform top surface with different roughness except membrane PPFM4 of which visible clusters of Ag aggregation may be responsible for the decrease of membrane hydrophilicity, permeability and antimicrobial activity.27,34,35
image file: c6ra20513e-f8.tif
Fig. 8 SEM images of top surface and cross-sectional morphology for the modified membranes.

The surface roughnesses of fabricated membranes were examined by AFM shown in Fig. 9 and Table 3. Theoretically, bigger roughness offered better wettability to hydrophilic material. The visual topographical results that membrane surface became rougher with the alternation of additives variety and content (from PPM to PPFM2) can be attributed to the facts: one is that hydrophilic PEO segment of amphiphilic F127 tended to segregate from membrane matrix to surface during phase separation,18,43 which also can be accelerated by the water-soluble process of PVP; another is that the in situ formation of graphene oxide–silver nanocomposite favored of growing into spherical bosses or nodules32,38 beneficial to the high specific surface area of membranes. That the rougher surface offers larger inter-facial tension to the hydrophilic surface made it easier to be wetted for better wettability. While the decrescent surface roughness of membrane PPFM3 and PPFM4 compared to membrane PPFM2 may be ascribed to the accumulated layers of GO increasing the PVDF diffusion resistance.


image file: c6ra20513e-f9.tif
Fig. 9 Surface AFM images modified membranes.
Table 3 Roughness values of prepared membranes
Membrane code Ra (nm) Rms (nm)
PPM 10.3 13.2
PFM 22.4 28.2
PPFM0 32.5 43.6
PPFM1 41.6 56.0
PPFM2 44.4 59.0
PPFM3 43.7 57.2
PPFM4 40.1 45.5


3.5. Membrane filtration assessment

The time-dependent water fluxes in Fig. 10 during the filtration process are important parameters for evaluating membrane performance, while the flux decline can examine anti-fouling properties of membranes. Briefly, water fluxes from PPM to PPFM4 decreased slowly during first 1.5 h, and then the BSA solution flux remained constant during the following 2 h, after water cleaned for 0.5 h the fluxes could restore to higher 98% of the original fluxes within the last 1 h. In addition, the protein solution flux curves of resultant membranes during the testing time of 1 h tended to stable flux values and the flux values of membrane from PPM to PPFM3 increased distinctively, but there is little difference of the stable flux values between membrane PPFM3 and PPFM4. The plausible explanations are that the absorption and desorption of BSA contribute a lot to the membrane flux decline in the whole filtration process as well as that the formation of compact pore morphology arising from the aggregation of the graphene oxide–silver nanocomposite54,55 can't lead to the steady accumulation of membrane permeability when the feeds GO and AgNO3 increased.
image file: c6ra20513e-f10.tif
Fig. 10 Time-dependent fluxes of the prepared membranes during ultra-filtration process including four steps: pure water flux measurement, BSA solution ultra-filtration, water washing, and pure water flux measurement of the cleaned membranes. Ultra-filtration was carried out at 25 °C. The BSA concentration is 1.0 mg mL−1 with the pH value of 7.

In order to dissect the membrane flux attenuation thoroughly, pure water permeability (Jw), protein rejection ratio (R), flux recovery ratio (FRR) and the fouling-resistant ability (Rt) were employed to profoundly investigate the disciplinary filtration process listed as Table 4. The pure water permeability of to PPFM4 (298 L m−2 h−1), while the flux recovery ratios of selected membranes consisted of graphene oxide–silver nanocomposite reached to above 98%. Moreover, the BSA rejection ratio and the fouling-resistant ability as the anti-fouling factors presented a similar regularity that the values remained increase from PPM to PPFM3, to contrary the PPFM4 membrane has a decline resulted from the aggregation of graphene oxide–silver nanocomposite, and membrane PPFM3 was entitled optimal permeability.

Table 4 The characteristic parameters of prepared membranes
Code ε (%) Rm (nm) Jw (L m−2 h−1) R (%) FRR (%) Rt (%)
PPM 68.6 ± 0.4 1.58 ± 0.03 13.7 ± 0.6 86.3 ± 0.2 76.9 ± 0.8 51.9 ± 0.8
PFM 68.1 ± 0.0 2.95 ± 0.01 27.1 ± 1.0 89.1 ± 0.5 80.5 ± 1.0 50.3 ± 0.5
PPFM0 81.9 ± 0.6 6.78 ± 0.16 171 ± 0.7 92.6 ± 0.0 93.6 ± 1.2 49.2 ± 0.2
PPFM1 88.4 ± 1.1 7.12 ± 0.04 215 ± 0.0 95.4 ± 0.4 98.7 ± 1.2 35.6 ± 0.6
PPFM2 93.9 ± 0.5 8.12 ± 0.06 252 ± 0.5 97.9 ± 0.0 98.9 ± 0.2 34.8 ± 0.1
PPFM3 83.2 ± 1.0 8.39 ± 0.18 269 ± 0.2 98.2 ± 0.4 98.1 ± 0.1 32.0 ± 0.4
PPFM4 89.3 ± 0.4 6.86 ± 0.09 298 ± 0.7 96.4 ± 0.8 98.4 ± 1.9 40.9 ± 0.8


3.6. Evaluation of antimicrobial activity

The antibacterial activity was assessed with the paper-disk diffusion method, which is widely used for quick antibiotic susceptibility determination. The ability of the modified membranes on the antibacterial performance against E. coli and S. aureus is clearly revealed in the images given in Fig. 11. It's clear that pristine membrane PPFM0 without any graphene oxide–silver nanocomposite did not display significant antibacterial activity against bacteria, by contrast, the membranes blending AgNPs in situ reduced in graphene sheet showed an excellent antibacterial effect reflected by the size of inhibition zones. The disk diffusion test of prepared membranes demonstrated that the inhibition zones against E. coli, S. aureus and mixed bacteria were 3 mm, 2 mm and 2 mm, respectively. As is known to us all, the antibacterial actions of pristine GO against bacterial cells is due to the generation of reactive oxygen species leading to cell death, while AgNPs have the ability to anchor to the bacterial cell wall and cause cell structure change even death. Thus, excellent antibacterial performance of the modified membranes could be achieved by the combined effect of the GO and AgNPs, in which the presence of Ag particles on graphene surface along with the action of oxygen functional groups are responsible to the strong bactericidal activity compared to single GO or AgNPs.
image file: c6ra20513e-f11.tif
Fig. 11 Photographs of inhibitory effects of the modified membranes after 24 h against S. aureus (A1, A2), E. coli (B1, B2) and mixed bacteria of S. aureus and E. coli (C1, C2).

4 Conclusions

This work presented synergy effect of F127 and nanocomposite GO–Ag on membrane pore morphology, permeability performance, anti-fouling and anti-biofouling properties of the GO–Ag/PVDF membranes successfully fabricated by non-solvent induced phase inversion method based on an in situ reduction. By introducing the nanocomposite GO–Ag and amphipathic F127, the porosity, roughness, permeability and thermostability of resultant membranes have been improved. In addition, the increased hydrophilicity endowed membranes with better anti-fouling and prominent antibacterial activity against E. coli and S. aureus implied by the relative size of the inhibition zone. Resultant membrane PPFM3 exhibited improved pure water flux, hydrophilicity and fouling resistance properties comparing membrane without modification and can be applied as a promising antibacterial material in membrane process.

Acknowledgements

The authors are thankful for the financial support received from the National Natural Science Foundation of China (51372153 and 51572176), Shanghai Union Program (LM201249), the Key Technology R&D Program of Shanghai Committee of Science and Technology in China (14231201503), and the Key Technology R&D Program of Jiangsu Committee of Science and Technology in China (BE2013031).

References

  1. M. A. Shannon, P. W. Bohn, M. Elimelech, J. G. Georgiadis, B. J. Marinas and A. M. Mayes, Nature, 2008, 452(7185), 301–310 CrossRef CAS PubMed.
  2. G. D. Kang and Y. M. Cao, J. Membr. Sci., 2014, 463, 145–165 CrossRef CAS.
  3. S. Zhang, L. Wu, F. Deng, D. Zhao, C. Zhang and C. Zhang, RSC Adv., 2016, 6(75), 71287–71294 RSC.
  4. Y. Zhao, P. Zhang, J. Sun, C. Liu, Z. Yi, L. Zhu and Y. Xu, J. Colloid Interface Sci., 2015, 448, 380–388 CrossRef CAS PubMed.
  5. F. Liu, N. A. Hashim, Y. Liu, M. R. M. Abed and K. Li, J. Membr. Sci., 2011, 375, 1–27 CrossRef CAS.
  6. X. Shen, Y. X. Feng, S. Bi, W. Ding and L. Chen, Biofouling, 2013, 29, 331–343 CrossRef CAS PubMed.
  7. X. Z. Zhao and C. J. He, ACS Appl. Mater. Interfaces, 2015, 7, 17947–17953 CAS.
  8. E. Fontananova, M. A. Bahattab, S. A. Aljlil, M. Alowairdy, G. Rinaldi, D. Vuono, J. B. Nagy, E. Drioli and G. Di Profio, RSC Adv., 2015, 5(69), 56219–56231 RSC.
  9. P. Y. Zhang, H. Yang and Z. L. Xu, Ind. Eng. Chem. Res., 2012, 51, 4388 CrossRef CAS.
  10. L. D. Tijing, Y. C. Woo, J. S. Choi, S. Lee, S. H. Kim and H. K. Shon, J. Membr. Sci., 2015, 475, 215–244 CrossRef CAS.
  11. X. Li, Y. Chen, X. Hu, Y. Zhang and L. Hu, J. Membr. Sci., 2014, 471, 118–129 CrossRef CAS.
  12. J. Jiang, L. Zhu, L. Zhu, H. Zhang, B. Zhu and Y. Xu, ACS Appl. Mater. Interfaces, 2013, 5, 12895–12904 CAS.
  13. C. Yang, X. Ding, R. J. Ono, H. Lee, L. Y. Hsu, Y. W. Tong, J. Hedrick and Y. Y. Yang, Adv. Mater., 2014, 26, 7346–7351 CrossRef CAS PubMed.
  14. X. H. Ma, Z. Q. Dong, P. Y. Zhang, Q. F. Zhong and Z. L. Xu, Mater. Lett., 2015, 156, 58–61 CrossRef CAS.
  15. T. Xiao, P. Wang, X. Yang, X. Cai and J. Lu, J. Membr. Sci., 2015, 489, 160–174 CrossRef CAS.
  16. A. M. R. Moghareh, S. C. Kumbharkar, A. M. Groth and K. Li, Sep. Purif. Technol., 2013, 106, 47 CrossRef.
  17. Z. Yi, L. P. Zhu, Y. Y. Xu, X. L. Li, J. Z. Yu and B. K. Zhu, J. Membr. Sci., 2010, 364(1–2), 34–42 CrossRef CAS.
  18. W. Zhao, Y. Su, C. Li, Q. Shi, X. Ning and Z. J. Jiang, J. Membr. Sci., 2008, 318, 405–412 CrossRef CAS.
  19. Y. Q. Wang, T. Wang, Y. L. Su, F. B. Peng, H. Wu and Z. Y. Jiang, Langmuir, 2005, 21(25), 11856–11862 CrossRef CAS PubMed.
  20. Z. Cui, Y. Xu, L. Zhu, J. Wang, Z. Xi and B. J. Zhu, J. Membr. Sci., 2008, 325(2), 957–963 CrossRef CAS.
  21. Y. Zhao, L. Zhu, J. Jiang, Z. Yi, B. Zhu and Y. Xu, Ind. Eng. Chem. Res., 2014, 53, 13952–13962 CrossRef CAS.
  22. Y. Xia, C. Cheng, R. Wang, C. Nie, J. Deng and C. Zhao, J. Mater. Chem. B, 2015, 3(48), 9295–9304 RSC.
  23. B. Kang, Y. D. Li, J. Liang, X. Yan, J. Chen and W. Z. Lang, RSC Adv., 2016, 6(3), 1710–1721 RSC.
  24. S. H. Park, Y. S. Ko, S. J. Park, J. S. Lee, J. Cho, K. Y. Baek, I. T. Kim, K. Woo and J. H. Lee, J. Membr. Sci., 2016, 499, 80–91 CrossRef CAS.
  25. X. Li, M. Wang, C. Wang, C. Cheng and X. F. Wang, ACS Appl. Mater. Interfaces, 2014, 6, 15272–15282 CAS.
  26. W. Chen, Y. Liu, H. S. Courtney, M. Bettenga, C. M. Agrawal, J. D. Bumgardner and J. L. Ong, Biomaterials, 2006, 27, 5512–5517 CrossRef CAS PubMed.
  27. J.-H. Li, X.-S. Shao, Q. Zhou, M.-Z. Li and Q.-Q. Zhang, Appl. Surf. Sci., 2013, 265, 663–670 CrossRef CAS.
  28. H. Liu, G. Zhang, C. Zhao, J. Liu and F. Yang, J. Mater. Chem. A, 2015, 3(40), 20277–20287 CAS.
  29. H. M. Hegab and L. Zou, J. Membr. Sci., 2016, 484, 95–106 CrossRef.
  30. R. Li, L. Liu, Y. Zhang and F. Yang, RSC Adv., 2016, 6(25), 20542–20550 RSC.
  31. M. Kumar, Z. Gholamvand, A. Morrissey, K. Nolan, M. Ulbricht and J. Lawler, J. Membr. Sci., 2016, 506, 38–49 CrossRef CAS.
  32. X. F. Sun, J. Qin, P. F. Xia, B. B. Guo, C. M. Yang, C. Song and S. G. Wang, Chem. Eng. J., 2015, 281, 53–59 CrossRef CAS.
  33. W. Ye, X. Shi, J. Su, Y. Chen, J. Fu, X. Zhao, F. Zhou, C. Wang and D. Xue, Appl. Catal., B, 2014, 160–161, 400–407 CrossRef CAS.
  34. X. Li, R. Pang, J. Li, X. Sun, J. Shen, W. Han and L. Wang, Desalination, 2013, 324, 48–56 CrossRef CAS.
  35. V. Vatanpour, A. Shockravi, H. Zarrabi, Z. Nikjavan and A. Javadi, J. Ind. Eng. Chem., 2015, 30, 342–352 CrossRef CAS.
  36. D. Liu, D. Li, D. Du, X. Zhao, A. Qin, X. Li and C. He, J. Membr. Sci., 2015, 493, 243–251 CrossRef CAS.
  37. J. Lee, H. R. Chae, Y. J. Won, K. Lee, C. H. Lee, H. H. Lee, I. C. Kim and J. M. Lee, J. Membr. Sci., 2013, 448, 223–230 CrossRef CAS.
  38. B. M. Ganesh, A. M. Isloor and A. F. Ismail, Desalination, 2013, 313, 199–207 CrossRef CAS.
  39. Y. Q. Wang, Y. L. Su, Q. Sun, X. L. Ma, X. C. Ma and Z. Y. Jiang, J. Membr. Sci., 2006, 282, 44–51 CrossRef CAS.
  40. C. H. Du, C. J. Wu and L. G. Wu, J. Appl. Polym. Sci., 2012, 124(S1), E330–E337 CrossRef CAS.
  41. C. Zhao, X. Xu, J. Chen and F. Yang, J. Environ. Chem. Eng., 2013, 1(3), 349–354 CrossRef CAS.
  42. Y. Zhang, Y. Su, W. Chen, J. Peng, Y. Dong and Z. Jiang, Ind. Eng. Chem. Res., 2011, 50(8), 4678–4685 CrossRef CAS.
  43. W. Chen, J. Peng, Y. Su, L. Zheng, L. Wang and Z. Jiang, Sep. Purif. Technol., 2009, 66(3), 591–597 CrossRef CAS.
  44. C. Bao, L. Song, W. Xing, B. Yuan, C. A. Wilkie, J. Huang, Y. Guo and Y. J. Hu, Mater. Chem., 2012, 22(13), 6088–6096 RSC.
  45. J. F. Li, Z. L. Xu, H. Yang, L. Y. Yu and M. Liu, Appl. Surf. Sci., 2009, 255, 4725–4732 CrossRef CAS.
  46. A. Moslehyani, A. F. Ismail, M. H. D. Othman and T. Matsuura, RSC Adv., 2015, 5(19), 14147–14155 RSC.
  47. J. Zhang, Z. Xu, W. Mai, C. Min, B. Zhou, M. Shan, Y. Li, C. Yang, Z. Wang and X. Qian, J. Mater. Chem. A, 2013, 1(9), 3101 CAS.
  48. T. Wu, B. Zhou, T. Zhu, J. Shi, Z. Xu, C. Hu and J. Wang, RSC Adv., 2015, 5(11), 7880–7889 RSC.
  49. V. Vatanpour, S. S. Madaeni, A. R. Khataee, E. Salehi, S. Zinadini and H. A. Monfared, Desalination, 2012, 292, 19–29 CrossRef CAS.
  50. J. I. Paredes, S. Villar-Rodil, A. Martínez-Alonso and J. M. D. Tascón, Langmuir, 2008, 24, 10560–10564 CrossRef CAS PubMed.
  51. D. Yang, S. Tornga, B. Orler and C. Welch, J. Membr. Sci., 2012, 409–410, 302–317 CrossRef CAS.
  52. Y. Liu, Y. Su, Y. Li, X. Zhao and Z. Jiang, RSC Adv., 2015, 5(27), 21349–21359 RSC.
  53. M. Zhang, A. Q. Zhang, B. K. Zhang, C. H. Du and Y. Y. Xu, J. Membr. Sci., 2008, 319, 169–175 CrossRef CAS.
  54. Y. Dou, J. Peng, W. Li, M. Li, H. Liu and H. Zhang, J. Nanopart. Res., 2015, 17, 489 CrossRef.
  55. M. Zhang, R. W. Field and K. Zhang, J. Membr. Sci., 2014, 471, 274–284 CrossRef CAS.

Footnote

Electronic supplementary information (ESI) available. See DOI: 10.1039/c6ra20513e

This journal is © The Royal Society of Chemistry 2016