Thermochemical conversion of CO2 into CH4 using oxygen deficient NiFe2O4−δ with unique selectivity

Linyan Liu a, Yao Chenga, Zhifu Liu*a, Minh Ngoc Haac, Qiangsheng Guoab and Zhe Zhao*ad
aSchool of Materials Science and Engineering, Shanghai Institute of Technology, Shanghai 201418, China. E-mail: liuzf@sit.edu.cn
bSchool of Chemical and Environmental Engineering, Shanghai Institute of Technology, Shanghai 201418, China
cKey Laboratory for Advanced Materials, Research Institute of Industrial Catalysis, East China University of Science and Technology, Shanghai 200237, China
dDepartment of Materials Science and Engineering, KTH Royal Institute of Technology, SE 100 44, Stockholm, Sweden. E-mail: zhezhao@kth.se

Received 13th August 2016 , Accepted 29th August 2016

First published on 30th August 2016


Abstract

NiFe2O4 nanoparticles with a high concentration of oxygen vacancies were synthesized via a solvothermal route. The morphology and oxygen vacancies of the catalyst was changed by adjusting the ratio of ethylene glycol (EG) in the mixture solvent. Water was used as a hydrogen source, the thermal catalytic performance of NiFe2O4 was up to 357.6 μmol g−1 of CH4 evolution under low temperature conditions. These findings may further broaden the horizon for CO2 reduction using the oxygen nonstoichiometry strategy.

The recycling utilization of CO2 for hydrocarbon fuel generation has provided an alternative possibility for sustainable and clean energy development.1–3 During the past ten years, many research studies have been done for solving the problem of capturing and converting H2O and CO2 into solar fuels.4–8 For example, Jinhua Ye et al. have studied on doped semiconductors with ordered mesoporous structure for photocatalytic reactions to open a new strategic approach to develop visible light active photocatalysts for selectively catalyzing CO2 reduction.7 Aldo Steinfeld et al. have researched combined the oxygen uptake and release capacity of cerium oxide and facile catalysis at elevated temperatures to thermochemically dissociate CO2 and H2O, yielding CO and H2 by using a solar cavity-receiver reactor.8

Generally speaking, the photo-reduction of CO2 by using inorganic semiconductors as catalysts is more or less a process that mimics the natural photosynthesis. However, the efficiency of the artificial photosynthesis is usually much lower than the natural one, which is mainly due to the harsh redox reaction conditions needed to meet the adequacy of protons and electrons synchronously.9–12 One efficient way is solar driven thermochemical conversion, which are originated from the thermo-decomposition of CO2 and H2O,13–16 prove to be most solar-to-fuel efficient because of the use of the entire solar spectrum (especially by infrared light). This way is based on metal oxide redox reactions relies on the oxygen uptake and release ability of the redox materials. However, in the majority of the published investigations the splitting of CO2 and H2O is used to obtain CO and H2 as fuel.17 Further research into hydrocarbon fuels on thermal reactions with unique selectivity and high efficiency is still required. The challenges have provided a major driving force to search for alternative catalysts with highly uptake and release ability uptake and release ability, which means to create higher concentration of oxygen vacancy within lattices.

Ferrite materials with low cost materials, simple preparation process, have attracted much attention in CO2 reduction. For example, oxygen-deficient NiFe2O4 has been proved easily reduced CO2 into carbon with H2 ambience. In our earlier work, we have developed Cu–Zn–Al LDHs catalyst showing enhancing photocatalytic activity under 200 °C reactions,18 and we suppose that the carbon conversion process is essentially controlled by temperature. In this case, it has been of great interest to establish a catalyst with oxygen vacancies and have a relatively low operation temperature (<350 °C) for hydrocarbon fuels. Herein, we designed a simple solvothermal route to synthesize the NiFe2O4−δ with oxygen vacancies which need not be reduced by hydrogen under high temperature circumstances. The morphology and oxygen vacancies of the catalyst was changed by adjusting the ratio of ethylene glycol (EG) in the mixture solvent. And we demonstrate the simultaneous thermochemical reaction of CO2 and H2O with oxygen deficient NiFe2O4−δ at relative low temperature to realize the high efficient CO2 conversion into fuels.19,20

There are numerous studies showed that the oxygen vacancies played a key role in the catalytic reaction.21–23 Furthermore, the formation of oxygen vacancies were closely related to the solvent.24–30 Herein, typically, synthesis of NiFe2O4 nanoparticles was carried out via a simple solvothermal method. NiCl2·6H2O (0.002 mol) and Fe(NO3)3·9H2O (0.004 mol) were dissolved in solvent (60 ml) (0, 30%, 50%, 70%, 100% EG/solvent systems, respectively.) with vigorous stirring. When the solution became transparent, NaOH (0.04 mol) was added. Then the whole mixture was transferred into an 80 mL Teflon-lined stainless-steel autoclave and heated to 200 °C maintaining for 10 h in a muffle furnace, then the system was cooled to room temperature naturally. The black precipitate product was collected by centrifuging and washed with deionized water and ethanol for several times and finally dried in a vacuum oven at 60 °C for 5 h. The obtained samples were denoted as NFO-1 (0), NFO-2 (30%), NFO-3 (50%), NFO-4 (70%) and NFO-5 (100%), respectively.

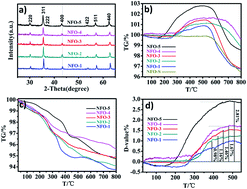
To investigate the effects of EG on the growth mechanism of NiFe2O4, the crystalline structure and the morphology of nanoparticles were characterised by XRD and TGA, respectively, as shown in Fig. 1. In Fig. 1a the XRD pattern of NiFe2O4 with main peak indexed to the (3 1 1) crystal face shifted to lower angle when increasing the content of EG in solvents, it means lattice parameter of NiFe2O4 increase and diffraction peaks move to the low angle side. Furthermore, the diffraction peaks shifted to lower angle when increasing the content of EG in solvents, indicating that crystal structure affected by the content of EG in solvents. The results of Rietveld structure refinement for the NiFe2O4 are summarized in Table 1. It was shown the crystallite size of the NiFe2O4 decrease when increasing the content of EG in solvents. It was affected the surface electronic structure, electrical transport properties of the catalysts. Fig. 1b obviously showed that the TGA curves display a weight gain in 200–500 °C in air and the curve did not increasing during the same temperature range in N2 ambience as control experiment in Fig. 1c, which indicated that the oxygen vacancies existed in these samples. In high temperature, the oxygen vacancies are ready to be refilled with oxygen from the air, causing a weight gain of samples.31 And the oxygen vacancies of catalysts were activated completely at 350 °C. TGA differential spectra of NFO samples with standard NFO-S are shown in Fig. 1d. A positive D-value has been displayed, corresponding to the weight gain in TGA curves of NFO samples. The D-value directly related to the refilled oxygen amount, which means the oxygen vacancies concentration. The D-value of NFO-1, NFO-2, NFO-3, NFO-4 and NFO-5 with standard NFO-S are 0.98%, 1.16%, 1.46%, 1.67% and 2.81%, respectively, corresponding to the oxygen vacancies concentration in NFO-1, NFO-2, NFO-3, NFO-4 and NFO-5 are 3.55%, 4.19%, 5.26%, 6.01%, and 10.01% (atom), respectively.31,32 It was shown from the measurement that there were the most oxygen vacancies in the NFO-5.


image file: c6ra20473b-f1.tif
Fig. 1 Characterization of five samples on XRD pattern (a), TGA (thermogravimetric analysis) in air (b), TGA in N2 (c), the TGA differential spectra of NFO samples with standard NFO-S (d), * NFO-S was standard NiFe2O4 without oxygen vacancies.
Table 1 The results of Rietveld structure refinement and specific surface area for the NiFe2O4 at different the content of EG in solvents
Catalyst SBET (m2 g−1) 2-Theta (degree) d311 (nm) a0a (nm) Crystallite size (nm)
a Rietveld structure refinement for NiFe2O4 (PDF #01-086-2267): cubic, Fd[3 with combining macron]m.
NFO-1 24.31 35.699 0.25152 0.8347 71.322
NFO-2 25.18 35.560 0.25247 0.8377 67.085
NFO-3 23.12 35.556 0.25250 0.8385 60.621
NFO-4 22.89 35.553 0.25252 0.8396 56.069
NFO-5 22.03 35.324 0.25389 0.8422 53.059
NFO-6 23.19 35.476 0.25304 0.8387 50.972
NFO-7 22.82 35.629 0.25199 0.8351 57.494


The data above demonstrated clearly that the concentration of oxygen vacancies was proportional to the concentration of ethylene glycol as the modifier and reducer which plays a critical role in the morphology and phase control of NiFe2O4 nanostructures during the hydrothermal process. When the temperature increased to a certain extent, the Fe(OH)3 and Ni(OH)2 transformed into NiFe2O4 nanostructure through a dehydration reaction30,34 (eqn (1)). However, as far as we know, the crystal growth habit is not only determined by internal structure but also affected by external conditions. When a certain quantity of EG was introduced into the hydrothermal process, the H-bonds of EG can attack the OH bonds of Fe(OH)3 under a certain range of alkaline conditions.34 Consequently, a part of the Fe(OH)3 was activated and the dehydrated reaction to obtain Fe(OH)2 with the Fe changed electrovalence33–35 (eqn (2)). Then the Fe(OH)3/Fe(OH)2 and 3Ni(OH)2 transformed into NiFe2O4−δ nanostructure through a dehydration reaction(eqn (3)) and then produced the oxygen vacancy. When the quantity of EG increased, more Fe(OH)3 were attacked by the H-bonds of EG and to form Fe(OH)2, and more oxygen vacancy was formed.30,33–35

 
2Fe(OH)3 + Ni(OH)2 → NiFe2O4 + 4H2O. (1)
 
Fe(OH)3 + H–OC2H4OH → Fe(OH)2 + H2O + OC2H4OH. (2)
 
(2 − δ)Fe(OH)3/δFe(OH)2 + Ni(OH)2 → NiFe2O4−δ + 4H2O. (3)

The morphology as shown in Fig. 2 also changed from octahedron to sphere when the amount of EG increased. The formation of the NiFe2O4 nanostructures with no EG introduced into the hydrothermal process was determined by the internal crystallographic structure.33–35 And the octahedrons during the hydrothermal process proceeds have much faster growth rate along 〈100〉 over that along 〈111〉 due to the lowest energy of the {111} surfaces.36 The spherelike products appeared as final structures in the system containing 100 vol% EG, which suggests that the concentration of surfactant EG was high enough to adsorb onto the crystal faces in all directions to lead to an isotropic growth.30


image file: c6ra20473b-f2.tif
Fig. 2 Seeded growth synthesis approaches can be used to prepare different NFO samples prepared in (a) 0%, (b) 30%, (c) 50%, (d) 70% and (e) 100% EG/solvent systems.

To study the catalytic mechanism, the sample (NFO-5) with the highest concentration oxygen vacancies was tested to research its thermocatalytic performance. The test conditions and procedures were shown in relevant ESI [S1]. The NFO-5 catalyst was tested for its thermocatalytic performance of once and twice, respectively. In these experiments, two new samples were obtained by recovered had been tested samples and were named as NFO-6 and NFO-7, respectively.

The phase of as-prepared products was characterized by X-ray powder diffraction (XRD). In Fig. 3a the patterns of NiFe2O4 obtained by a solvothermal method showed an orthorhombic (PDF #01-086-2267) phases. These peaks could be accurately indexed as the (220), (311), (222), (400), (422), (511) and (440) planes of the orthorhombic NiFe2O4, which indicated that the NFO-6 and NFO-7 still kept crystal type of NFO-5 and didn't bring impurities into the NiFe2O4 nanospheres. The phase structure of the samples was all attributed to the face centered cubic NiFe2O4 phase, which showed that the structure of the catalyst had not been changed after the catalytic reaction. The peak intensity and the half height width of all samples had no difference, which indicated that the catalytic reaction had not altered crystallinity and crystal size of the catalyst. Compared with the standard diffraction peak of NiFe2O4, the diffraction peaks of all the samples shifted to left apparently, this indicated that the structure of the synthesized nanospheres became looser. Among them, the diffraction peak of the NFO-5 sample shifted to left most obviously. The lattice constant (a0) were calculated and shown in the Table 1. It could be clearly seen that the lattice constant of all samples were expanded, which indicated the catalysts existed more oxygen vacancies37 and more free space. That is to say, the oxygen vacancies concentration of the NFO-5 sample was the highest and the NFO-7 sample was the lowest. It may be inferred that the concentration of oxygen vacancy was constantly getting smaller during the catalytic reaction process.


image file: c6ra20473b-f3.tif
Fig. 3 Characterization of three samples on XRD pattern (a), TGA (thermogravimetric analysis) (b), N2 adsorption–desorption isotherms (c) and CH4 generation over the NFO-5, NFO-6, NFO-1 under heating (d) and pore-size distribution curve obtained from the BJH method (inset). For a better visibility, the N2 physisorption isotherms are shifted along the Y-axis with 0, 10, 20.

In order to studies the relationship between oxygen vacancies and catalysis in the NiFe2O4 nanoparticles, the TGA of the as-prepared products were characterized by a thermal gravimetric analyser (TG). Fig. 3b obviously showed that the TGA curves display a weight gain in 200–500 °C. The oxygen vacancies concentration in NFO-5, NFO-6 and NFO-7 are 3.66%, 5.44%, and 10.01% (atom), respectively, by the D-value as shown in ESI [S2]. The TGA curve was in response to the result of XRD. The discussion above has verified the oxygen vacancies concentration was constantly getting smaller with the catalytic reaction in process.

In order to preclude other factors on the catalytic reaction effect, the specific surface area of the as-prepared products were characterized by a Brunauer–Emmett–Teller (BET) as shown in Fig. 3c. Table 1 showed the BET surface area of three samples of NiFe2O4. There's no obvious difference among them, which indicated the catalytic reaction did not change the specific surface area of the catalyst. As a result, for these samples, the specific surface area was not the fundamental factor to affect the catalytic performance and the samples were stable.

A Bruker-AXS 133 eV XFlash 4010 Detector attached to the SEM is used to measure the element composition and distribution of the NFO-5, NFO-6 and NFO-7. From the EDS spectrum and the elements mapping images in Fig. 4, they are clear to see that these elements O, Fe and Ni dominates the composition of the NiFe2O4−δ. Those mapping images are solid proofs that these O, Fe and Ni are uniformly distributed in the NiFe2O4−δ.


image file: c6ra20473b-f4.tif
Fig. 4 EDS images of the NFO-5, NFO-6 and NFO-7.

To get more detail information on the NiFe2O4−δ, TEM images are presented in Fig. 5. From the TEM images of Fig. 5a–c it could be seen that the small nanospheres with an average size of 15–20 nm were clustered together. The morphology of samples had no significant change. Moreover, the Fig. 5d–f TEM images also shown clear lattice spacing of samples. The interplanar spacing of (3 1 1) of the samples were 0.254 nm, 0.253 nm and 0.252 nm, respectively, corresponding to the (3 1 1) lattice spacing of the cubic phase of crystal structure and it is the same with XRD Rietveld structure refinement for NiFe2O4−δ results.


image file: c6ra20473b-f5.tif
Fig. 5 TEM images of the NFO-5, NFO-6 and NFO-7.

The XPS was performed in order to study the chemical state and surface composition of NiFe2O4−δ as shown in Fig. 6. The survey XPS spectra shown in Fig. 6a indicates that all of the peaks on the curves are ascribed to Ni, Fe, O and C elements and no peaks of other elements are observed. The presence of C comes mainly from carbon tape used for XPS measurement. Fig. 6b and c display the high-resolution spectrum for Ni, and Fe species, respectively. According to Fig. 6b, no Ni0 at 852–853 eV and the binding energies 854.1 eV, 855.6 eV and 861.2 eV, 863.9 eV attributed to main peak Ni 2p3/2 and satellite peak Ni 2p3/2, respectively, which are very close to previously reported values.38 In Fig. 6c, the Fe 2p orbital is clearly resolved into Fe 2p3/2 and Fe 2p1/2 contributions, centered upon 710.1 eV, 713.7 eV and 722.9 eV, 725.8 eV, respectively. And the binding energies 710.1 eV and 713.7 eV correspond to the characteristic peak of Fe2+ and Fe3+, respectively. The apparent weak of the shake up feature in high-resolution spectrum for Fe as shown in Fig. 6c suggests that all Fe atoms are in the structure of NiFe2O4−δ.


image file: c6ra20473b-f6.tif
Fig. 6 The XPS spectra of (a) survey, (b) Ni 2p (c) Fe 2p and (d) O 1s of the NFO-5, NFO-6 and NFO-7.

Moreover, we investigated the presence of oxygen vacancies by the XPS spectra. The high-resolution O 1s XPS spectra of NFO-5, NFO-6 and NFO-7 samples were presented in Fig. 6d, respectively. These profiles are asymmetric and can be fitted to three Gaussian features, which indicating three different kinds of O species in the samples. They can be attributed to the lattice oxygen, surface oxygen (caused by the surface chemisorbed species such as hydroxyl and H2O) and absorbed oxygen, respectively.39 It has been previously reported that the surface oxygen component develops with the increase of oxygen vacancies,40,41 which can lead to the asymmetry of the main peak. The high-resolution O 1s XPS spectra indicate that the peak area of surface oxygen were obviously smaller with the increasing of catalytic reaction times as compared to the NFO-5. Moreover, the relative concentrations of surface and lattice oxygen are reported in Table 2 and the calculated ratios of the surface oxygen to the lattice oxygen are 0.93, 0.42 and 0.28 for the NFO-5, NFO-6 and NFO-7 samples, respectively, which strongly suggests the presence of oxygen deficiencies in the samples and the oxygen vacancies of samples were dropping with the increasing of catalytic reaction times.

Table 2 The relative concentrations of surface and lattice oxygen
Catalyst Lattice oxygen (529.3 eV)% Surface oxygen (530.9 eV)% Surface/lattice
NFO-5 51.68 48.32 0.93
NFO-6 70.45 29.55 0.42
NFO-7 78.05 21.95 0.28


Fig. 3d showed the catalytic efficiency of three samples of NiFe2O4 nanoparticles. The thermal catalytic performance of NFO-5 was up to 357.6 μmol g−1 of CH4 evolution in 5 hours. The selectivity of the thermal catalysis was over 99.9% [S3], which due to the intermediate product is single (C and H) in the two-step processes. It is clearly shown that the yield of the sample NFO-5 was higher than NFO-6, which indicated that the decrease of oxygen vacancies in the catalyst lead to the decrease of catalytic yield in the convert CO2 into CH4 process. The NFO-5 sample reached the maximum productivity at 2 hours, but the NFO-6 sample reached the maximum productivity at 3 hours, which indicated the higher the oxygen vacancy concentration, the higher the reaction velocity in the catalytic reaction for CH4 evolution.

The system itself could be considered as a hydrogen source [S4] (eqn (4)), which could be considered as a method to synthesize CH4 with no external hydrogen added. It is confirmed by the water-splitting tests that NiFe2O4 with oxygen vacancies could transform H2O into element H under 350 °C. The combination of the two splitting reactions is a new method to synthesize methane of high selectivity and high yield. High selectivity was due to the splitting of CO2 more tend to form C (eqn (5)) as intermediate product of CH4 under low temperature (<500 °C) circumstances.11 That is to say, the intermediate product is single. The yield of CH4 is high due to the thermal power as the effectively compared with light as well as splitting of H2O to obtain H which was more active than H2. The simultaneous thermochemical reaction of CO2 and H2O with the oxygen deficient in nickel ferrite at a relative low temperature can convert CO2 into CH4 efficiently. It is also solving the problem of catalytic carbon deposition that catalyst surface might be covered by a carbon layer in the catalytic reaction process. The generated carbon from the splitting of CO2 will react with the element H to convert into CH4 (eqn (6)). Thus, CO2 can be converted to CH4 through the two reaction steps by oxygen vacancies.

 
MxFe3−xO4−δ + (δδ′)H2O → MxFe3−xO4−δ + 2(δδ′)H. (4)
 
MFe2O4−δ + (δδ′)/2CO2 → MFe2O4−δ + (δδ′)/2C(δ > δ′) (5)
 
C + 4H → CH4. (6)

In summary, under the condition of EG as solvent, we can synthesize the NiFe2O4−δ with oxygen vacancies by hydrothermal method, which eliminating the complex and complicated traditional process to reduce oxygen vacancies, and simultaneously saving the consumption of H2. We have demonstrated the simultaneous thermochemical reaction of CO2 and H2O with oxygen vacancies NiFe2O4−δ at a relative low temperature to achieve a high efficient of CO2 converting into CH4. The exploration of these samples with oxygen vacancies confirmed that transformation of CO2 to CH4 was achieved by active oxygen vacancies. The repeatability of the catalyst decreased because of the decrease of the oxygen vacancies concentration. We find that increasing the concentration of oxygen vacancies is helpful to improve the reaction velocity as well as to raise the catalytic yield. That is to say, oxygen vacancy is an important factor to improve the catalytic activity for NiFe2O4. The higher the concentration of oxygen vacancies in NiFe2O4−δ, the higher the efficiency of splitting H2O and CO2, and the higher the yield to transform CO2 into CH4. The combination of CO2 and H2O, which not only saves the consumption of external hydrogen source, but also the problem of carbon deposition was solved. Effective control of oxygen vacancies is expected to bring up new opportunities for design, tuning, and control of chemical activity, specificity, and selectivity. The work may present a guiding significance in the aspect about oxygen vacancies in oxide catalytic reaction. Besides, the UV-Vis, as shown in ESI [S2], shown the high concentration of oxygen vacancies in the NFO samples lead to the enhancement of visible light absorption capability. Hence, the NiFe2O4 with oxygen vacancies may be promising to study as a photothermal catalyst.

Acknowledgements

We gratefully acknowledge the financial support by the program for young scientists (YangFan Program, 14YF1410800) at Science and Technology Commission of Shanghai Municipality, young teachers training scheme of Shanghai Municipal Education Commission (ZZyy15085, ZZyy15086), the program of introducing talents of Shanghai Institute of Technology (YJ2014-42) and the special fund to support the development of local colleges of Ministry of Finance of China.

Notes and references

  1. S. Navalon, A. Dhakshinamoorthy, M. Alvaro and H. Garcia, ChemSusChem, 2013, 6, 562–577 CrossRef CAS PubMed.
  2. T. Osaki, H. Masuda and T. Mori, Catal. Lett., 1994, 29, 33–37 CrossRef CAS.
  3. S. Royer, D. Duprez, F. Can, X. Courtois, C. Batiot-Dupeyrat, S. Laassiri and H. Alamdari, Chem. Rev., 2014, 114, 10292–10368 CrossRef CAS PubMed.
  4. C. H. Du, Y. Guo, Y. L. Guo, X. Q. Gong and G. Z. Lu, J. Mater. Chem. A, 2015, 3, 23230 CAS.
  5. W. Tu, Y. Zhou and Z. Zou, Adv. Mater., 2014, 26, 4607–4626 CrossRef CAS PubMed.
  6. K. K. Sakimoto, A. B. Wong and P. D. Yang, Science, 2016, 351, 74–77 CrossRef CAS PubMed.
  7. T. Wang, X. G. Meng, G. Liu, K. Chang, P. Li, Q. Kang, L. Liu, M. Li, S. X. Ouyang and J. H. Ye, J. Mater. Chem. A, 2015, 3, 9491–9501 CAS.
  8. W. C. Chueh, C. Falter and A. Steinfeld, Science, 2010, 330, 1797–1800 CrossRef CAS PubMed.
  9. S. N. Habisreutinger, L. Schmidt-Mende and J. K. Stolarczyk, Angew. Chem., Int. Ed., 2013, 52, 7372–7408 CrossRef CAS PubMed.
  10. Ş. Neaţu, J. A. Maciá-Agulló and H. Garcia, Int. J. Mol. Sci., 2014, 15, 1422–0067 Search PubMed.
  11. G. Sahara and O. Ishitani, Inorg. Chem., 2014, 54, 5096–5104 CrossRef PubMed.
  12. W. Wang, M. O. Tade and Z. P. Shao, Chem. Soc. Rev., 2015, 44, 5371 RSC.
  13. N. Gokon, H. Murayama, A. Nagasaki and T. Kodama, Sol. Energy, 2009, 83, 527–537 CrossRef CAS.
  14. N. Gokon, S. Takahashi, H. Yamamoto and T. Kodama, Int. J. Hydrogen Energy, 2008, 33, 2189–2199 CrossRef CAS.
  15. N. Gokon, T. Hasegawa, S. Takahash and T. Kodama, Energy, 2008, 33, 1407–1416 CrossRef CAS.
  16. X. G. Meng, T. Wang, L. G. Liu, S. X. Ouyang, P. Li, H. L. Hu, T. Kako, H. Iwai, A. Tanaka and J. H. Ye, Angew. Chem., Int. Ed., 2014, 53, 11478–11482 CrossRef CAS PubMed.
  17. H. Kaneko, N. Gokon, N. Hasegawa and Y. Tamaura, Energy, 2005, 30, 2171–2178 CrossRef CAS.
  18. Q. S. Guo, Q. H. Zhang, H. Z. Wang, Z. F. Liu and Z. Zhao, Catal. Commun., 2016, 77, 118–122 CrossRef CAS.
  19. G. Rekhila, Y. Bessekhouad and M. Trari, Int. J. Hydrogen Energy, 2013, 38, 6335–6343 CrossRef CAS.
  20. O. K. Varghese, M. Paulose, T. J. LaTempa and C. A. Grimes, Nano Lett., 2009, 9, 2 CrossRef PubMed.
  21. X. Y. Pan, M. Q. Yang, X. Z. Fu, N. Zhang and Y. J. Xu, Nanoscale, 2013, 5, 3601–3614 RSC.
  22. G. R. Li, T. Hu, G. L. Pan, T. Y. Yan, X. P. Gao and H. Y. Zhu, J. Phys. Chem. C, 2008, 112, 11859–11864 CAS.
  23. C. T. Campbell and C. H. F. Peden, Science, 2005, 309, 713–714 CrossRef CAS PubMed.
  24. H. C. Shin and S. C. Choi, Chem. Mater., 2001, 13, 1238–1242 CrossRef CAS.
  25. C. Feldmann, Adv. Funct. Mater., 2003, 13, 102–107 Search PubMed.
  26. Y. G. Sun and Y. N. Xia, Adv. Mater., 2003, 15, 695–699 CrossRef CAS.
  27. D. Hayes, D. Meisel and O. I. Micic, Colloids Surf., 1991, 55, 121–136 CrossRef CAS.
  28. Y. L. Wang, X. C. Jiang and Y. N. Xia, J. Am. Chem. Soc., 2003, 125, 16176–16177 CrossRef CAS PubMed.
  29. L. H. Jiang, G. Q. Sun, Z. H. Zhou, S. G. Sun, Q. Wang, S. Y. Yan, H. Q. Li, J. Tian, J. S. Guo, B. Zhou and Q. Xin, J. Phys. Chem. B, 2005, 109, 8774–8778 CrossRef CAS PubMed.
  30. T. Herricks, J. Y. Chen and Y. N. Xia, Nano Lett., 2004, 4, 2367–2371 CrossRef CAS.
  31. H. Q. Tan, Z. Zhao and Z. C. Sun, ACS Appl. Mater. Interfaces, 2014, 6, 19184–19190 CAS.
  32. Z. Wang, W. Wang, L. Zhang and D. Jiang, Catal. Sci. Technol., 2015, 6, 3845–3853 Search PubMed.
  33. J. Geng, Y. N. Lv, D. J. Lu and J. J. Zhu, Nanotechnology, 2006, 17, 2614–2620 CrossRef CAS PubMed.
  34. J. Yang, C. X. Li, Z. W. Quan, C. M. Zhang, P. P. Yang, Y. Y. Li, C. C. Yu and J. Lin, J. Phys. Chem. C, 2008, 112, 12777–12785 CAS.
  35. S. Z. Li, H. Zhang, Y. J. Ji and D. R. Yang, Nanotechnology, 2004, 15, 1428–1432 CrossRef CAS.
  36. Y. Cheng, Y. H. Zheng, Y. S. Wang, F. Bao and Y. Qin, J. Solid State Chem., 2005, 178, 2394–2397 CrossRef CAS.
  37. L. Chen, P. Fleming, V. Morris, J. D. Holmes and M. A. Morris, J. Phys. Chem. C, 2010, 114, 12909–12919 CAS.
  38. Y. Yang, Q. Tao, G. Srinivasan and C. G. Takoudis, ECS J. Solid State Sci. Technol., 2014, 3, 345–352 CrossRef.
  39. F. Puleo, L. F. Liotta, V. L. Parola, D. Banerjee, A. Martorana and A. Longo, Phys. Chem. Chem. Phys., 2014, 16, 22677–22686 RSC.
  40. Z. J Zhang, W. Z. Wang, E. P. Gao, M. Shang and J. H. Xu, J. Hazard. Mater., 2011, 196, 255–262 CrossRef PubMed.
  41. W. Kim, M. Choi and K. Yong, Sens. Actuators, A, 2015, 209, 989–996 CrossRef CAS.

Footnotes

Electronic supplementary information (ESI) available: Experimental details and measurements. See DOI: 10.1039/c6ra20473b
These authors contributed equally to this work and should be considered co-first authors.

This journal is © The Royal Society of Chemistry 2016