
3D scaffold induces efficient bone repair: in vivo studies of ultra-structural architecture at the interface
Nitin Sagar†
a,
Atul Kumar Singh†b,
Mayur K. Temgirec,
S. Vijayalakshmib,
Alok Dhawand,
Ashutosh Kumara,
Naibedya Chattopadhyay e and
Jayesh R. Bellare*abcf
e and
Jayesh R. Bellare*abcf
aDepartment of Biosciences and Bioengineering, Indian Institute of Technology-Bombay, Powai, Mumbai-400076, India. E-mail: jb@iitb.ac.in; Tel: +91 22 25767207
bCentre for Research in Nanotechnology & Science, Indian Institute of Technology-Bombay, Powai, Mumbai-400076, India
cDepartment of Chemical Engineering, Indian Institute of Technology-Bombay, Powai, Mumbai-400076, India
dNanomaterial Toxicology Group, CSIR-Indian Institute of Toxicology Research, M.G. Marg, Lucknow-226001, India
eDivision of Endocrinology and Center for Research in Anabolic Skeletal Targets in Health and Illness (ASTHI), CSIR-Central Drug Research Institute, Lucknow-226031, India
fWadhwani Research Center for Bioengineering, Indian Institute of Technology-Bombay, Powai, Mumbai-400076, India
First published on 19th September 2016
Abstract
The repair of critical bone loss remains a challenge to orthopaedic surgeons. Various artificial scaffolds have been intensively evaluated to provide an alternative solution for the repair and regeneration of bone defects; however, the inconsistent clinical performances of available materials have prompted the development of reactive 3D scaffolds for bone tissue engineering. We have studied the ability of a functionally designed 3D scaffold to bridge critical size defects and induce new bone formation in a New Zealand white rabbit tibial model, and have evaluated its ultra-structural properties using a combination of techniques, such as solid-state nuclear magnetic resonance (ssNMR), scanning electron microscopy (SEM), energy dispersive X-ray (EDX) and micro-computed tomography (μ-CT) with MIMICS® (Materialise's Interactive Medical Image Control System). ssNMR showed the structural similarity of the synthetic biomaterial to naturally occurring human bone. SEM studies showed an increase in Ca/P ratio with time, the progressively uniform distribution of elements in healed bones, and increased new bone formation, finally resembling native (intact) bone. μ-CT and MIMICS® demonstrated the pattern and morphology of new bone formed, with a noticeable shift in the HU unit towards compact bone, from week 2 to 25. The results suggest that in the critical size bone defect, the scaffold enhanced the formation of new bone having biomaterial composition, ultra-structure and quality resembling that of native bone, thus suggesting significant improvement in guided bone regeneration. This research provides a promising new avenue for orthopaedic implant design that safely biodegrades while promoting new bone growth.
1. Introduction
Bone conductive granules are clinically used in a variety of applications, including sinus lifts, periodontal defects, alveolar ridge augmentation, and craniofacial surgery.1–4 Although they have certain advantages, like easy insertion into cavities and mix easily with demineralized bone matrix (DBM), they do not provide the geometry and stability required at the defect site.5 It is also a challenge in orthopaedic surgery to provide a substitute with specific geometry and stability for the defect sites.In the treatment of large bone defects, bone tissue engineering has emerged as a promising approach, where bone defects are promoted for regeneration, using a combination of a scaffold with cells or osteoinductive growth factors.6,7 However, this approach presents a serious limitation, in terms of the realistic use of seed cells. Proliferation capacity is limited and moreover, the differentiation capacity is also stunned when expansion is done in vivo.8 As such, the use of growth factors has become attractive, but it is being increasingly recognized that growth factors have their own problems, such as low half-life, protein instability, high cost and undesired side effects.9,10 Therefore, our objective is to develop a non-biochemically osteoinductive scaffold, suitable for critical size defects.8 Hydroxyapatite (HA) and β-TCP porous osteoconductive materials, composed of the same ions as bone, have been widely used in bone regeneration. However, they resorb slowly or undergo little conversion into a bone-like material in vivo.11
There is a genuine need for the establishment of alternative therapies for the treatment of bone tissue loss resulting from injury or disease because tissue transplantation in patients is acutely limited, due to the severe shortage of donors and the high risk of immune rejection and disease transfer. New strategies through bone tissue engineering have been found to be very promising in the development of tissue-like substitutes. This is commonly achieved through a specific interplay between biomaterials and tissue.
Optimizing bone scaffolds for orthopaedic implants has been an intense topic of research over the past decade. Although degradation, bioresorption and biocompatibility have become more and more feasible lately,12–15 the mechanisms governing bone formation by these scaffolds preclude their clinical use. Critical parameters such as growth factors, biomaterials and biophysical stimulation, which are required for bone repair, have been studied extensively.16 However, the mechanism of bone healing requires in-depth investigation. Despite our knowledge that in developing bone (modeling), the gain in bone volume is coupled with mineral accrual, whether a similar process occurs during the healing of bone defects remains unanswered.17,18 Because, modeling as observed in developing bone is mimicked in the healing of bone defects, we therefore hypothesized that an increase in mineral density is directly correlated with the increase in volume in healing bone. We reported19 that carboxymethyl chitin could contribute its inherent haemostatic nature to the scaffold, as it is used in skin wound healing, which thus helps in enhancing early stage angiogenesis, as well as decrease blood loss during surgery.
In our previous study, we evaluated the efficacy of the n-HA/gel/CMC scaffold construct, compared to the self-healing of its empty contralateral SHAM. In this approach the promising scaffold offers new room for further investigation of its architectural and chemical cues, which instruct faster neo-bone formation by mimicking the native bone matrix.19,20 Our aim in this study is to gain insight into the biochemical behavior of the 3D scaffold in instructing the new bone formation and finally, the resemblance and interaction of new bone with the intact, native bone. Quantification of new bone regeneration by the scaffold at the defect site was done with a comprehensive assessment of the ultra-structural and geometric properties, matrix and mineral composition and micro-architecture of the regenerated bone. New bone formation and its ultra-structural properties were evaluated by micro-CT, scanning electron microscopy (SEM) and mapping, EDS (energy dispersive spectroscopy) and solid state nuclear magnetic resonance (ssNMR). ssNMR quantified the extent of water, collagen fine structure and crystalline order, which in turn indicated the chemical content of the scaffold and its resemblance to the normal human bone.21 SEM was used to determine the interaction and resemblance of new bone with the old native bone at the interface, which is further elucidated by mapping and EDS. μ-CT and MIMICS® (Materialise's Interactive Medical Image Control System) was used to determine the pattern and morphology of newly formed bone while investigation of the new bone formation at tissue level histology was performed.
2. Materials and methods
2.1 Graft preparation
The n-HA/gel/CMC scaffold construct was prepared by a solvent casting method, combined with a glutaraldehyde vapor crosslinking and freeze drying method, as mentioned in our previous report.19,20 An optimized composition of 0.5 g n-HA, 0.5 g CMC in 1 g gel was found to be the most ideal, on the basis of pore size, structural stability and mechanical strength. This may be due to the strong relationship and functioning interaction between Ca2+ and PO43− of n-HA and free NH4+ and COO− groups of gel/CMC hybrid polymers. The composite scaffold of dimensions 15 mm high × 3 mm wide × 2 mm deep, was sterilized with γ-irradiation at 20 kGy (or 2.0 MRad) at 30 °C in a Gamma Chamber (GC-1200, having 60Co as the source) at Tata Memorial Hospital, Parel, Mumbai. The radiation dose given was according to the standards of the International Atomic Energy Agency (IAEA).2.2 Animal surgery
The experimental model used for this study was an established dorsomedial tibial critical-sized defect model in rabbits.22 Prior to the commencement of the study, ethical approval was obtained from the Institutional Animal Ethics Committee of CSIR-Indian Institute of Toxicology Research (CSIR-IITR), as per the guidelines of the Committee for the Purpose of Control and Supervision of Experiments on Animals (CPCSEA), Ministry of Social Justice and Empowerment, Government of India.Twenty-eight adult male New Zealand white rabbits (1.5–2.0 kg) were recruited for the study. After inducing general anesthesia, a 20 mm longitudinal skin incision was made on the tibia, following proper draping of the site. Subcutaneous tissue and periosteum were separated gently from the cortical bone. The periosteum was elevated and retained by a self-retaining retractor. An appropriate defect size of 15 mm high × 3 mm wide × 2 mm deep was made, using an orthopedic hand drill machine with drill bit size of 1.5 mm, under saline irrigation to avoid thermal necrosis.22
To make the scaffolds compliant and resilient, the n-HA–gel–CMC (gamma irradiated) scaffolds were soaked in blood that oozed out from the incision during surgery. The scaffold constructs were then applied to the tibial defect. The periosteum was then reflected over the defect and the skin was closed in layers using chromic catgut (number 3–0) with simple interrupted sutures. The skin was sutured with nylon, using horizontal mattress sutures. The surgical wound was cleaned with povidone iodine (5%) and dressed with nitro-furazone ointment. An injection of enrofloxacin (5 mg kg−1 body weight, intramuscularly) was given twice daily for 7 days to prevent postoperative infection. An injection of meloxicam (0.1–0.2 mg kg−1 body weight), an anti-inflammatory analgesic, was administered intramuscularly for 3 days postoperatively. Sutures were removed on day 7. During the experimental period, the rabbits were held in cages, and room temperature and humidity were standardized. All animals were subjected to 12 h light/dark cycles and fed ad libitum with lucern grass and maintenance diet (Nutrilab rabbit feed, Provimi).
2.3 NMR spectroscopy
All NMR spectra were recorded on a NMR spectrometer (Bruker Biospin, Switzerland) operating at 500 MHz for 1H, 202.45 MHz for 31P, and 125.75 MHz for 13C, with a 2.5 HX double resonance probe. Magic Angle Spinning (MAS) frequency was set to 10.0 kHz for all experiments, controlled by a pneumatic unit with an accuracy of ±2 Hz. The temperature setting of 25 °C was maintained during all experiments.1H– 13C cross-polarization spectra were recorded with a 90 kHz radio-frequency field 1H excitation and decoupling with a sequence with SPINAL-64 (ref. 23) (SWf-TPPM).24 Contact time of 1.0 ms and 3.0 s of recycle delays were used during experiments. A total of 3 K and 10 K and 32–96 transients were recorded for 1H–13C CP and 1H spectra, respectively. Further, a 1H–31P frequency-switched Lee-Goldberg heteronuclear correlation (FSLG HETCOR) experiment was used to selectively observe proton signals originating from the mineral component of the bone, as described previously.25 In brief, 50 kHz and 100 kHz 1H decoupling were applied during the FSLG and t2 period, respectively. 2D spectra were collected with 64 data points using 128 scans per data point in the indirect dimension.
2.4 Scanning electron microscopy observation
At the termination of the experiment, animals were euthanized by administering sodium pentobarbital ≥ 100 mg kg−1 via IV. The test bones were retrieved/washed with saline and dried. Excised bones were embedded in an acrylic material, and 50 μm cross sections were made. The microstructure of the ossification site was observed for comparison of new bone formed in different groups and their interfacial interaction with old bone, using a scanning electron microscope (Hitachi, S-3400 N, UK) at an accelerating voltage of 15 kV. The samples were coated using a gold sputter coater, SC7640 Sputter Coater (Quorum Technologies Ltd, UK).Measurement of the elemental composition (calcium, phosphorus and oxygen) was done by energy-dispersive spectroscopy (EDX), and mapping was observed by INCA software (Oxford instruments, Japan). A standard graph of calcium phosphate ratios observed using the EDX system was plotted against the empirical ratio of these standards, calculated from their respective formulae as described in literature.26 This graph was used to correct all observed ratios.
2.5 Analysis of bone using μCT and MIMICS®
The tibiae were dissected and bone blocks were submerged in a 4% neutral formalin buffered solution, which was changed once after 24 h to ensure good fixation. New bone formation was analyzed with the SkyScan 1076 CT scanner (Aartselaar, Belgium). Scans were obtained at 100 kV and 100 μA with the use of an aluminum–copper filter to optimize the contrast, a 360° rotation, an average of four frames and a rotation step of 0.4° (2700 images per scan). The reconstruction software (NRecon v.1.4.4) was used to create 2D 2000 × 2000 pixel images.27 ROI of cortical and trabecular bone from each sample was then applied for the analysis of 3D microarchitecture parameters using CTAn software (Skyscan, Kontich, Belgium). To visualize the 3D representation of the treated defect sites CTan (Skyscan) was used, which further translated into full 3D prototypes using MIMICS® 13.01 (Materialise, Leuven, Belgium) at CDRI, India. Images created in the CT analysis were stored in a Dicom format and imported for the 3D model construction. The systematic variation in the bone architecture the inside bone construct was analyzed using computer imaging technology, MIMICS®.28 MIMICS® was used with its automatic segmentation and mesher to reconstruct the geometric model of the bone. Further images were analyzed on the basis of the number of voxels present in a particular range of Hounsfield Units (HU). In analyzing the pattern and distribution of new bone formed, the thresholds employed were 1–225 Hounsfield units (HU) for soft tissue, 148–661 HU for adult spongial bone and 662–1988 HU for adult compact bone, as represented by green, red and blue, respectively.2.6 Histological studies
Bone sections containing defect sites were washed thoroughly with normal saline and fixed in 10% formalin for 7 days. Subsequently, the bone sections were decalcified in 5% nitric acid and checked regularly for decalcification. Once the bone pieces became flexible, transparent and easily penetrable by pins, they were considered to be completely decalcified. The tissues were processed in a routine procedure and 4 μm sections were cut and stained with haemotoxylin and eosin.22,293. Results and discussion
The results described in the following demonstrate the ability of this designer 3D scaffold to bridge critical size defects and induce new bone formation in a New Zealand white rabbit tibial model. We report its ultra-structural properties and evolution of healing by using ssNMR, SEM, EDX and μ-CT with MIMICS®, which reveal the pattern and morphology of new bone formed.3.1 Ultra-structural properties of the scaffold
We recorded 1D proton spectra for natural human bone and the composite scaffold as shown in Fig. 1A. Two prominent peaks were observed in both spectra, corresponding to water and hydroxyl ions. From the spectra, it appears that the hydrogen-bonding profile in the scaffold was very similar to that in the natural bone sample. 13C chemical shifts are indicative of the structural and conformational properties of collagen. Therefore, to probe the conformational similarity in organic contents of the scaffold to natural bone, we recorded the natural abundance of 13C chemical shifts using a CPMAS experiment, where protons were decoupled during 13C acquisition. We observed a close similarity, with respect to various amino acids chemical shifts, to the intact bone, as shown in Fig. 1B. All major organic constituents of bone are clearly noticeable in the scaffold, except that peaks corresponding to AlaCβ were missing in the scaffold spectrum. The inorganic component of the intact bone consists of mainly hydroxyapatite (Ca10(PO4)6(OH)2) and thus, the phosphorus nucleus could be used to determine the proximity of inorganic components of the scaffold with bone.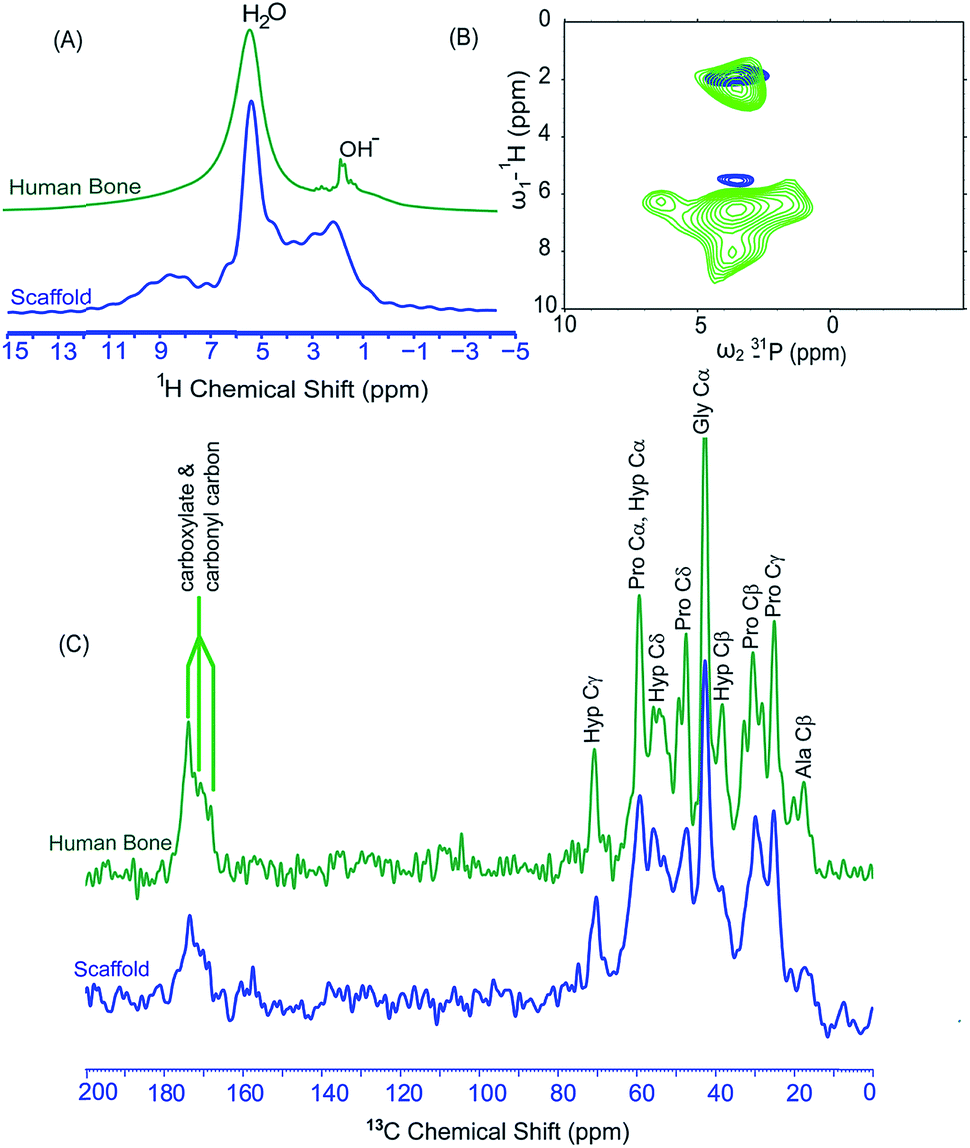 | ||
| Fig. 1 ssNMR spectra of human bone with the n-HA/gel/CMC scaffold. (A) 1H ssNMR MAS spectra at MAS frequency of 10 kHz, showing the profile of bound water and lipid/OH−, (B) 2D heteronuclear (1H–31P) experiments at MAS frequency of 10 kHz (contact time CT = 1 ms) and (C) 1H decoupled cross-polarized magic angle spinning (CPMAS) 13C ssNMR spectra showing various amino acid components of collagen I. | ||
We used 2D 31P–1H FSLG-HETCOR to probe the structural features of hydroxyapatite and its interaction with water molecules. As shown in Fig. 1C, a close resemblance was observed in the HETCOR pattern for both samples. There is single resonance in the phosphorus dimension (direct dimension), reporting a very similar chemical environment of phosphorus in the bone and the scaffold, whereas, two peaks in the proton dimension (indirect dimension) report properties of hydrogen and their interaction with inorganic phosphate. Also apparent in Fig. 1C, there are differences in the chemical shift and line width for one of the correlation peaks. Such differences could be attributed to the presence of relatively free water in the scaffold, compared to intact bone.
3.2 SEM analysis of the defect sites
SEM was performed on the scaffold-implanted defects to study bone formation at the surface and within the scaffold, which was further elucidated by mapping-EDS and histology. SEM images showed morphologies typical of natural bone (haversian/osteonal bone pattern) at the scaffold assisted bone healing site, which were observed at various post-implantation time points (Fig. 2).30 At 2 and 4 weeks, osteoid formation (unmineralized/woven bone) was observed in- and around the implant. At 7 weeks, lamellar structures indicative of mature bone were observed towards the central position of the defect, which subsequently appeared to undergo resorption as observed at 14 weeks, suggesting the occurrence of bone remodeling. At 25 weeks, osteon (concentric patterns) was clearly visible, indicative of the formation of a haversian system with woven osteoid localized near the centre (Fig. 2). | ||
| Fig. 2 Representative SEM of the entire defect site containing the implant at the indicated time points post-implantation. Mapping column: Ca: green, P: blue and O: red. The interface becomes less distinct and eventually disappears with the progression of time, making its microstructure more closely resemble the microstructure of intact old/native bone with noticeable osteon formation. | ||
SEM-mapping analysis demonstrated differences in the distribution patterns of atoms. Ca and P had similar atomic mapping patterns in all cases, whereas greater oxygen clusters were observed at weeks 2, 7 and 10. Atomic arrangements of these three elements were rather discontinuous till week 14. At week 25, uniform distribution of the three elements was observed (Fig. 2).
The Ca/P ratio, a deterministic parameter for the bone quality, was determined by SEM-EDX. EDX analysis showed the Ca/P value to be 1.63 for the normal bone.31 It was shown that a deviation from the ideal hydroxyapatite stoichiometry value of Ca/P (1.67) happens in the preliminary stage of bone formation. Such a deviation can be explained on the basis of the presence of a precursor of hydroxyapatite in immature bones.32 EDX analysis was performed for samples and Ca/P values were found to be nearly 1.67 at 14 and 25 weeks, which was significantly higher than the previous time points, suggesting increased mineral deposition at week 14 (Fig. 3C). A direct correlation was observed between the mineral density in healed bone with time, which shows that the SEM-mapping had an even distribution of Ca and P elements. Our results agree with this proposition and show that the Ca/P ratio increases in healing bone, suggesting the formation of older bone.
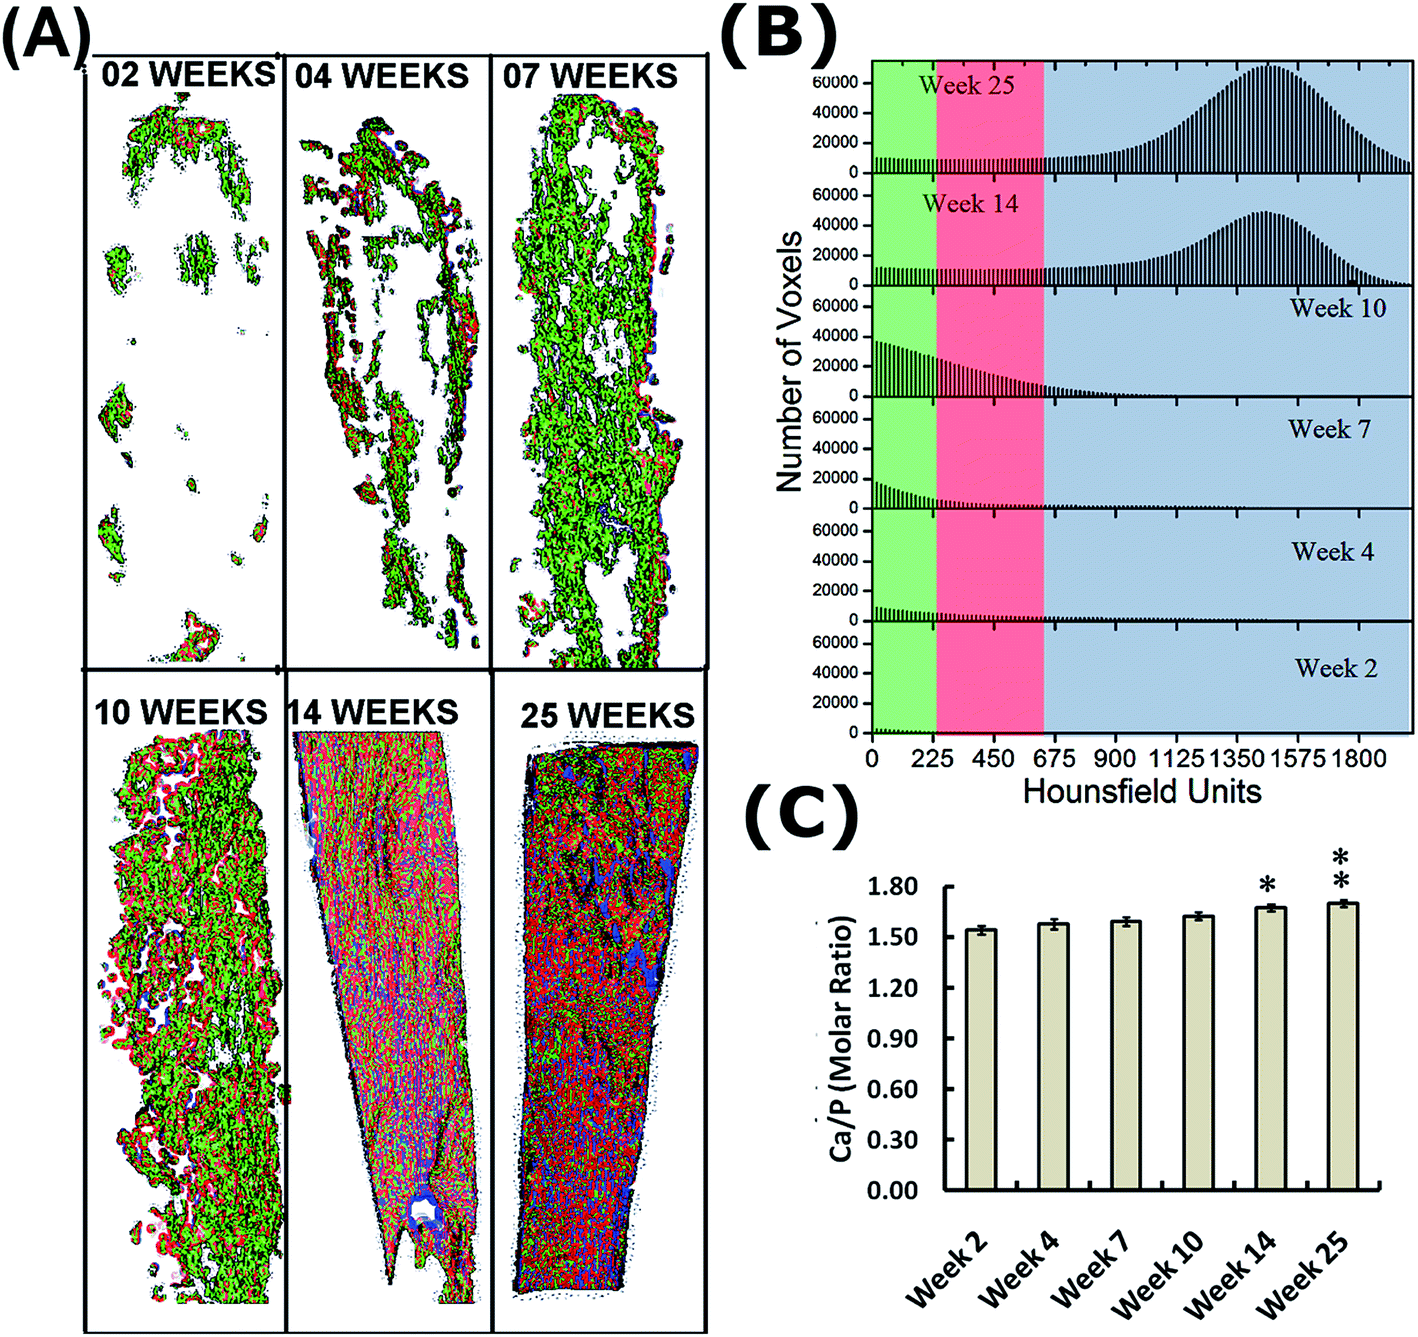 | ||
| Fig. 3 (A) Restored 3D model of the newly formed bone using combined effects of CTan and MIMICS of entire defects treated with n-HA/gel/CMC scaffold composite defects at week 02 to week 25, respectively. (B) Mimics analysis: in analyzing the pattern and distribution, the thresholds employed were 1–225 Hounsfield units (HU) for soft tissue, 148–661 HU for spongial bone and 662–1988 HU for compact bone, as represented by green, red and blue, respectively. (C) The Ca/P ratio values are expressed as mean ± SEM (n = 3 rabbits/group); *p < 0.05 and **p < 0.01, versus week 2, as determined by one-way ANOVA, followed by Tukey's multiple comparison test. | ||
SEM imaging and elemental mapping of the healing areas as shown in Fig. 2, demonstrate that the new bone formed during the healing process got more and more tightly integrated with the old bone as time increased from 2 to 25 weeks. This is seen in the low magnification column of Fig. 2, where the interface (marked IF in Fig. 2) at week 2 is prominent; however, as time progresses (going down the column of Fig. 2), the interface becomes less distinct and eventually disappears as its mineral density increases and remodeling happens, making its microstructure more closely resemble the microstructure of old/native bone, including the formation of osteon.
3.3 μ-CT and MIMICS® analysis to access the bone micro-architecture
In order to quantify micro-CT images for the relative extents of soft tissue, spongial bone and cortical bone, it is necessary to transform the X-ray intensity as natively measured in Hounsfield units (HU), into the tissue types. This is done by voxel-level segmentation into discretized levels. Two thresholds are identified: one at the soft tissue-spongial bone limit, the other at the spongial bone-cortical bone limit. It is convenient to use MIMICS® to do this because the thresholds are built into the system, which in our case were determined to be 225, 661 and 1980. The outcome is a time series of the special distribution, the relative amount of three tissue types, and a time series for this, which can be useful in understanding bone healing and compaction.The MIMICS® analysis of our 3D μ-CT images is presented in Fig. 3, where for convenience, the three bone tissue types have been false colour coded: the soft tissue is green, spongial bone is red and cortical bone is blue. Early healing (week 2) as shown in Fig. 3A begins at the periphery and moves towards the centre. At this stage of healing, the tissue laid is soft tissue (green). As the time increases from week 2 to week 7 the soft tissue almost entirely fills the defect, and simultaneously spongial bone (red) is seen at the periphery where earlier, the soft tissue was first laid. After week 7, the spongial bone (red) formation increasingly occurs and its density increases. As time progresses to week 14 and towards week 25, the spongial bone transforms to cortical bone (blue). This transformation simultaneously happens throughout the defect rather than gradually from the periphery to the center, which was seen in the way soft tissue was first laid at the initial time points. By week 25, complete healing occurred with spatially uniform distribution of all three tissue types, but with more cortical bone, less spongial and the least soft tissue.
The relative distribution of the three tissue types (soft, spongial and cortical) in the entire defect is shown in Fig. 3B, which shows the total number of voxels distributed across various tissue types. In the early phase of healing, at weeks 2 to 7, the voxels were mainly distributed in the region of soft tissue (1–225 HU, green). The number of voxels also increased as soft tissue was laid towards the centre. There was no significant spongial and cortical bone seen at this time. As time increased from week 7 onwards, spongial bone formation (226–661 HU, green) occurred. At week 10, the distribution had a wider spread in the soft-spongy bone region of 1–661 HU units. As time progressed to week 14 and then towards week 25, the distribution showed the highest density of numbers of voxels in the cortical bone region (661–1980 HU, blue), this indicates a high compact bone density in week 14 and 25, in comparison to other weeks. At week 25, some amount of soft, as well as spongial bone was still present, although the dense cortical bone was predominant. This effect was also seen in the spatial arrangement of Fig. 3A, for week 25.
Our results show that the bone volume, in terms of ratio of compact bone (blue) to spongial bone (red) (Table 1), increased from 0.6 to 5.7 between week 2 and 14 and then to 9.7 by week 25. We have demonstrated here that compact, as well as cortical bone volume increases gradually as healing occurs. Taking this together with our earlier results of increasing Ca/P ratio (mineral density), we demonstrate that bone volume and mineral density increase concurrently in healing bone.
 |
3.4 Histological investigations
Histology showed that the scaffold surface facilitates osteoblastic new bone formation on it and the host bone. At 2 weeks, the cortical compartment was bridged by new woven bone via endochondral ossification (Fig. 4). Inside the defect, woven bone ingrowth and ongrowth were evident with densely organized bony islets, with fibrous tissue infiltration. Histology at 4 weeks showed the replacement of the scaffold with maturing woven bone. Further, at weeks 7 and 10, the scaffold was substituted with larger new bone plates, undergoing substantial remodeling (Fig. 4). Eventually, mature lamellar bone towards the central region of the defect and the osteoclastic resorption infiltration along with fibrous connecting tissues at the periphery were seen. The interface was observed to contain osteoids and de novo bone formation migrating from the periphery to the center of the defect, without fibrous encapsulation. | ||
| Fig. 4 Histology of the n-HA/gel/CMC scaffold composite treated defect and SHAM sites after weeks 02, 04, 07, 10, 14 and, 25, respectively. NB: new bone; OB: osteoblast; OCT: osteocyte; RB: remodelling bone; OCL: osteoclast; HC: haversian canal and EO: endochondral ossification; scale bar = 100 μm. | ||
The histology data confirm that the implanted scaffold was substituted by the natural calcification matrix. Eventually, the resorption of the scaffold by the osteoclast cells simultaneously induced new bone formation by the osteoblasts. Overall, in the most superficial parts of the defect bony lamina, those adjacent to the periosteum, the defect was bridged by a fibrous scar with minimal amount of immature woven bone around the edges of the defect. Fibrous connective tissue originated from the periosteal surface and penetrated inside. Moving to the inner endosteal surface, tiny endosteal bony trabeculae filled the defect from the inside, intermixed with fibroadipose tissue and hemopoietic bone marrow.
Scaffold initiated bone formed uniformly throughout the defect. Formation was observed in discrete locations, whereas fibrous connective tissues were visualized at the centre of the osteotomy. Bone regeneration started as a woven pattern having immature bone. Subsequently, these patterns showed the formation of a primitive haversian canal, which originated from the fusion of newly formed trabeculae bone. Consequently, a high cellular spongy bone having osteocyte cells was noticed. Remodeling of newly formed bone was followed by the gradual assimilation of the trabeculae bones.
Most of the fibrovascular spaces that were isolated transformed into the focus of haversian canals. As in deposition of new bone, there were rows of active osteoblast action, characteristic of active remodelling. Bone injuries regenerate step wise as follows: granulation tissue forms and then osteoprogenitor cells differentiate, osteoblasts are formed, which lay the primary bone matrix.33 Meanwhile, osteoclastic cells are resorbing bone, while osteoblasts are laying new bone, then primary bone gets transformed into secondary mature bone by the replacement process termed as remodeling. This is a slow process needing as much as 24 weeks.34,35 These stepwise phenomena were exactly followed in the healing process of the present study.
A remarkable cross-correlation was observed in the various bone healing parameters used herein, i.e., SEM, Ca/P ratio, MIMICS® and histology analysis.
4. Conclusion
The success of a bone implant is governed by various factors that include the structural and functional similarity of the implanted material to the bone matrix to avoid any immune response, and its ability to initiate and accelerate repair functions. These requirements are facilitated by implants having close structural and chemical similarity to native bone. In order to develop the complex microstructure, it is necessary to control all factors; i.e., the organic–inorganic and the organic–organic interactions. The organic–inorganic interaction is necessary for toughness and density of the nano-composite, while the organic–organic interaction controls matrix organic templates and the formation of micrometer-sized pores. These important factors are successfully met in the scaffold described above, as depicted by ssNMR and SEM equipped with EDS-mapping.ssNMR results indicate a close structural resemblance in the water (1H), as well as organic contents (13C) of the native scaffold with natural human bone. The differences seen in 2D 31P–1H Hetcor ssNMR are due to the presence of free water in the pores of the scaffold, as compared to native human bone. As bone growth proceeds, the initial discontinuous elemental and crystal distribution arising from lattice defects becomes more uniform; due to compaction of bone by week 25, the Ca/P ratio became 1.70, which is well correlated with the hydroxyapatite present in native human bone.
Analysis of CT data with MIMICS translation into bone density also demonstrates increased mineral density, coupled with increased bone volume. Histology at week 7 and 10 shows the resorption of the scaffold and its replacement by new bone, which continues up to week 14. The scaffold-healing bone complex has shown systemic and gradual calcification. In the early weeks of healing, the mineral density increases, followed by events of bone maturation. This process is further assisted by osteoblast and osteocyte cells in a cyclic manner that produces and accumulates minerals in the bone matrix via remodeling, which leads to the osteon formation.
The bio-mimetic architecture and chemical content of the scaffold is the main key for bone tissue regeneration.36 Like native bone, the scaffolding material is composed of organic (gel/CMC bipolymer) and inorganic (nano-HA) components. The osteo-mimetic architecture (interconnectivity and integrity) and physico-chemical properties of the nHA/gel/CMC scaffold provide structural support to the newly grown tissues and thus facilitate the adhesion of cells onto the scaffold surface, which acts as a bioreactor. The scaffold behaves analogous to the native bone, reconstructing the local and systemic tissue–tissue interaction to encourage new functional tissue formation. The combinational use of the above techniques makes it possible to develop an optimum scaffold and to evaluate its role in bone regeneration.
5. Authors' role
Study design: AKS, NS, NC and JRB. Data recording: AKS and NS. Data analysis: AKS, NS, MT, NC, AK and JRB. Data interpretation: AKS, NS, MT, SV, NC, AK and JRB. Drafting manuscript: AKS, NS, AD, AK, NC and JRB. Approving final version of manuscript: AKS, NS, AD, AK, NC and JRB.Acknowledgements
The authors are thankful to Sophisticated Analytical Instrument Facility (SAIF) and Centre for Research in Nanotechnology and Science (CRNTS), Indian Institute of Technology Bombay, Mumbai for the SEM Facility. We thank Dr Rajan Singh and Dr Rohit Teotia for helping in characterization. Atul Kumar Singh is supported by a fellowship DST-INSPIRE from the Department of Science & Technology (DST), Government of India. NC acknowledges funding from CSIR (BSC0201). JRB acknowledges funding from DBT, India (BT/PR3138/NNT/28/550/2011). Authors are thankful to National facility of High-Field NMR at TIFR, Mumbai for the NMR spectrometer time.References
- G. Bayraktar, A. Kaynar, O. Duran, B. Oner, S. Ozturk and S. Palanduz, European Journal of Prosthodontics and Restorative Dentistry, 1998, 6, 9–12 CAS.
- C. M. Cobb, J. D. Eick, B. F. Barker, E. L. Mosby and W. R. Hiatt, Journal of Oral and Maxillofacial Surgery, 1990, 48, 268–275 CAS.
- A. Corsair, Journal of Oral Implantology, 1990, 16, 125–128 CAS.
- J. R. Wagner, Journal of Oral Implantology, 1991, 17, 152–164 CAS.
- E. Liljensten, E. Adolfsson, K. G. Strid and P. Thomsen, Clinical Implant Dentistry and Related Research, 2003, 5, 95–101 Search PubMed.
- B. D. Boyan, C. H. Lohmann, J. Romero and Z. Schwartz, Clinics in Plastic Surgery, 1999, 26(ix), 629–645 CAS.
- H. Petite, V. Viateau, W. Bensaid, A. Meunier, C. de Pollak, M. Bourguignon, K. Oudina, L. Sedel and G. Guillemin, Nat. Biotechnol., 2000, 18, 959–963 CrossRef CAS PubMed.
- J. Zhang, J. Guan, C. Zhang, H. Wang, W. Huang, S. Guo, X. Niu, Z. Xie and Y. Wang, Biomed. Mater., 2015, 10, 065011 CrossRef PubMed.
- A. Aravamudhan, D. M. Ramos, J. Nip, A. Subramanian, R. James, M. D. Harmon, X. Yu and S. G. Kumbar, Curr. Pharm. Des., 2013, 19, 3420–3428 CrossRef CAS PubMed.
- C. E. Segar, M. E. Ogle and E. A. Botchwey, Curr. Pharm. Des., 2013, 19, 3403–3419 CrossRef CAS PubMed.
- A. G. Alejandro, M. P. L. José, B. G. María and L. C. Rómulo, Biomed. Mater., 2006, 1, 100 CrossRef PubMed.
- R. F. Brown, M. N. Rahaman, A. B. Dwilewicz, W. Huang, D. E. Day, Y. Li and B. S. Bal, J. Biomed. Mater. Res., Part A, 2009, 88, 392–400 CrossRef PubMed.
- Z. Xie, X. Cui, C. Zhao, W. Huang, J. Wang and C. Zhang, Antimicrob. Agents Chemother., 2013, 57, 3293–3298 CrossRef CAS PubMed.
- Z. Xie, X. Liu, W. Jia, C. Zhang, W. Huang and J. Wang, J. Controlled Release, 2009, 139, 118–126 CrossRef CAS PubMed.
- X. Zhang, W. Jia, Y. Gu, W. Xiao, X. Liu, D. Wang, C. Zhang, W. Huang, M. N. Rahaman, D. E. Day and N. Zhou, Biomaterials, 2010, 31, 5865–5874 CrossRef CAS PubMed.
- C. S. Moucha and T. A. Einhorn, in Bone Regeneration and Repair, Springer, 2005, pp. 169–194 Search PubMed.
- L. M. Miller, W. Little, A. Schirmer, F. Sheik, B. Busa and S. Judex, J. Bone Miner. Res., 2007, 22, 1037–1045 CrossRef PubMed.
- B. Busa, L. M. Miller, C. T. Rubin, Y. X. Qin and S. Judex, Calcif. Tissue Int., 2005, 77, 386–394 CrossRef CAS PubMed.
- N. Sagar, A. K. Pandey, D. Gurbani, K. Khan, D. Singh, B. P. Chaudhari, V. P. Soni, N. Chattopadhyay, A. Dhawan and J. R. Bellare, PLoS One, 2013, 8, e77578 CAS.
- N. Sagar, V. P. Soni and J. R. Bellare, J. Biomed. Mater. Res., Part B, 2012, 100, 624–636 CrossRef PubMed.
- A. K. Singh, A. L. Gajiwala, R. K. Rai, M. P. Khan, C. Singh, T. Barbhuyan, S. Vijayalakshmi, N. Chattopadhyay, N. Sinha, A. Kumar and J. R. Bellare, Mater. Sci. Eng., C, 2016, 62, 574–584 CrossRef CAS PubMed.
- N. Sagar, A. K. Pandey, D. Gurbani, K. Khan, D. Singh, B. P. Chaudhari, V. P. Soni, N. Chattopadhyay, A. Dhawan and J. R. Bellare, PLoS One, 2013, 8, e77578 CAS.
- B. M. Fung, A. K. Khitrin and K. Ermolaev, J. Magn. Reson., 2000, 142, 97–101 CrossRef CAS PubMed.
- R. S. Thakur, N. D. Kurur and P. K. Madhu, Chem. Phys. Lett., 2006, 426, 459–463 CrossRef CAS.
- E. E. Wilson, A. Awonusi, M. D. Morris, D. H. Kohn, M. M. J. Tecklenburg and L. W. Beck, Biophys. J., 2006, 90, 3722–3731 CrossRef CAS PubMed.
- W. J. Landis and M. J. Glimcher, J. Ultrastruct. Res., 1978, 63, 188–223 CrossRef CAS PubMed.
- M. Monjo, M. Rubert, J. C. Wohlfahrt, H. J. RÃnold, J. E. Ellingsen and S. P. Lyngstadaas, Acta Biomater., 2010, 6, 1405–1412 CrossRef CAS PubMed.
- H. S. Tuan and D. W. Hutmacher, Computer-Aided Design, 2005, 37, 1151–1161 CrossRef.
- S. Sharma, D. J. Patil, V. P. Soni, L. B. Sarkate, G. S. Khandekar and J. R. Bellare, J. Tissue Eng. Regener. Med., 2009, 3, 501–511 CrossRef CAS PubMed.
- J. Wierzchos, T. Falcioni, A. Kiciak, J. WoliÅ„ski, R. Koczorowski, P. Chomicki, M. Porembska and C. Ascaso, Micron, 2008, 39, 1363–1370 CrossRef CAS PubMed.
- J. P. Cassella, N. Garrington, T. C. B. Stamp and S. H. Ali, Calcif. Tissue Int., 1995, 56, 118–122 CrossRef CAS PubMed.
- R. Legros, N. Balmain and G. Bonel, Calcif. Tissue Int., 1987, 41, 137–144 CrossRef CAS PubMed.
- P. S. Landry, A. A. Marino, K. K. Sadasivan and J. A. Albright, Clin. Orthop. Relat. Res., 1996, 332, 260–273 Search PubMed.
- I. R. H. Kramer, H. C. Killey and H. C. Wright, Arch. Oral Biol., 1968, 13, 1263–1273 CrossRef CAS PubMed.
- E. HjÃrting-Hansen, Studies on Implantation of Anorganic Bone in Cystic Jaw Lesions: Case Records, Munksgaard, 1970 Search PubMed.
- T. Gong, J. Xie, J. Liao, T. Zhang, S. Lin and Y. Lin, Bone Res., 2015, 3, 15029 CrossRef CAS PubMed.
Footnote |
| † Authors contributed equally to this work. |
| This journal is © The Royal Society of Chemistry 2016 |