Effect of lead and caesium on the mechanical, vibrational and thermodynamic properties of hexagonal fluorocarbonates: a comparative first principles study

E. Narsimha Raoa, G. Vaitheeswaran*a, A. H. Reshakbc and S. Auluckd
aAdvanced Center of Research in High Energy Materials (ACRHEM), University of Hyderabad, Prof. C. R. Rao Road, Gachibowli, Hyderabad-500 046, Telangana, India. E-mail: vaithee@uohyd.ac.in; Tel: +91 40 23138709
bNew Technologies-Research Center, University of West Bohemia, Univerzitni 8, 30614 Pilsen, Czech Republic
cSchool of Material Engineering, University Malaysia, 01007 Kangar, Perlis, Malaysia
dCouncil of Scientific and Industrial Research, National Physical Laboratory, Dr K S Krishnan Marg, New Delhi 110012, India

Received 12th August 2016 , Accepted 5th October 2016

First published on 6th October 2016


Abstract

Exploration of the structure–property correlation of fluorocarbon materials has received much interest over recent years due to their extremely strong nonlinear optical (NLO) responses (13.6 times that of KH2PO4(KDP)), good ultraviolet (UV) cutoff (<200 nm) with better mechanical and chemical stability. In the present work a novel CsPbCO3F, ABCO3F (A = K, Rb; B = Ca, Sr) series is explored using density functional theory (DFT) calculations focusing on their mechanical, vibrational and thermodynamic properties and their Born effective charge (BEC) tensors. The calculated structural properties of lead carbonate fluoride with a semi-empirical dispersion corrected Ortmann Bechstedt Schmidt (OBS) method are found to be in relatively close agreement with experimental data. The obtained single crystal elastic constants satisfy the Born's mechanical stability criteria. The calculated bulk modulus value of lead carbonate (41 GPa) indicates its soft nature compared with other studied carbonates and is observed to be harder than KDP (26 GPa). In addition we have calculated the polycrystalline properties, bulk modulus (B), shear modulus (G), Young's modulus (E) and Poisson's ratio (σ) of CsPbCO3F and ABCO3F (A = K, Rb; B = Ca, Sr) using the Voigt, Reuss and Hill approximations. The obtained B/G (>1.75) results reveal the ductile nature of all the studied materials except for KCaCO3F (1.67) which is found to be brittle. Results of the hexagonal shear anisotropic factors (A1, A2, A3) indicate that all the studied crystals possess considerable mechanical anisotropy. Calculated zone centered vibrational infrared (IR) spectra confirm the higher optical activity of CsPbCO3F compared with the other carbonates. The obtained high frequency modes are consistent with the experimental values. The obtained BECs reveal the presence of a mixed covalent–ionic character of the compounds. The thermodynamic properties, namely entropy, Debye temperature, heat capacity, enthalpy, thermal expansion and thermal conductivity, have been computed at different temperatures ranging from 5 K to 1000 K. The results show that the lead based compound has the highest thermal conductivity (32.430 W m−1 K−1) of the reported carbonate materials. The results clearly indicate that the material could show better durability than LiNbO3, α-SiO2, CaCO3, and Ba3B6O12 hexagonal NLO materials. All the computed thermodynamic properties indicate that CsPbCO3F might be a potential candidate for second-order NLO applications. The polycrystalline, vibrational and thermodynamic properties of carbonate materials presented in this work could be a step forward in the process of developing new NLO materials.

1 Introduction

NLO materials play a crucial role in nonlinear optics, in particular they have a great impact on laser technology, optical storage communications, optical computing systems, information technology and have wide industrial applications.1,2 These materials also have applications in photochemical synthesis and for the efficient generation and detection of terahertz pulses.3 The search for new efficient materials which are prime candidates for different nonlinear optical processes has become very active ever since the second harmonic generation (SHG) phenomena was first observed in single crystal quartz by Franken and co-workers in 1961.4 This discovery turned researchers’ attention towards inorganic anionic groups with π-conjugated systems with a planar triangle structure such as borates [BO3]3−, carbonates [CO3]2− and nitrates [NO3].5,6 Despite their applications in various fields, the scarcity of new single crystals with excellent optical qualities, large nonlinear coefficients, higher laser damage threshold voltage values, suitable birefringence, good mechanical strength and chemical stability by reliable crystal growth techniques is slowing down the development of new optical devices.8,10–12 Till now, in accordance with the frequency conversion efficiency & transparency range, there are three types of NLO materials available in the literature which can serve in the visible, ultra violet (UV) and infrared (IR) regions of optical spectra.13 Recent experimental and theoretical studies reveal that a new possible carbonate based group of NLO materials can serve as a better candidate, like borates, in the UV and deep-UV frequency window.5,7–9,16 The idea behind the work is that, ”since borates having [BO3]3− unit as a anionic group with planar triangular structure, they are found to be promising NLO materials in UV and deep-UV regions according to Chen's anionic group theory”,15 the crystals possessing a [CO3]2− unit as an anionic group which also have a similar planar triangular structure arrangement can be expected to show a good non-linear optical response in this frequency window of optical spectra.5

It is known that most fluorocarbonates naturally occur in alkaline rock complexes and over the past few decades numerous attempts have made to synthesize these carbonate based crystals at laboratory scales.14 The A2A′CO3F (A, A′ = K, Rb, Cs) fluorocarbonate series obtained by Albert et al.,17,18 KCaCO3F19,20 phase discovered by West Fletcher in 1992, and the lead carbonate fluoride single crystal Pb2F2CO3 reported by Bengt Aurivillius in 1983 (ref. 21) are known as the starting carbonate materials in this field. Recent experimental and theoretical attempts in this direction have yielded many new novel carbonate fluoride crystals with good chemical and mechanical stability and strong nonlinear optical responses up to 530 (ref. 22) times higher than α-SiO2 which is the highest of all the carbonate fluoride crystals known to date. Fluoride–oxygen based compounds are also found to be useful matrices for bi-doped rare earth compounds.23 In 2012, Zou et al., synthesized ABCO3F series carbonate fluoride crystals which were found to be good phase matchable materials in the UV region with nonlinear coefficients which are 3.33 (A = K, Rb and B = Sr), 3.61 (A = K and B = Ca), 1.11 (A = Rb, Cs and B = Ca) and 1.20 (A = Cs and B = Ba) times larger than that of d36 of the KDP crystal with good mechanical stability (bulk modulus of 50 GPa).7 Kang et al.,16 theoretically proposed a new series of ABeCO3F and AAlCO3F2 (A = Li, Na, K, Rb, Cs) compounds with IIA and IIIA light metal cation substitution in ABCO3F series using density functional theory calculations. This study suggests that the carbonate fluoride materials might have applications in the deep-UV region by further reducing the absorption edges to around 150 nm. Recently, Zou et al.22 synthesized the first lead carbonate fluoride crystal CsPbCO3F by solid state reactions. It crystallizes in a non-centrosymmetric space group P[6 with combining macron]m2 with a = 5.3888 Å, c = 5.1071 Å with a monomolecular unit cell. The structure consists of alternate stacked PbCO3 and CsF layers perpendicular to the c-axis connected by Pb–F–Pb chains parallel to the c-axis. More recently in 2014, Thao Tran et al.9 synthesized the RbPbCO3F crystal structure along with CsPbCO3F through solvothermal and conventional solid state techniques and found that CsPbCO3F crystallizes in a non-centrosymmetric space group [6 with combining macron] with a = 5.393 Å, c = 5.116 Å with Z = 1 formula unit per unit cell. Even though there are some dissimilarities existing between the previously reported structures by Zou et al. and Thao Tran et al., in both cases the observed nonlinear coefficients are 530 and 160 times higher than that of the α-SiO2 crystal respectively. This seems to be the record value among all the reported carbonate fluoride materials till now. This uniqueness of the material and its promising optical responses known to arise from the p–π interaction between Pb2+ and [CO3]2− within the [Pb (CO3)] layers strongly motivated us to address the in-depth structure–property correlation issues in this material through a density functional theory approach.

We have focused on addressing the origin of the nonlinear optical response of CsPbCO3F, ABCO3F (A = K, Rb; B = Ca, Sr) crystals from a lattice dynamics point of view. In the present study we report the role of van der Waals (vdW) interactions in predicting the stability of the lead carbonate’s crystal structure and single crystal elastic constants. The polycrystalline properties of CsPbCO3F, RbSrCO3F, KSrCO3F, KCaCO3F materials are also extracted from single elastic constant values using Voigt, Reuss, Hill approximations.24–26 Zone center vibrational frequencies (infrared (IR) spectra) are calculated using a density functional perturbation theory (DFPT) approach and complete mode assignments are analyzed in detail. We have examined the nature of directional bonding and frequency and intensity variations of vibrational modes in detail based on the calculated Born effective charge (BEC) tensors. We report the thermodynamic properties which are crucial for exploring the practical applicability (durability) of a NLO material. To the best of our knowledge, to date, such studies have not been reported in the literature for the present studied novel carbonate fluorides. In order to explore more about the vibrational nature of the bonds, we further turned our focus to gaining a better understanding of the heat-conduction process. The thermodynamic properties including entropy, Debye temperature, heat capacity, enthalpy, thermal expansion and intrinsic lattice thermal conductivity at different temperatures ranging from 5 K to 1000 K are reported. We have compared the obtained results with experimentally reported thermal conductivity values of several hexagonal types of NLO materials. Since, there are several recent reports on the crystal structures of carbonate fluoride materials, we explore the crucial structure–property correlation in carbonate group compounds based on different aspects. We believe that the properties studied in this work which are related to lattice dynamics parts such as mechanical, vibrational and thermodynamic properties could open up new possibilities in the world of NLO materials.

2 Calculation methods

First principles calculations play a very important role in explaining the structure property correlations of various materials. Details obtained from these simulations are therefore very useful for new developments in the domain of nonlinear optical materials and their possible practical applications. In the present work, we have used a quantum mechanics based Cambridge Series of Total Energy (CASTEP) program,27,28 which works based on the density functional theory plane-wave pseudo potential (PP) method. In order to calculate various structure dependent properties of the present carbonate materials of interest, we have taken the experimental structural details as given in ref. 5 and 22. Experimental geometries of CsPbCO3F, ABCO3F (A = K, Rb; B = Ca, Sr) are optimized with maximum tolerances for energy of 5.0 × e−6 (eV per atom), stress of 0.02 GPa and displacement of 5.0 × e−4 Å. Forces between atoms are minimized up to 0.01 eV Å−1. Electron–ion interactions are treated using Vanderbilt Ultrasoft pseudo potentials33 to calculate the ground state structural and elastic properties with a 380 eV cutoff energy. The only available Broyden–Fletcher–Goldfarb–Shanno (BFGS) minimizer is used for cell parameter optimization.34 Local-density approximation (LDA),29–31 generalized gradient approximation (GGA) of Predew–Burke–Ernzerhof (PBE),32 and Perdew–Wang 91 (PW91)31 are used as exchange correlation functionals to account for the electron–electron interactions. The Ortmann–Bechstedt–Schmidt (OBS)35 correction to PW91 is used to treat the weak van der Waals (vdW) interaction effects. Norm conserving pseudopotentials36 are used with the valance electrons of atoms such as Pb (5s2 5p6 5d10 6s2 6p2), Cs (5s2 5p6 6s1), F (2s2 2p5), O (2s2 2p4), C (2s2 2p2), K (3s2 3p6 4s1), Ca (3s2 3p6 4s2), Rb (4s2 4p6 5s1), and Sr (4s2 4p6 5s2) to calculate the BECs and zone centre vibrational frequencies of CsPbCO3F and ABCO3F (A = K, Rb; B = Ca, Sr) within the framework of density functional perturbation theory (DFPT)37 with a 1300 eV cut-off energy. It is well known that, DFPT is an efficient technique over the finite displacement method to calculate vibrational properties with lower computational times. Moreover, it allows calculation of the crystal response to the external electric field and atomic displacements.38 From these results it is possible to obtain various properties like vibrational intensities, Born effective charges etc. These DFTPT and finite element methods are framed within the harmonic approximation.38 The Monkhorst–Pack scheme41 is used to generate an 11 × 11 × 10 k-point grid with 80 irreducible k-points. A spacing of 0.02 Å−1 between k-points is used for better accuracy. The Born effective charge tensors for the compounds of present interest are obtained using a linear response method through the Gonze approximation.39 The relations between the Born effective charges and vibrational mode intensities are as follows:40 Ii = [Σj,kF|i,jAj,k]2; Ai,j = ∂E/∂qiμi. Here, A is the atomic polar tensor or Born effective charge tensor, E is the total energy, qi is the Cartesian coordinate, F| is the eigenvector, and μi is the dipole moment. The thermodynamic properties such as lattice heat capacity, Debye temperature, thermal conductivity and thermal expansion are also calculated for four iso-structural crystals (Z = 1) within the quasi-harmonic approximation. For metals at low T, the heat capacity can be represented by a sum of two terms. The electron contribution is proportional to T and the lattice contribution is proportional to T3 (this is the Debye T3 law). Thus, for metals, the Debye model can only be said to be approximate for the specific heat, but it gives a good approximation for the low temperature heat capacity of insulators and semiconductors where other contributions from highly mobile conduction electrons are absent. We computed these properties to have an overview of how these materials would behave under temperature. Our work could be a starting point and motivation for the experimental researchers in future. More details are discussed in the Results and discussion section and the Thermodynamic properties section.

3 Results and discussion

3.1 Structural, elastic and polycrystalline properties

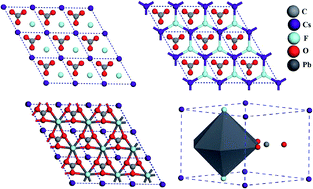
The layered non-centrosymmetric material under investigation, CsPbCO3F, crystallizes in the P[6 with combining macron]m2 (187) space group with lattice parameters of a = b = 5.3888 Å, c = 5.1071 Å, α = β = 90 (deg) and γ = 120 (deg). The unit cell consists of one formula unit (Z = 1) and the atoms Cs, C, F, Pb and O are situated at the 1a, 1d, 1e, 1f and 6m Wyckoff sites. Moreover, the reported crystal structure of CsPbCO3F is made up of alternate [Pb(CO3)] and [CsF] layers along the c-axis in the xy plane as shown in Fig. 1. The adjacent layers parallel to the c-axis are connected through F–Pb–F bonds. The iso-structural ABCO3F (A = K, Rb; B = Ca, Sr) compounds are also found to crystallise in the same P[6 with combining macron]m2 space group with a hexagonal crystal structure with Z = 1 formula units. A slight increment in the lattice parameters and volumes is noted upon changing the heavier metal atoms in these structures, which is expected.5,7 Hereafter we are naming the above mentioned 4 crystals KCaCO3F, KSrCO3F, RbSrCO3F and CsPbCO3F as KCa, KSr, RbSr and CsPb for simplicity. The atomic sites occupied by different atoms in the KCa, KSr and RbSr phases are as follows: K, K and Rb at 1a, 1e and 1c; Ca, Sr and Sr at 1b, 1f and 1f; C atoms at 1d, 1d and 1b; O atoms at 3k, 3k and 3k; and F atoms at 1a, 1e and 1e respectively. In all the crystals, the oxygen atoms are located with mm2 site symmetry, whereas all other atoms K, Rb, Ca, Sr, C, O and F occupy the [6 with combining macron]m2 site symmetry out of 5 possible site symmetries for the 187 space group. In this section we verify the effect of these different Wyckoff site occupancy's, chemical composition variations on the structural, mechanical and polycrystalline properties in a detailed manner. As a first step, to obtain the correct lattice parameters and volume, we have optimized the experimental crystal structure of CsPbCO3F using the LDA functional and GGA (by applying PBE) exchange correlation functionals as implemented in the CASTEP code. The obtained ground state structural properties, lattice parameters and volume are given in Table 1. In comparison with the experimental data, we found that the optimized volume with LDA is underestimated by 6.8%, while the PBE functional overestimates it by 4%, which is a considerable deviation from the experimental values. In order to capture the effect of the non-bonded interactions present between the adjacent layers, one needs to optimize the system with dispersion corrected schemes applied to the standard DFT methods. Since the Grimme (G06)42 corrections are not implemented for the Pb and Cs elements in the present case, we performed further structural optimizations with the PW91 functional and the (OBS) correction by Ortmann et al.35 to PW91. The obtained volumes with PW91 (see Table 1) are also overestimated by >3% before including the vdW effects and with PW91 + OBS the unit cell volume is slightly overestimated by 1% and is in relatively good agreement with experimentally reported data. Moreover, after the inclusion of vdW corrections, improvement is observed in the prediction of the lattice parameter ‘a’. Whereas, ‘c’ is well predicted before and after the vdW interactions are taken into account. The percentage of deviations in ‘a’ with the PBE, PW91 and PW91 + OBS functionals are 2.3%, 2.2% and 1.6% with respect to experimental values. With the LDA functional ‘a’ and ‘c’ are underestimated by 1.2%, and 4.5%. Overall the results of structural optimization of CsPb indicate that the OBS correction method has reproduced the experimental results more accurately. The calculated bond lengths with the OBS and PBE functionals are displayed in Table 2. We find that our calculations are in good agreement with experimental data for all of the studied compounds.
image file: c6ra20408b-f1.tif
Fig. 1 Experimental crystal structure of CsPbCO3F22 consisting of CsF and PbCO3 layers.
Table 1 Calculated ground state lattice vectors (a and c, in Å), volume (V, in Å3) of CsPbCO3F, using LDA, PBE, PW91 and dispersion corrected PW91 (PW91 + OBS) along with experimental data22
Symmetry Compound Parameter LDA PBE PW91 PW91 + OBS Experiment
    a 5.322 5.515 5.507 5.477 5.388
P[6 with combining macron]m2 CsPbCO3F c 4.876 5.059 5.046 5.011 5.107
(Z = 1)   V 119.648 133.275 132.577 130.215 128.437


Table 2 Calculated bond lengths (in Å) for the OBS and PBE theoretical equilibrium structures of CsPbCO3F and ABCO3F (where A = K or Rb; B = Ca or Sr) respectively. Experimental data for each bond is taken from ref. 5 and 22 for comparison
KCaCO3F KSrCO3F RbSrCO3F CsPbCO3F
Bond Cal Exp Bond Cal Exp Bond Cal Exp Bond Cal Exp
Ca–F 2.248 2.2276 Sr–F 2.367 2.3478 Sr–F 2.405 2.3950 Pb–F 2.481 2.5536
Ca–O 2.585 2.5552 Sr–O 2.662 2.6397 Sr–O 2.686 2.6603 Pb–O 2.717 2.7084
Ca–C 2.977 2.9426 Sr–C 3.062 3.0367 Sr–C 3.088 3.0600 Pb–C 3.122 3.1110
Ca–K 3.731 3.6907 Sr–K 3.870 3.8385 Sr–Rb 3.914 3.8858 Pb–Cs 3.988 4.0250
K–O 2.808 2.7765 K–O 2.951 2.9260 Rb–O 2.998 2.7950 Cs–O 3.080 3.1420
K–F 2.977 2.9426 K–F 3.062 3.0367 Rb–F 3.088 3.0600 Cs–F 3.122 3.1120
C–O 1.295 1.2853 C–O 1.299 1.2910 C–O 1.299 1.2960 C–O 1.296 1.2810


At a fundamental level, the material’s response to applied stress can be understood from the magnitude of the elastic constants. The bulk modulus of a material will explain the response to isotropic compression. In order to predict these fundamental mechanical equilibrium properties, which are more sensitive to lattice vectors, we have used optimized crystal structures obtained with the PW91 + OBS functional. According to the symmetry elements, for a hexagonal crystal the 36 independent elastic coefficients of a 6 × 6 tensor matrix will reduce to just 5 independent constants. These C11, C33, C44, C12 and C13 constants for the present studied hexagonal structure and the bulk modulus (B) values are calculated using the stress–strain method. The obtained single crystal mechanical properties with the OBS functional are presented in Table 3 along with the calculated values from the PBE and PW91 functionals for comparison. To the best of our knowledge there are no experimental elastic constants reported in the literature for comparison. The obtained elastic constants before and after the inclusion of vdW interactions satisfy Born's mechanical stability criteria derived for a hexagonal system.52

Cii > 0 (i = 1, 3, 4), C11 > C12, (C11 + C12)C13 > 2C132.

Table 3 Calculated single crystal elastic constants Cij and bulk modulus B (in GPa units) of CsPbCO3F for the PBE, PW91 and PW91 + OBS theoretical equilibrium volumes
Method Functional C11 C33 C44 C12 C13 B
DFT PBE 63.0 71.9 15.7 34.9 24.0 40.4
DFT PW91 67.1 71.3 15.6 37.3 22.0 40.7
vdW PW91 + OBS 70.2 80.2 16.3 31.8 22.4 41.5


CsPb obeys this criteria, confirming its good mechanical stability. The variations in the calculated elastic constants with the PBE, PW91 and PW91 + OBS functionals are related to the differences in their optimized lattice parameters with each functional as shown in Table 1. Strong anisotropy for the externally applied strain along the ‘a’ and ‘c’ crystallographic directions is observed from the C11 and C33 values (see Table 3). The relation C33 > C11 from the calculated results indicates that the crystal is more compressible along the a-axis direction than the c-axis for the applied strains. This effect arise due to weak bonding interactions between the CO3 and lead atoms (Pb–O) than the interlayer ionic interactions through the F–Pb–F bonds. The bond lengths of (Pb–O) > (Pb–F) also confirming this (see Table 2). The huge differences in the calculated elastic constants C11 and C33 with DFT and vdW (7.3 GPa; 9 GPa) also indicate that the accurate prediction of interactions between (CO3 and Pb) and adjacent CsF and PbCO3 layers plays an important role in explaining the crystal stability. The obtained bulk modulus values with and without the vdW effect, 40 GPa & 41.5 GPa respectively, indicate that CsPbCO3F is a soft material among all the ABCO3F (where A = K, Rb or Cs; B = Ca or Sr) carbonate fluoride crystals and is harder than the well-known KH2PO4 (KDP) crystal (27 GPa)53 and α-SiO2 (38 GPa)53 and softer than the β-BaB2O4 (BBO) crystal (60 GPa).53 In comparison with our previous study,7 we noticed that the presence of a heavy metal Pb atom in its isostructures like CsCaCO3F (51.1 GPa), KSrCO3F (47.1 GPa), KCaCO3F (53.7 GPa), RbSrCO3F (46.4 GPa) and RbCaCO3F (52.0 GPa) further reduced the hardness of the material by 22%, 13.5%, 22.7%, 11.8% and 25.3% respectively due to the increase in the atomic radii. The hardness of the studied carbonate fluoride materials follows the trend:

KCaCO3F > RbCaCO3F > CsCaCO3F > KSrCO3F > RbSrCO3F > CsPbCO3F;

The occurrence of carbonate materials in alkaline rock complexes and their availability in powder forms and different size crystals at laboratory scales motivated us to also focus on their polycrystalline properties.14 Since nonlinear optical materials are subjected to high power lasers for various applications like in high power nonlinear optical devices and frequency conversion applications,53 it is worth knowing their polycrystalline properties. We made an attempt to calculate different polycrystalline properties such as the bulk modulus, shear modulus, Young's modulus, Poisson's ratio, shear anisotropy factors and elastic-Debye temperature from the single crystal elastic constant data. Initially, we have calculated the bulk (BX) and shear (GX) moduli of CsPbCO3F with the Voigt (BV, GV), Reuss (BR, GR) and Hill (BH, GH) approximations24–26 using the single crystal elastic constants. The average of the obtained values from the Voigt and Reuss methods are taken as the suitable polycrystalline values as suggested by Hill for hexagonal symmetry.43,44,47 We have also calculated similar properties of other iso-structural compounds ABCO3F (A = K, Rb; B = Ca, Sr) of lead carbonate fluoride based on the reported single crystal elastic constants from our previous work, Narsimha Rao et al.7 The obtained results are compared and shown in Table 3.

It is clear from the results that the upper and lower limits of the bulk moduli (BV, BR) are found to be almost similar for the studied materials, whereas the results (Table 4) show considerable variations. Moreover, it is observed that BH > GH, which indicates that the mechanical stability of the studied compounds is limited largely by the shear moduli. KCa has a large GH value, whereas CsPb has the lowest value among the studied carbonates. This indicates that the bond restoring energy for the applied elastic shear strain is decreasing with an increase in the atomic number of the metal atoms in the studied carbonates. In addition, according to the Pugh criterion45,46 the calculated BH/GH ratios > 1.75 indicates the ductile nature of the studied crystals, with the exception of KCa (1.67) which is brittle in nature. It was found that the ductile nature of the studied materials increases with an increase in the atomic radii of the metal atoms. This behaviour is accompanied by the diversity present in the values of the calculated elastic constants. Overall, the Hills approximation of the bulk modulus also confirms that CsPb is the softest material among all the carbonate materials. As a next step, we verified the resistance of the studied materials to the applied uni-axial tensions and stability against the shear strain thereby calculating Young's modulus (E) and Poisson's ratio (σ),47 where E = 9GB/(G + 3B) and σ = (E/2G) − 1. It is well known that the magnitude of the Poisson's ratio is 0.1 for covalent and 0.25 for ionic materials.48 In the present study, the obtained σ values (0.25) point to the mixed ionic–covalent nature of the studied carbonates. From another point of view, it is known that when the magnitude of σ is 0.5 no change in volume occurs. From the obtained results as shown in Table 4, it is clear that a large volume change can occur with elastic deformation of the studied crystals and it is relatively greater for the CsPb crystal than the other carbonates. Overall the change in volume against the applied uni-axial strain in the studied layered materials increases with the metal atom’s atomic radii from K to Sr and Sr to Pb. These observations are consistent with the calculated anisotropy factors.

Table 4 The calculated bulk (BX) and shear moduli (GX) values using the Voigt, Reuss and Hill approximations (X = V, R, H). Also listed are the Poisson's ratio σ and BH/GH ratio. All values are calculated at the corresponding theoretical equilibrium volumes
Compound BV BR BH GV GR GH σ BH/GH
KCaCO3F 53.7 53.8 53.8 33.2 31.1 32.1 0.25 1.67
KSrCO3F 47.0 47.0 47.0 28.1 23.6 25.9 0.26 1.81
RbSrCO3F 46.5 46.5 46.5 25.8 23.6 25.9 0.26 1.79
CsPbCO3F 41.5 41.7 41.6 19.9 19.1 19.5 0.29 2.13


Secondly, three shear anisotropy factors, A1, A2 and A3, and the elastic Debye temperature, ΘD, for the studied hexagonal materials at crystal density ρ (ref. 49 and 50) are also calculated and analyzed. Where A1 = 2C44/(C11C12); A2 = C33/C11; A3 = C12/C13. The obtained values are presented in Table 5 along with c/a ratios. It is observed that the calculated c/a ratios of the studied crystals show increments with the metal atom’s atomic radii. It is clear from the results that all three anisotropy factors show considerable deviation from unity. This indicates that all the studied crystals possess large mechanical anisotropy. For the studied carbonates, the anisotropy factor A1 increased from about 0.4–0.8 and A2 shows an almost constant value of 1.1 whereas A3 shows a decreasing trend from about 1.7–1.2. This is consistent with the obtained decreasing trend of hardness (bulk modulus) of the studied materials upon insertion of heavier metal atoms. This behaviour might be arising due to the variations of inter-layer interactions in the (CO3 and metal atom) layer and intra-layer interactions between the (CO3 and metal atom) and K/Rb/Cs–F adjacent layers. Moreover, the decreasing trend of C11 from KCaCO3F → KSrCO3F → RbSrCO3F → CsPbCO3F indicates that bonding between the CO3 group and metal atoms is becoming more ionic in nature. The increasing trend of C33 from CsPbCO3F → RbSrCO3F → KSrCO3F → KCaCO3F indicates that the interactions between alternate layers are strengthened. As a next step, we have moved onto the elastic Debye temperature calculations. It is well known that the Debye temperature is a limit, below which the lattice shows stability mainly due to low electron phonon-coupling. Since at lower temperatures this quantity arises purely because of lattice modes, we made an attempt to calculate the elastic Debye temperatures of the carbonate crystals based on the relations given in ref. 51 between the Young's modulus, shear modulus, bulk modulus and crystal density ρ, and the results are presented in Table 5. The results shows that ΘD decreases from KCa (479.7 K) to KSr (385.6 K) to RbSr (350.4 K) to CsPb (239.8 K). This trend suggests that the melting point is low for lead carbonate fluoride and high for KCa. Since these crystals are newly synthesised, there are no experimental data available in the literature for the above calculated properties. We expect that our simulated results will be helpful as a reference for engineers in the selection of the studied materials for real time applications.

Table 5 Calculated values of the c/a ratio, shear anisotropy factors (Ai) (i = 1, 2, 3), Young's modulus (E), crystal density (ρ) and elastic-Debye temperature (ΘD) at the theoretical equilibrium volumes
Compound c/a A3 A2 A3 E ρ ΘD
KCaCO3F 0.869 0.6 1.1 1.3 80.4 2.538 479.7
KSrCO3F 0.892 0.4 1.1 1.7 65.6 2.935 385.6
RbSrCO3F 0.900 0.6 1.0 1.2 65.5 3.464 350.4
CsPbCO3F 0.914 0.8 1.1 1.4 50.6 5.345 239.8


3.2 Born effective charges (BEC) and static polarization

The Born effective charge (BEC or, Z*) is a fundamental quantity that demonstrates the coupling between electrostatic fields and lattice displacements. In order to explore more about the structural distortion, covalent and ionic bonding nature and local dipole moments and resulting polarization54–57 of the present NLO crystals of interest, we have computed the BEC's of all non-equivalent ions using linear response formalism as implemented in the CASTEP code. The obtained results are shown in Tables 6 and 8. The corresponding percentage of deviations from the corresponding nominal ionic charges are shown in Tables 7 and 9. The obtained results satisfy the acoustic sum rule, image file: c6ra20408b-t1.tif which in turn indicates good convergence of our calculations.59 Moreover, it is known that the BEC tensors obtained using a linear-response and Berry's phase approach will be at the same level of accuracy.58 The obtained large deviations in the Born effective charges from its nominal ionic charge indicates that these studied crystals possess covalent–ionic behaviour. The BECs of CsPbCO3F show larger deviations when compared to other crystals studied which also confirms that lead carbonate fluoride shows a more covalent nature. Moreover, BEC values are found to be highly direction dependent for the studied hexagonal structures which belong to the P[6 with combining macron]m2 space group. The diagonal elements of the BEC tensors at carbon, fluorine, potassium, strontium and lead follow the relation image file: c6ra20408b-t2.tif. Whereas at the oxygen atoms, the effective charges are more asymmetric and follow the relation image file: c6ra20408b-t3.tif. We compared the BEC tensors of CsPbCO3F with the previously reported values by Thao Tran et al.,9 and the results were found to be similar.
Table 6 Calculated BECs of the Pb, Ca, Sr, F, Cs, Rb, K and C atoms at the theoretical equilibrium volumes along with previously reported9 values in parentheses
Atom Ionic KCaCO3F KSrCO3F RbSrCO3F CsPbCO3F

image file: c6ra20408b-t8.tif

image file: c6ra20408b-t9.tif

image file: c6ra20408b-t10.tif

image file: c6ra20408b-t11.tif

image file: c6ra20408b-t12.tif

image file: c6ra20408b-t13.tif

image file: c6ra20408b-t14.tif

image file: c6ra20408b-t15.tif

Ca, Sr, Pb +2 2.42 2.31 2.43 2.36 2.47 2.37 3.63(3.7) 3.17(3.0)
F −1 −0.94 −1.73 −0.91 −1.81 −0.98 −1.76 −0.87(−0.9) −2.90(−2.9)
Cs, Rb, K +1 1.15 1.30 1.18 1.29 1.20 1.40 1.28(1.3) 1.56(1.5)
C +4 2.86 0.14 2.86 0.10 2.97 0.06 2.87(2.8) 0.05(0.04)


Table 7 Calculated percentage of deviations of BECs of the Pb, Ca, Sr, F, Cs, Rb, K and C atoms at the theoretical equilibrium volumes
Atom KCaCO3F KSrCO3F RbSrCO3F CsPbCO3F

image file: c6ra20408b-t16.tif

image file: c6ra20408b-t17.tif

image file: c6ra20408b-t18.tif

image file: c6ra20408b-t19.tif

image file: c6ra20408b-t20.tif

image file: c6ra20408b-t21.tif

image file: c6ra20408b-t22.tif

image file: c6ra20408b-t23.tif

Ca, Sr, Pb 21.05 15.65 21.75 18.15 23.6 18.95 81 58.6
F −5.7 73.6 −8.2 81.8 −2 75.9 −12.7 190.5
Cs, Rb, K 15.6 30.3 17.8 29.4 20.7 40.6 28.3 56.6
C −28.5 −96.4 −28.42 −97.47 74.25 −98.52 −28.27 −98.65


Table 8 Calculated BECs of the O1, O2 and O3 atoms (which have a nominal ionic charge of −2) at the theoretical equilibrium volumes
KCaCO3F KSrCO3F RbSrCO3F CsPbCO3F

image file: c6ra20408b-t24.tif

image file: c6ra20408b-t25.tif

image file: c6ra20408b-t26.tif

image file: c6ra20408b-t27.tif

image file: c6ra20408b-t28.tif

image file: c6ra20408b-t29.tif

image file: c6ra20408b-t30.tif

image file: c6ra20408b-t31.tif

image file: c6ra20408b-t32.tif

image file: c6ra20408b-t33.tif

image file: c6ra20408b-t34.tif

image file: c6ra20408b-t35.tif

−1.61 −2.04 −0.67 −2.27 −1.43 −0.64 −1.66 −2.11 −0.69 −2.24(−2.3) −2.36 −0.62 (−0.6)
−2.26 −1.39 −0.67 −1.64 −2.06 −0.64 −2.34 −1.43 −0.69 −2.43(−2.3) −2.17 −0.62 (−0.6)
−1.61 −2.04 −0.67 −1.64 −2.06 −0.64 −1.66 −2.11 −0.69 −2.24(−2.3) −2.36 −0.62 (−0.6)


Table 9 Calculated percentage of deviations of BECs of the O1, O2 and O3 atoms from their nominal ionic charge of −2
KCaCO3F KSrCO3F RbSrCO3F CsPbCO3F

image file: c6ra20408b-t36.tif

image file: c6ra20408b-t37.tif

image file: c6ra20408b-t38.tif

image file: c6ra20408b-t39.tif

image file: c6ra20408b-t40.tif

image file: c6ra20408b-t41.tif

image file: c6ra20408b-t42.tif

image file: c6ra20408b-t43.tif

image file: c6ra20408b-t44.tif

image file: c6ra20408b-t45.tif

image file: c6ra20408b-t46.tif

image file: c6ra20408b-t47.tif

−19.5 2 66.5 13.5 −28.5 −68 −17 5.5 65.5 12 18 −69
13 −30.5 66.5 −18 3 −68 +17 −28.5 65.5 21.5 8.5 −69
−19.5 2 66.5 −18 3 −68 −17 5.5 65.5 12 18 −69


More specifically, the charge anisotropy ‘around metal atoms’ shows increments from Ca → Sr → Pb and it was found that image file: c6ra20408b-t4.tif. This informs us that the covalent nature of these crystals is increased drastically upon increasing the atomic size of the metal atom in the carbonate fluoride crystals. However, it is more along the ‘a’ direction (the bond between metal–oxygen atoms of carbonate group (inter -layer interactions)) bond than along the ‘c’ (metal–fluorine bond between adjacent layers (intra-layer interactions)) direction. In case of the CsPb compound these image file: c6ra20408b-t5.tif and image file: c6ra20408b-t6.tif anisotropies around the metal atoms are found to be ∼60% and ∼30% higher when compared with other KCa, KSr and RbSr crystals. The charge anisotropy ‘around fluorine atoms’ in all the studied crystals along the ‘a’ axis is increased as follows RbSr → KCa → KSr → CsPb. It is clear from the calculated data (as shown in Table 6), that the BEC of the fluorine atom for the studied materials is deviated from its ionic charge −1 as follows: along the a-axis → CsPb (−0.87) < KSr (−0.91) < KCa (−0.94) < RbSr (−0.98); along the c-axis → CsPb (−2.90) > KSr (−1.81) > RbSr (−1.76) > KCa (−1.73). This confirms that the ionic nature of the fluorine bond with Rb, K, K and Cs in the RbSr, KCa, KSr and CsPb compounds increased. Whereas in the ‘c’ direction, anisotropy of fluorine increased from KCa → RbSr → KSr → CsPb. This indicates that the bond between fluorine and Ca (in KCa), Sr (in RbSr), Sr (in KSr) and Pb in (CsPb) is becoming more covalent in nature. Especially in the CsPb phase, the deviation of charge from its ionic value increases along the ‘a’ and ‘c’ directions approximately by 4% and 100% compared with the other KCa, RbSr, KSr phases. The BECs of the O1, O2 and O3 oxygen atoms in all the studied crystals show more or less similar deviation when compared to their nominal ionic charge of −2. This confirms the strong covalent bonding behaviour between the carbon and oxygen atoms inside the anionic group. Overall, it has been found that the BEC values are strongly affected by a change in atoms at the A and B site in ABCO3F (where A = K, Rb or Cs and B = Ca, Sr or Pb) and the atomic bonds associated with them.

3.3 Vibrational modes and symmetry analysis

Study of the fundamental vibrational properties of functional groups present in the crystal plays a crucial role in understanding the structure details and inter-molecular interactions in the low energy region. In this section we present the zone centre vibrational frequencies of CsPbCO3F and three other isostructural compounds’ ABCO3F (A = K or Rb; B = Ca or Sr) crystals. The mode assignments of all the obtained frequencies are analyzed and are shown in Tables 10 and 11. All of these four iso-structural compounds crystallize in the P[6 with combining macron]m2 space group, having a single formula unit (7 atoms per cell). According to the symmetry rules for the D3h ([6 with combining macron]m2) point group, the atoms of CsPbCO3F and KSrCO3F compounds are occupying the Wyckoff positions as (Pb, Sr)-1f, F-1e and (Cs, K)-1a, C-1d, O-3k. A slightly different atomic configuration in the case of KCaCO3F is K-1e, Ca-1b, F-1a, C-1d and O-3k positions and for RbSrCO3F the atoms are situated at the Sr-1f, Rb-1c, F-1e, C-1b and O-3k sites. According to the symmetry group theory analysis,60 the distribution of 3 acoustic (external) and 18 optical (internal) possible vibrational modes for these sets of compounds are as follows:
Γacoustic = A′′2 ⊕ E′

Γoptic = A′1 ⊕ A′2 ⊕ 4A′′2 ⊕ 5E′ ⊕ E′′
Table 10 The calculated zone-center high frequency vibrational modes (in cm−1) of CsPbCO3F and ABCO3F (where A = K or Rb; B = Ca or Sr) and their assignments [here I = IR active mode, R = Raman active mode]. Experimentally reported frequencies are given in parentheses5
Mode CsPbCO3F RbSrCO3F KSrCO3F KCaCO3F Symmetry
M21–M20 1379.70(1407) 1396.05 1396.68 1422.84 E′ (I + R)
M19 1038.39(1049) 1034.91 1032.89 1053.59 A′1 (R)
M18 821.06(843) 834.74 835.83 834.78 A′′2 (I)
M17–M16 665.89(689) 676.78 676.94 682.94 E′ (I + R)


Table 11 The calculated zone-center low frequency vibrational modes of CsPbCO3F and ABCO3F (where A = K or Rb; B = Ca or Sr) and their mode assignments [here Trans. = translation, Asymm. = asymmetric and str. = stretching]
Compound Mode PBE Symmetry Assignment of modes
KCaCO3F M15 372.86 A′′2 (I) Asymm. str. mode of Ca–F
M14 187.82 A′′2 (I) Trans. of (CO3), Trans. of (Ca–F)
M13–M12 173.86 E′ (I + R) Symm. bending of (Ca–F), Trans. of (CO3)
M11 158.41 A′′2 (I) Trans. of (K, CO3)
M10–M09 157.27 E′ (I + R) Trans. of (CO3, K), Symm. bending of (Ca–F)
M08–M07 150.67 E′′ (R) Libration of (CO3)
M06–M05 114.07 E′ (I + R) Symm. bending of (Ca–F), Trans. of (K)
M04 98.12 A′2 (silent) Rotation of CO3
KSrCO3F M15 346.32 A′′2 (I) Asymm. str. mode of Sr–F
M14 175.77 A′2 (silent) Rotation of CO3
M13–M12 173.09 E′ (I + R) Trans. of (CO3), symmetric bending of (Sr–F)
M11 136.06 A′′2 (I) Rot. mode of CO3 group
M10–M09 115.33 E′ (I + R) Trans. of (CO3, K), symmetric bending of (Sr–F)
M08–M07 112.37 E′′ (R) Libration of (CO3)
M06 96.15 A′′2 (I) Trans. of (CO3, K)
M05–M04 62.63 E′ (I + R) Trans. of (F), Symm. bending of (Sr–F)
RbSrCO3F M15 306.20 A′′2 (I) Asymm. str. mode of Sr–F
M14–M13 162.54 E′ (I + R) Trans. of CO3 group, Symm. bending of (Sr–F)
M12 161.71 A′2 (silent) Rotation of CO3
M11 131.09 A′′2 (I) Trans. of CO3 group, Asymm. str. of (Sr–F)
M10–M09 126.58 E′ (I + R) Symm. bending of (Sr–F)
M08–M07 118.91 E′′ (R) Libration of (CO3)
M06 99.00 A′′2 (I) Trans. of (CO3, Rb)
M05–M04 81.32 E′ (I + R) Trans. of (CO3, Rb), Symm. bending of (Sr–F)
CsPbCO3F M15–M14 177.53 E′′ (R) Libration mode of CO3
M13 158.38 A′′2 (I) Trans. mode of (CO3, Cs) + Asymm. str. (Pb–F)
M12 145.61 A′′2 (I) Asymm. str. of (Pb–F)
M11 106.75 A′2 (silent) Rot. mode of CO3
M10–M09 87.26 E′ (I + R) Trans. of (CO3, Cs) + Symm. bending of Pb–F
M08 81.16 A′′2 (I) Trans. of (CO3, Cs), Asymm. str. (Pb–F)
M07–M06 65.77 E′ (I + R) Trans. of Cs, Symm. bending of (Pb–F)
M05–M04 43.10 E′ (I + R) Symm. bending of (Pb–F), Trans. of CO3


The calculated 21 frequency modes from the present study are in good agreement with the above mentioned group theory representations for all the crystals. Apart from the 3 acoustic modes, among the 18 possible optical modes we observe that four modes (A′′2) are infra-red (I) active, three modes (E′′, A′1) are Raman (R) active, and 10 modes (E′) are combined infra-red + Raman active (I + R). Interestingly one silent mode is observed with A′2 symmetry from our results for all the compounds. A negligible change in polarization and dipole moment due to the CO3 rotational mode (see Fig. 3) could be the possible origin. However, according to group theory analysis this mode is found to be active only in the hyper-Raman region.


image file: c6ra20408b-f2.tif
Fig. 2 Calculated zone center vibrational (IR) spectra in the far-IR, mid-IR, near IR regions of CsPbCO3F and ABCO3F (where A = K, or Rb; B = Ca or Sr) (from left to right) structures at theoretical equilibrium.

image file: c6ra20408b-f3.tif
Fig. 3 Snapshots of different vibrational mode animations of carbonate fluoride materials.

The calculated modes in the ‘higher frequency region’ (>600 cm−1) are in good agreement with the available experimental data as shown in Table 10. These modes arise due to the vibration of the CO3 unit alone for all the studied compounds. The vibrations of the CO3 unit observed based on animations and in reference to the previous reports61,62 are assigned as follows: the frequency mode between 660 and 690 cm−1 corresponds to doubly degenerate asymmetric in-plane bending; between 820 and 840 cm−1 is due to symmetric out-of-plane bending; between 1030 and 1060 cm−1 is because of symmetric stretching (breathing mode); between 1370 and 1430 cm−1 is due to doubly degenerate asymmetric stretching. Further, in the ‘lower frequency region’ (<400 cm−1), vibrational modes for all the present investigated compounds mainly arise from librational, translational, rotational motions of the CO3 group and stretching and bending motions of the metal atom (M)–F (where M = Ca, Sr or Pb) bonds (see Fig. 3). Whereas in the ‘mid frequency region’, in contrast with the experimental results,22 we do not observe any Pb–F vibrational mode at 407 cm−1 in the case of CsPbCO3F. It is clear from Fig. 2 that the 407 cm−1 mode is further shifted to the lower frequency side. The larger values of BEC suggests that the presence of dominant LO-TO splitting might be the possible reason for this discrepancy. The low frequency mode assignments are analyzed as shown in Table 11 and it is found that at least one silent mode is observed for every studied compound. Snapshots of all these CO3 vibrations are shown in Fig. 3 for further reference.

It is observed from the calculated IR spectra that all peaks (from 1–8), as shown in Fig. 2, are red shifted with an increase in the atomic number. The changes in intensity of the different frequencies are attributed to variation in the probability of vibrational transition occurrence from the ground state to the exited states. Due to the same symmetry of the studied crystals, an equal number of absorption peaks (8) are found to occur in the spectra. As a starting point we analyzed the reasons for the frequency shifts and the origin of the intensity variations will be discussed based on the obtained BECs later.

In the higher frequency region (>600 cm−1), the peak number 8 (I + R mode) corresponding to the asymmetric vibration of the CO3 group is red-shifted considerably from KCa to RbSr to CsPb with a slight variation in the intensity. Whereas in case of KSr and RbSr the peak position is almost constant. The existence of directional bonding (covalent/ionic) interactions between the anionic group and metal atoms, causes this frequency shift due to increasing the atomic mass of metal atoms. From Tables 6 and 8 it is clear that anisotropy in the BECs of the carbon and oxygen atoms is almost constant for KCa and KSr and similarly for RbSr and CsPb. This manifests as similar intensities of peak 8 for the (KCa and KSr) and (RbSr and CsPb) compounds. A slight increment in intensity from KCa and KSr → RbSr and CsPb is attributed due to differences in the carbon and oxygen BEC deviations from their respective nominal ionic charges. In addition, the obtained trends in bond lengths between the metal atom and oxygen atoms (Pb–O) > (Sr–O) > (Ca–O) suggests that bending of CO3 in CsPb occurs at lower frequencies than the other studied crystals. This could be the possible reason behind the soft nature (41.6 GPa) of CsPb compared with KCa (53.8 GPa). Moreover, KSr and RbSr possess almost similar hardness (47.0 GPa and 46.5 GPa) due to similar Sr–O interactions.

The position and intensity of peak number 7 (IR active) which arises from symmetric bending of the CO3 group, is almost constant for all the studied crystals and in turn suggests that the IR absorption of this mode is less affected with respect to the atomic number of the metal atoms. Peak 6 which is active in the infra-red and Raman regions, arises due to the asymmetric in-plane bending mode of CO3. This peak shows less shift in peak position but a huge intensity increase in the case of lead carbonate fluoride compared to the other carbonates. This can be due to the larger change in BECs of both the ‘C’ and ‘O’ atoms of lead carbonate fluoride in the xy-plane image file: c6ra20408b-t7.tif than other studied crystals. The different effective charges of the C and O atoms in the lead carbonate material makes CO3 more polarizable. Peak 5 (IR active mode) corresponds to the asymmetric stretching mode of the Ca–F and Sr–F bonds and is red shifted with a constant intensity from KCa → KSr → RbSr. Interestingly, no peak corresponding to the Pb–F bond is observed in this region as reported in the literature. The reason for this shift is attributed to the different bond lengths of Ca–F (2.248 Å) in KCa, Sr–F (2.367 Å) in KSr and Sr–F (2.405 Å) in RbSr.

In the lower frequency range (below 200 cm−1), the spread of the vibrational spectrum is different for each of the studied carbonates as shown in Fig. 2. Even though compounds from KSrCO3F to CsPbCO3F are iso-structural, their IR spectra below 200 cm−1 are very different and frequencies are equally spread over the region between 50–200 cm−1. Whereas in case of KCaCO3F it is between 100 and 200 cm−1 and for RbSrCO3F lies in-between 75 and 175 cm−1. It is observed from Table 11 that the highest intensity mode in this region (see Fig. 2) arises due to the combination of symmetric bending of the Ca/Sr/Pb–F bond and translation of the CO3 group. In the cases of KCaCO3F, KSrCO3F and RbSrCO3F the position of this highest intensity peak is almost constant but for lead carbonate fluoride it was red-shifted due to the heavier mass of the lead atom. In the lower frequency window, the higher intensity modes, peaks 5 and 3 in KCa, peaks 4 and 5 in KSr, and peaks 5, 4 and 3 in RbSr are mainly found to arise because of Ca–F, Sr–F and Pb–F vibrations along with CO3 vibrations. The intensities of the remaining optical modes in this window are found to be higher for the CsPbCO3F compound which also confirms the effect of higher BECs.

Overall, higher intensities for all the IR modes of lead carbonate fluoride are observed, suggesting that it is a more optically active material in the IR region than the other studied carbonates. The contribution from the CO3 group vibrations (peaks 6 and 8) in the near IR region to the optical response is greater in the case of CsPb than others. Our results show a similar trend and give a hint about the different optical responses of carbonate fluorides for the same incident light of 1064 nm which was reported in the literature5,22 as 13.6, 3.61, 3.33 and 3.33 higher nonlinear coefficients than the well-known KDP crystal.

3.4 Thermodynamic properties

Investigation of the thermal behaviour of a nonlinear optical material is important in expanding knowledge about crystal growth issues, solid state physics and chemistry, crystal chemistry and its possible practical applications.64 It is known that thermal expansion of the crystal can lead to changes in the shape/dimension of the sample and specific heat can impact the damage threshold thereby limiting the use of the material for industrial applications. Information about the thermal conductivity of a NLO material is very useful in determining its ability to transfer heat into the air thereby affecting the quality of the output beam.53,63 So we made an attempt to calculate the thermodynamic properties of the present novel carbonate fluoride materials. Here we apply the quasi-harmonic Debye model,65 in which the Gibbs free energy (G) of the system takes the following form G(V,P,T) = E(V) + PV − TS where E(V) is the total energy, V is the volume and S is the entropy of the system. Since the electronic structure calculations are performed in the static approximation, i.e., at T = 0 K and neglecting zero-point vibrational effects, the corresponding Gibbs free energy in this case becomes Gstat(V,P) = E(V) + PV which is the enthalpy, H, of the system. According to this quasi-harmonic Debye model, the non-equilibrium Gibbs free energy function is given by G(V,P,T) = E(V) + PV + Avib(Θ(V), T). Where Θ(V) is the Debye temperature, PV indicates the constant hydrostatic pressure condition and Avib is the vibrational Helmholtz free energy.65 The heat capacity (CV), entropy (SV) and vibrational internal energy (Uvib) are calculated using the following relations: CV = 3nk[4D(Θ/T) − (3(Θ/T)/(e(Θ/T) − 1))]
SV = nk[4D(Θ/T) − 3[thin space (1/6-em)]ln(1 − e(Θ/T))]

Uvib = nkT[(9/8)(Θ/T) + 3D(Θ/T)]

The Debye temperature is the highest temperature that can be achieved due to a single normal mode of a solid. Its magnitude varies from material to material based on the lattice vibrations. It is a fundamental parameter which correlates with many physical properties of solids, such as entropy, specific heat, thermal expansion and thermal conductivity. Since the Debye temperature shows strong temperature dependence, we have calculated this dependence up to a temperature of 1000 K as shown in Fig. 4. Entropy is a measure of uncertainty in the energy associated with the random arrangement and thermal motion of the atoms. As the temperature increases, the vibrational contribution to the entropy increases and, in turn, entropy increases. For the present studied crystals (see Fig. 4), the plots indicate a slight change in entropy which could be due to the change in atomic arrangements (Wyckoff positions) and with atomic masses. It is observed that CsPb shows higher entropy where as KCa shows a lower entropy response. In the cases of KSr and RbSr, the entropy is almost constant. It is well known that as the temperature rises the contribution of phonons becomes more and more important and one can calculate the free energy, F = UTS, where U is the vibrational internal energy which contains the static energy and the phonon contribution and S is the entropy which is completely due to phonons and is shown in Fig. 4. The calculated free energy of all the studied crystals decreases with the increase in temperature. This behaviour is due to the fact that both vibrational internal energy U and entropy S increase with temperature and this leads to a decrease in the free energy. The studied systems are found to be thermodynamically stable below 1000 K. We have calculated the coefficient of thermal expansion using the relation α = (γCV)/(BV) where B, V and CV are the isothermal bulk modulus, unit formula volume and specific heat at constant volume respectively and γ is the Gruneisen parameter calculated on the basis of a rigid ion model.66


image file: c6ra20408b-f4.tif
Fig. 4 Calculated thermodynamic properties including enthalpy (H), free energy (F), entropy (SV), heat capacity (CV) and Debye temperature Θ(V) of carbonate structures at theoretical equilibrium up to 1000 K temperature.

The thermal expansion coefficient is proportional to the specific heat and both the properties exhibit the same temperature dependence. The specific heat and thermal expansion coefficient increase as T3 at low temperatures and gradually approach a linear increase at high temperatures, and then the increasing trend becomes gentler. Specific heat and thermal expansion reach a constant value at high temperature as shown in Fig. 4 and 5. It is to be noted from the results that the lead carbonate material has the lowest thermal expansion coefficient of 2.577 × 10⁻⁶/K compared with α-SiO2, LiNbO3, CaCO3 (calcite) and the ABCO3F (A = K, Rb; B = Ca, Sr) carbonates as shown in Table 12. In comparison with other studied carbonate fluoride crystals, it is observed that the α value decreases with an increase in atomic number. This could be due to the strengthened atomic bonds in CsPb.


image file: c6ra20408b-f5.tif
Fig. 5 Calculated thermal conductivity (K) and thermal expansion (α) coefficients of carbonate structures at theoretical equilibrium. The K and α curves of KSr and RbSr are shifted upwards by 1 W m−1 K−1 and 0.5 (10−6/K) from the preceding curve for clarity.
Table 12 The calculated thermal conductivities k (W m−1 K−1) and thermal expansion coefficients α (10−6/K) of carbonate fluorides at room temperature along with data from other hexagonal NLO materials
Material k α
Present
CsPbCO3F 32.430 2.577
RbSrCO3F 2.634 2.786
KSrCO3F 1.584 2.877
KCaCO3F 0.488 3.178
[thin space (1/6-em)]
Previous53
Ba3B6O12 4.0, 36.0 1.2, 1.6
α-SiO2 12.38, 6.88 6.2, 10.4
LiNbO3 15.4, 5.3 5.4, 5.3
CaCO3 −3.7, 25.1 4.5, 5.4


Thermal conductivity (K) plays a critical role in controlling the performance and stability of materials and is one of the fundamental and important physical parameters of materials. It is a critically important parameter in the design of high-power nonlinear optical (NLO) devices such as frequency doublers and optical parametric oscillators (OPO's). On a more fundamental level, the study of the underlying physics of the heat-conduction process has provided a deep and detailed understanding of the nature of lattice vibrations in solids.67 The thermal conductivity for the present nonlinear optical crystals is calculated using a phonon relaxation time method.68 An important postulate is that if the material is pure then the term accounting for strong defect scattering will be negligible compared to the term for phonon–phonon scattering, so that thermal conductivity k = (KB2/2π2ħνs)(ΘD/CT).

The thermal conductivity of the NLO materials was calculated following the work of Callaway and Baeyer.68 The thermal conductivity as a function of temperature for CsPb and other carbonate materials is graphically represented in Fig. 5. It is clear from the plots that the increase in conductivity is initially rapid and reached a constant at higher temperatures. This effect is more pronounced in lead carbonate fluoride than the other studied crystals which gives more of a hint about the possible longest phonon mean free path than in the other crystals.53 The thermal conductivity decreases with temperature due to the fact that the molecular vibrational densities increase with temperature. The obtained ‘K’ values for the KCa, KSr, RbSr and CsPb crystals at room temperatures are 0.0048 W cm−1 K−1, 0.0158 W cm−1 K−1, 0.0263 W cm−1 K−1 and 0.032 W cm−1 K−1. These values are consistent with the experimental observations for other NLO materials.53,63 All the obtained values along with known values of hexagonal NLO materials are tabulated in Table 12 for better comparison. Importantly, the predicted thermal conductivity of the lead material at room temperature is 0.032 W cm−1 K−1 which is greater than the earlier reported thermal conductivity values for Ba3B6O12 which is 0.016 W cm−1 K−1 (ref. 63) and other hexagonal NLO materials.53 Moreover, it shows the largest ‘K’ value among all the studied carbonates. This information tells us that CsPb has better durability than BBO and other carbonate materials. Moreover it is well known that nonlinear media must have sufficiently high thermal conductivities to get better average power outputs in the devices. Present thermal conductivity results clearly infer that the lead based carbonate could be the best suited NLO material, thereby overtaking the other carbonates and borates. We were not able to compare our results due to a lack of experimental and theoretical data as our work is the first to calculate these properties of carbonate fluoride crystals. These results could provide necessary input for the design of high-power optical frequency converters in the near future.

4 Conclusions

In conclusion, we have studied the effect van der Waals (vdW) interactions on the structural properties of CsPbCO3F by means of density functional theory. The calculated structural properties using a semi-empirical dispersion correction scheme (PW91 + OBS) to treat the van der Waals interactions are found to be in good agreement with the experimental values which indirectly suggests the important role of van der Waals forces in this crystal. In addition, we have also calculated the zone center vibrational frequencies of CsPbCO3F and ABCO3F (A = K, Rb; B = Ca, Sr) with a density functional perturbation theory (DFPT) approach and the obtained high frequency modes are in good agreement with the available experimental values. All mode assignments were performed and at least one silent mode was observed in the case of all the studied crystals. This mode arises due to a rotation of CO3 group and is found to be active only in the hyper-Raman region from group theory analysis. The variations in vibrational mode intensities and optical activity of the studied crystals are broadly analyzed from the obtained Born Effective Charge (BEC) tensor values. We have also calculated the thermodynamic properties such as enthalpy, free energy, entropy, heat capacity, Debye temperature, thermal conductivity and thermal expansion. The room temperature values of heat capacity, thermal expansion and thermal conductivity for all studied NLO materials are different, their overall temperature dependence is very similar. This indicates that all the compounds are characterized by rather similar lattice dynamical and thermal properties. We believe this work sheds light on the (NLO) material CsPbCO3F as it could be a promising NLO material in near future.

Acknowledgements

ENR would like to thank the DRDO (through the ACRHEM under the DRDO: vide project no. DRDO/02/0201/2011/00060 Phase-II) and GV would like to thank the Department of Science and Technology (DST) (under the grant SR/FTP/PS-096/2010(G)) for financial support. We would also like to acknowledge the CMSD, University of Hyderabad, for providing the computational facilities. ENR would like to thank Dr T. Atahar Parveen for fruitful discussions. AHR would like to acknowledge the CENTEM project, registered number CZ.1.05/2.1.00/03.0088, co-funded by the ERDF as part of the Ministry of Education, Youth and Sports OP RDI program and the follow-up sustainability stage, supported through CENTEM PLUS (LO1402) by financial means from the Ministry of Education. AHR is also grateful for the support of the Youth and Sports under the 4National Sustainability Programme I, and MetaCentrum (LM2010005) and CERIT-SC (CZ.1.05/3.2.00/08.0144) infrastructures. SA would like to thank the High Performance Facilities (HPC) at the Inter-University Accelerator Centre (IUAC) in New Delhi, the Indian Institute of Mathematical Sciences (IMSC) in Chennai, CSIR-4PI in Bangaluru and the Indian Institute of Technology in Kanpur.

References

  1. J. A. Neff, Prog. Cryst. Growth Charact. Mater., 1990, 20, 1–7 CrossRef CAS.
  2. C. T. Chen, G. L. Wang, X. Y. Wang and Z. Y. Xu, Appl. Phys. B: Lasers Opt., 2009, 97, 9–25 CrossRef CAS.
  3. C. Bosshard, K. Sutter, P. Pretre, J. Hulliger, M. Florsheimer, P. Kaatz and P. Gunter, Organic Nonlinear Optical Materials, Gordon and Breach, Switzerland, 1995 Search PubMed.
  4. P. A. Franken, A. E. Hill, C. W. Peters and G. Weinreich, Phys. Rev. Lett., 1961, 7, 118–119 CrossRef.
  5. G. Zou, N. Ye, L. Huang and X. Lin, J. Am. Chem. Soc., 2011, 133, 20001–20007 CrossRef CAS PubMed.
  6. F. Gan and S. Tian, Series on Archaeology and History of Science in China, History Of Modern Optics and Optoelectronics Development in China, World Scientific/World Century, Hackensack, 2014 Search PubMed.
  7. E. Narsimha Rao, S. Appalakondaiah, N. Yedukondalu and G. Vaitheeswaran, J. Solid State Chem., 2014, 212, 171–179 CrossRef CAS.
  8. L. Kang, Z. Lin, J. Qin and C. Chen, Sci. Rep., 2013, 3, 1366 Search PubMed.
  9. T. T. Tran, P. S. Halasyamani and J. M. Rondinelli, Inorg. Chem., 2014, 53, 6241–6251 CrossRef CAS PubMed.
  10. P. C. Ray, Chem. Rev., 2010, 110, 5332–5365 CrossRef CAS PubMed.
  11. M. a. MÃĎâĂęczka, L. Macalik and A. Majchrowski, J. Alloys Compd., 2013, 575, 86–89 CrossRef.
  12. R. Arun Kumar, M. Arivanandhan and Y. Hayakawa, Prog. Cryst. Growth Charact. Mater., 2013, 59, 113–132 CrossRef CAS.
  13. P. Yu, L.-M. Wu, L.-J. Zhou and L. Chen, J. Am. Chem. Soc., 2014, 136, 480–487 CrossRef CAS PubMed.
  14. J. D. Grice, V. Maisonneuve and M. Leblanc, Chem. Rev., 2007, 107, 114–132 CrossRef CAS PubMed.
  15. C. Chen, Y. Wu and R. Li, Int. Rev. Phys. Chem., 1989, 8, 65–91 CrossRef CAS.
  16. L. Kang, S. Luo, H. Huang, N. Ye, Z. Lin, J. Qin and C. Chen, J. Phys. Chem. C, 2013, 117, 25684–25692 CAS.
  17. J. Arlt and M. Jansen, Z. Naturforsch., B: J. Chem. Sci., 1990, 45, 943–946 CAS.
  18. B. Albert, J. Arlt, M. Jansen and H. Erhardt, J. Inorg. Gen. Chem., 1992, 607, 13–18 CAS.
  19. X.-L. Chen, M. He, Y.-P. Xu, H.-Q. Li and Q.-Y. Tu, Acta Crystallogr., Sect. E: Struct. Rep. Online, 2004, 60, i50–i51 CAS.
  20. Y. P. Sun, Q. Z. Huang, L. Wu, M. He and X. L. Chen, J. Alloys Compd., 2006, 417, 13–17 CrossRef CAS.
  21. B. Aurivillius, Acta Chem. Scand., Ser. A, 1983, 37, 159 CrossRef.
  22. G. Zou, L. Huang, N. Ye, C. Lin, W. Cheng and H. Huang, J. Am. Chem. Soc., 2013, 135, 18560–18566 CrossRef CAS PubMed.
  23. G. Lakshminarayana, J. A. Torres, T. C. Lin, I. V. Kityk and M. P. Hehlen, J. Alloys Compd., 2014, 601, 67–74 CrossRef CAS.
  24. W. Voigt, Ann. Phys., 1889, 38, 573 CrossRef.
  25. A. Reuss, J. Appl. Math. Mech., 1929, 9, 49–58 CAS.
  26. R. Hill, Proc. R. Soc. London, Ser. A, 1952, 65, 350–362 Search PubMed.
  27. M. C. Payne, M. P. Teter, D. C. Allan, T. A. Arias and J. D. Joannopoulos, Rev. Mod. Phys., 1992, 64, 1045–1097 CrossRef CAS.
  28. M. D. Segall, P. J. D. Lindan, M. J. Probert, C. J. Pickard, P. J. Hasnip, S. J. Clark and M. C. Payne, J. Phys.: Condens. Matter, 2002, 14, 2717–2744 CrossRef CAS.
  29. D. M. Ceperley and B. J. Alder, Phys. Rev. Lett., 1980, 45, 566–569 CrossRef CAS.
  30. J. P. Perdew and A. Zunger, Phys. Rev. B: Condens. Matter Mater. Phys., 1981, 23, 5048–5079 CrossRef CAS.
  31. J. P. Perdew and Y. Wang, Phys. Rev. B: Condens. Matter Mater. Phys., 1992, 45, 13244–13249 CrossRef.
  32. J. P. Perdew, K. Burke and M. Ernzerhof, Phys. Rev. Lett., 1996, 77, 3865–3868 CrossRef CAS PubMed.
  33. D. Vanderbilt, Phys. Rev. B: Condens. Matter Mater. Phys., 1990, 41, 7892–7895 CrossRef.
  34. T. H. Fischer and J. Almlof, J. Phys. Chem., 1992, 96, 9768 CrossRef CAS.
  35. F. Ortmann, F. Bechstedt and W. G. Schmidt, Phys. Rev. B: Condens. Matter Mater. Phys., 2006, 73, 205101 CrossRef.
  36. D. R. Hamann, M. SchlÃČÂijter and C. Chiang, Phys. Rev. Lett., 1979, 43, 1494–1497 CrossRef CAS.
  37. S. Baroni, S. de Gironcoli, A. Dal Corso and P. Giannozzi, Rev. Mod. Phys., 2001, 73, 515–562 CrossRef CAS.
  38. V. Milman, K. Refson, S. J. Clark, C. J. Pickard, J. R. Yates, S.-P. Gao, P. J. Hasnip, M. I. J. Probert, A. Perlov and M. D. Segall, J. Mol. Struct.: THEOCHEM, 2010, 954, 22–35 CrossRef CAS.
  39. X. Gonze, Phys. Rev. B: Condens. Matter Mater. Phys., 1997, 55, 10337–10354 CrossRef CAS.
  40. E. B. Wilson, J. C. Decius and P. C. Cross, Molecular vibrations: the theory of infrared and Raman vibrational spectra, McGraw-Hill, New York, 1955 Search PubMed.
  41. H. J. Monkhorst and J. D. Pack, Phys. Rev. B: Solid State, 1976, 13, 5188–5192 CrossRef.
  42. S. Grimme, J. Comput. Chem., 2006, 27, 1787 CrossRef CAS PubMed.
  43. S. Appalakondaiah, G. Vaitheeswaran, S. LebÃČÂĺgue, N. E. Christensen and A. Svane, Phys. Rev. B: Condens. Matter Mater. Phys., 2012, 86, 035105 CrossRef.
  44. H. M. Ledbetter, J. Phys. Chem. Ref. Data, 1977, 6, 1181–1203 CrossRef CAS.
  45. S. F. Pugh, Philos. Mag., 1954, 45, 823–843 CrossRef CAS.
  46. V. Kanchana, G. Vaitheeswaran, A. Svane and A. Delin, J. Phys.: Condens. Matter, 2006, 18, 9615–9624 CrossRef CAS.
  47. I. R. Shein and A. L. Ivanovskii, J. Phys.: Condens. Matter, 2008, 20, 415218 CrossRef.
  48. J. Haines, J. M. Léger and G. Bocquillon, Annu. Rev. Mater. Res., 2001, 31, 1–23 CrossRef CAS.
  49. A. M. Liquori, E. Giglio and L. Mazzarella, Il Nuovo Cimento B, 1971–1996, 55, 476–480 Search PubMed.
  50. E. S. Fisher and L. C. R. Alfred, Trans. Metall. Soc. AIME, 1968, 242, 1575–1586 CAS.
  51. A. Bouhemadou, Braz. J. Phys., 2010, 40, 52–57 CrossRef CAS.
  52. M. Born and K. Huang, Dynamical Theory of Crystal Lattices, Oxford University Press, Oxford, Canada, 1998 Search PubMed.
  53. M. Bass, C. DeCusatis, J. Enoch, V. Lakshminarayanan, G. Li, C. MacDonald, V. Mahajan and E. V. Stryland, Handbook of Optics, MGH, Florida, 2009, 3rd edn, vol. 4 Search PubMed.
  54. W. Zhong, R. D. King-Smith and D. Vanderbilt, Phys. Rev. Lett., 1994, 72, 3618–3621 CrossRef CAS PubMed.
  55. P. Ghosez, X. Gonze, P. Lambin and J. P. Michenaud, Phys. Rev. B: Condens. Matter Mater. Phys., 1995, 51, 6765–6768 CrossRef CAS.
  56. G. Amritendu Roy, S. Mukherjee, R. Gupta, S. Auluck, R. Prasad and A. Garg, J. Phys.: Condens. Matter, 2011, 23, 325902 CrossRef PubMed.
  57. M. Posternak, R. Resta and A. Baldereschi, Phys. Rev. B: Condens. Matter Mater. Phys., 1994, 50, 8911–8914 CrossRef CAS.
  58. S. Yip, Handbook Of Materials Modeling, Springer, The Netherlands, 2005, pp. 195–214 Search PubMed.
  59. P. Ravindran, R. Vidya, A. Kjekshus, H. FjellvÃČÂěg and O. Eriksson, Phys. Rev. B: Condens. Matter Mater. Phys., 2006, 74, 224412 CrossRef.
  60. E. Kroumova, M. I. Aroyo, J. M. Perez-Mato, A. Kirov, C. Capillas, S. Ivantchev and H. Wondratschek, Phase Transitions, 2003, 76, 155–170 CrossRef CAS.
  61. J. F. Lin, J. Liu, C. Jacobs and V. B. Prakapenka, Am. Mineral., 2012, 97, 583–591 CrossRef CAS.
  62. N. Buzgar and A. I. Apopei, Analele Stiintifice ale Universitati Al. I. Cuza, Iasi Geologie, 2009, 55, 97–112 Search PubMed.
  63. J. Donald Beasley, Appl. Opt., 1994, 33, 1000–1003 CrossRef PubMed.
  64. H. Wu, H. Yu, Z. Yang, J. Han, K. Wu and S. Pan, Journal of Materiomics, 2015, 1, 221–228 CrossRef.
  65. M. A. Blanco, E. Francisco and V. LuaÃČÂśa, Comput. Phys. Commun., 2004, 158, 57–72 CrossRef CAS.
  66. A. Parveen and N. K. Gaur, Thermochim. Acta, 2013, 566, 203–210 CrossRef CAS.
  67. D. T. Morelli and G. A. Slack, High Thermal Conductivity Materials, ed. S. L. Shinde and J. S. Goela, Springer, New York, 2006, ch. 2, pp. 37–68 Search PubMed.
  68. J. Callaway and H. C. von Baeyer, Phys. Rev., 1960, 120, 1149–1154 CrossRef CAS.

This journal is © The Royal Society of Chemistry 2016
Click here to see how this site uses Cookies. View our privacy policy here.