DOI:
10.1039/C6RA20367A
(Paper)
RSC Adv., 2016,
6, 107379-107398
Unprecedented copper(II) mediated in situ formation of gem-diol binuclear complexes: a combined experimental and computational study†
Received
12th August 2016
, Accepted 30th October 2016
First published on 4th November 2016
Abstract
The two alkoxo bridged complexes [Cu2(L1)2(HL2)2(H2O)](NO3)2·2H2O 1 and [Cu2(L1)2(HL2)2](NO3)2·H2O 2 have been synthesized by metal assisted hydrolysis of N′-[(E)-phenyl(pyridin-2-yl)methylidene]furan-2-carbohydrazide and N′-[(E)-phenyl(pyridin-2-yl)methylidene]acetohydrazide and characterized by various physicochemical techniques, where L1 is 2-benzoylpyridine and HL2 is phenyl(pyridin-2-yl)methanediol. The molecular structures of the complexes have been determined by single crystal X-ray diffraction analyses. The distances between the two metal centers, viz., Cu(1)⋯Cu(2) are 3.027 Å for 1 and 3.023 Å for 2. The molecular structures of both complexes consist of gem-diols. Low temperature magnetic susceptibility measurements reveal antiferromagnetic interactions with J values of −12.90 cm−1 for 1 and −12.97 cm−1 for 2. X-band ESR spectra showed typical S = 1 signals for both complexes. The zero-field splitting parameter (D) values estimated from the spectra of complexes 1 and 2 are 0.0030 and 0.011 cm−1, respectively in the polycrystalline state. Electrochemical studies of binuclear complexes evidence two irreversible one electron transfer reduction waves (Epc1 = 0.142 to −0.126, Epc2 = −0.480 to −0.188 V). The electronic spectra of the complexes have been explained by TD-DFT calculations. Both complexes 1 and 2 were tested as catalysts for the oxidation of the model substrate 3,5-di-tert-butylcatechol (3,5-dtbc) to 3,5-di-tert-butylquinone (3,5-dtbq) and can be considered as functional models for catechol oxidase. These complexes also catalyze the dismutation of superoxide at biological pH; complex 2 is more SOD active than 1.
Introduction
Current interest in the study of multinuclear transition metal complexes has offered prospective design of new functional materials.1–5 Among these multinuclear transition metal complexes, copper(II) complexes have been receiving considerable attention. The flexibility of the coordination sphere around copper(II) along with other factors leads to structural diversity.6–11 Synthetic binuclear copper(II) complexes provide models for metalloprotein activities and lend insight towards the design of new catalysts. Binuclear complexes have been receiving considerable interest due to their biological and industrial relevances.12 Binuclear copper(II) complexes, as model compounds for metalloenzymes with oxidase activity, is of particular interest for the development of bio-inspired catalysts for oxidation reactions. Recent reports have demonstrated that certain enzyme model binuclear complexes can promote catechol oxidation more efficiently than the mononuclear analogs.13
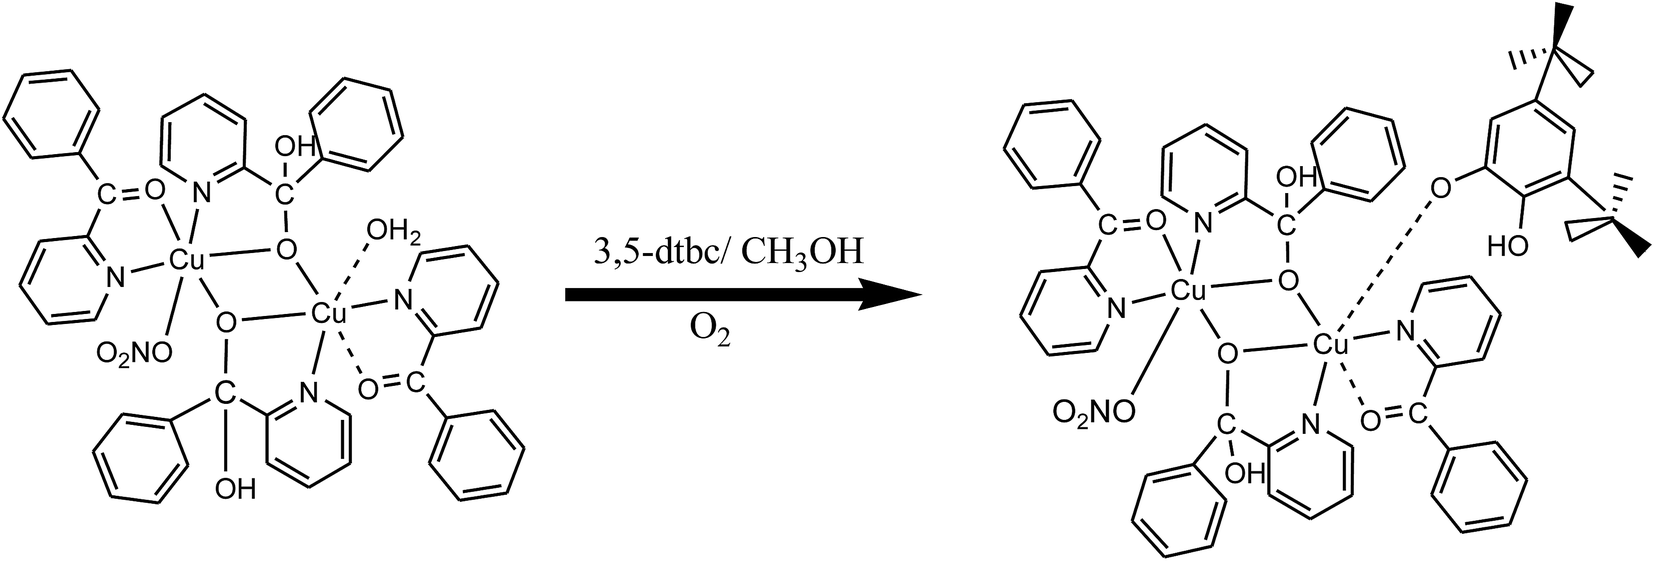
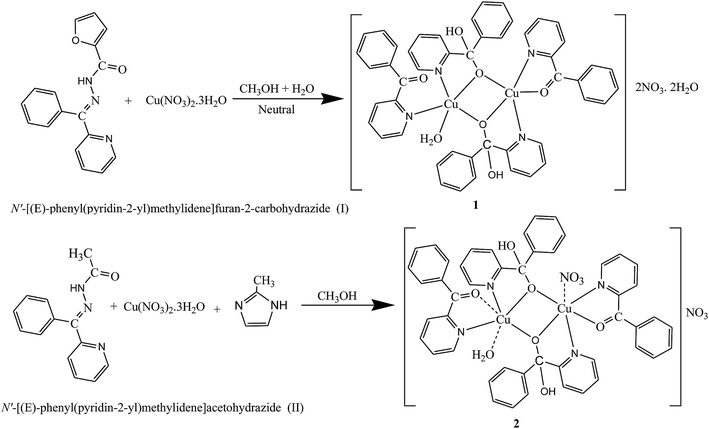
Our interest focuses on aqueous solutions of carbonyl compounds which have the ability to form geminal diols by the hydrolysis14–20 using two tridentate ligands (I and II). Few reports on metal(II) complexes derived from chelating gem-diol have been appeared.21,22 As a continuation of our interest in the synthesis of binuclear systems,23–26 N′-[(E)-phenyl(pyridin-2-yl)methylidene]furan-2-carbohydrazide and N′-[(E)-phenyl(pyridin-2-yl)methylidene]acetohydrazide were taken to construct binuclear copper(II) systems. However, during the course of preparing the copper(II) complexes of N′-[(E)-phenyl(pyridin-2-yl)methylidene]furan-2-carbohydrazide and N′-[(E)-phenyl(pyridin-2-yl)methylidene]acetohydrazide serendipitous hydrolysis reactions took place, two new ligands 2-benzoylpyridine (L1) and phenyl(pyridin-2-yl)methanediol (gem-diol) (HL2) (Scheme 1), were produced. Probably through the metal-assisted hydrolysis of N′-[(E)-phenyl(pyridin-2-yl)methylidene]furan-2-carbohydrazide and N′-[(E)-phenyl(pyridin-2-yl)methylidene]acetohydrazide two new binuclear copper(II) complexes were isolated (1 and 2). Binuclear copper(II) complexes with copper–copper separation of ∼3 Å are interesting model for the active site of catechol oxidase to elucidate the functional mechanism of the native enzyme and to develop bio-inspired catalytic systems.27–29 Catechol oxidase is a binuclear copper(II) containing an enzyme with a type-3 active site, which oxidizes catechol to quinone. Several binuclear copper(II) complexes with similar ligand environments have been synthesized to mimic the enzymatic activity and it is observed that catalytic activity is affected by several factors namely the metal–metal distance, type of ligand, coordination geometry and flexibility of ligand.30
 |
| | Scheme 1 Proposed mechanism of the synthesized copper(II) complexes. | |
A number of homobinuclear copper(II) complexes have been synthesized as superoxide dismutase (SOD) mimics.31,32 The biological function of SOD is known to play a very important role in preventing oxidative damage the anticancer and anti-aging mechanism.33 These enzymes dismutate the O2˙− radical into O2 and H2O2 according to Scheme 2 and contain metals such as Cu/Zn, Cu–Cu, Ni, Fe or Mn in their active sites.34 The Cu–Cu SOD enzyme is considered to be essential for mammals. Herein, we report the synthesis and characterization of two new binuclear copper(II) complexes with [Cu2(L1)2(HL2)2(H2O)](NO3)2·2H2O 1 and [Cu2(L1)2(HL2)2](NO3)2·H2O 2. These complexes have been characterized by single crystal X-ray diffraction analysis. DFT and TD-DFT calculations were also performed to support the experimental results. Theoretical calculations using the DFT formalism are becoming very popular in order to understand detailed electronic structures of complicated coordination compounds from a microscopic viewpoint. Recently, the accuracy, usability and operative property of the DFT method made it one of the commonly used methods or studying the electronic structure of quite large systems of transition metal complexes.35–37 Catecholase activity using 3,5-di-tert-butylcatechol (3,5-dtbc) along with SOD activity of these complexes have also been measured and discussed. The study of catecholase and SOD activity of these two binuclear complexes 1 and 2 show that complex 2 is more active than 1 towards catechol oxidation (Scheme 3) and superoxide disproportion (Scheme 2). Both catecholase and SOD activities involves electron transfer reaction between the substrate and enzyme.
 |
| | Scheme 2 Half reactions for the dismutation of superoxide radical mediated by Cu–Cu SOD enzyme. | |
 |
| | Scheme 3 A schematic representation of catechol oxidation. | |
Experimental section
Materials
All chemicals were reagent grade and used as received from commercial sources. Used solvents were dried and purified as reported in literature.38–40 The ligand N′-[(E)-phenyl(pyridin-2-yl)methylidene]furan-2-carbohydrazide was synthesized as before24 and N′-[(E)-phenyl(pyridin-2-yl)methylidene]acetohydrazide synthesized using similar method.
Synthesis of [Cu2(L1)2(HL2)2(H2O)](NO3)2·2H2O 1
To a methanol solution (20 mL) of N′-[(E)-phenyl(pyridin-2-yl)methylidene]furan-2-carbohydrazide (2 mmol, 0.582 g) was added drop wise of copper nitrate (2 mmol, 0.482 g) methanol solution (20 mL). A green suspension was obtained. In this suspension 40 mL water was added and stirred for 3 h at RT yielding a dark blue solution. The dark blue colored solution was filtered off and kept under room temperature. After one week, dark blue plate shaped single crystals (0.550 × 0.450 × 0.430 mm2) appeared suitable for X-ray diffraction analyses. The crystals were collected by filtration and dried over fused CaCl2 (yield 0.943 g, ∼75%). Anal. calcd and X-ray for C48H42Cu2N6O15 (M = 1071.99 g mol−1): anal. C, 53.71; H, 4.99; N, 7.81% calcd; C, 53.68; H, 4.10; N, 7.82; O, 22.35; Cu, 11.83%; X-ray; C, 53.73; H, 4.10; N, 7.83; O, 22.38; Cu, 11.85%. FAB mass (m/z) anal.: 911.99, calcd: 911.94, X-ray 911.53. (KBr, cm−1): 3379, 3214, 3075, 1615, 1566, 1516, 1466, 1428, 1297, 1227, 1145, 1085, 913, 778, 626, 476, 430 (see detail in Fig. S1†).
Synthesis of [Cu2(L1)2(HL2)2](NO3)2·H2O 2
To a hot methanol solution (20 mL) of N′-[(E)-phenyl(pyridin-2-yl)methylidene]acetohydrazide (2 mmol, 0.478 g) was added drop wise copper nitrate (2 mmol, 0.482 g) in hot methanol (20 mL) and a few drops of 2-methylimidazole was added to a resulting solution and stirred for 3 h at 70 °C. The resulting dark blue colored solution was filtered off and kept at room temperature. Plate shaped dark blue single crystals (0.410 × 0.310 × 0.280 mm2) suitable X-ray diffraction analyses were obtained after evaporation of the solvent for one week at room temperature. The crystal was collected by filtration and dried in fused CaCl2 (yield 0.701 g, ∼73%). Anal. calcd and X-ray (%) for C48H40Cu2N6O13 (M = 1035.96 g mol−1): anal. C, 55.65; H, 3.85; N, 8.12% calcd; C, 55.54; H, 3.86; N, 8.10; O, 20.04; Cu, 12.24% X-ray; C, 55.60; H, 3.86; N, 8.11; O, 20.08; Cu, 12.26%; FAB mass (m/z) anal.: 893.94, calcd: 893.92, X-ray 893.96. (KBr, cm−1): 3421, 3117, 2993, 2925, 2722, 2398, 1764, 1626, 1498, 1350, 1262, 1093, 1027, 951, 918, 754, 700, 657, 495, 453, 425 (see detail in Fig. S2†).
Physical measurements
Elemental analyses were carried out on elemental analyzer. FAB mass spectra were carried out on a JEOL SX 102/DA 6000 Mass Spectrometer using xenon (6 kV, 10 mA) as the FAB gas. The accelerating voltage was 10 kV and the spectra were recorded at RT with m-nitrobenzyl alcohol as the matrix. Magnetic susceptibilities at RT, were measured by the Gouy balance using a mercury(II) tetrathiocyanato cobaltate(II) as calibrating agent (χg = 16.44 × 10⁻⁶ c.g.s. units). Diamagnetic corrections were estimated from Pascal tables. Ligand-field spectra were recorded at 25 °C on a Shimadzu UV-vis recording Spectrophotometer UV-1601 in solution. Infrared (IR) spectra were recorded in KBr medium on a Perkin-Elmer 783 Spectrophotometer. Cyclic voltammetry measurements were carried out with a BAS-100 Epsilon electrochemical analyzer having an electrochemical cell with a three-electrode system. Ag/AgCl was used as reference electrode, glassy carbon as working electrode and platinum wire as an auxiliary electrode. TBAP (0.1 mol L−1) was used as the supporting electrolyte in DMSO. All measurements were carried out at 298 K under nitrogen. The solution was deoxygenated by purging nitrogen gas. Electron paramagnetic resonance (ESR) spectra were recorded with a Varian E-line Century Series ESR spectrometer equipped with a dual cavity and operating at the X-band of the 100 kHz modulation frequency. Tetracyanoethylene (TCNE) was used as a field marker (g = 2.00277). The molar ion exchange was measured using a Systronics digital conductivity meter (TDS-308) using a 10−3 M solution in DMSO. The SOD activities were evaluated using alkaline DMSO as a source of superoxide radicals (O2−) and nitro blue tetrazolium chloride (NBT) as a scavenger.23–26 Kinetic experiments were carried out spectrophotometrically on a Shimadzu UV-vis recording Spectrophotometer UV-1601 by measuring the quinone formation using the ∼400 nm peak, at biological pH 8.0 and 25 °C. The auto-oxidation of the 3,5-dtbc substrate was measured and subtracted from the total in order to obtain the extent of the oxidation reaction catalysed by the copper(II) complexes.41
X-ray crystallography
Diffraction quality block shaped dark green crystals of 1 and 2 were mounted on a Bruker APEX-II CCD diffractometer equipped with graphite monochromated MoKα radiation (λ = 0.71073 Å for 1 and 2) from a fine focus sealed tube radiation source. Intensity data were collected at 100 K for 1 and 2 using φ and ω scan technique. No significant intensity variation was observed during data collection. Multi-scan absorption corrections were applied empirically to the intensity values (Tmax = 0.653 and Tmin = 0.591 for 1 and Tmax = 0.759 and Tmin = 0.700 for) using SADABS.42 Data reductions were done by using program Bruker SAINT.43 The structures were solved by Direct Methods using the program SHELXS-97 (ref. 44) and refined with full-matrix least-squares based on F2 using program SHELXL-97.44 All non-hydrogen atoms were refined anisotropically. For both structures hydrogen atoms were first located in the Fourier difference map, then positioned geometrically and allowed to ride on their respective parent. The molecular graphics and crystallographic illustrations for 1 and 2 were prepared using PLATON,45 ORTEP,46 and WinGX47 program. All the relevant crystallographic data and structure refinement parameters for the complexes are summarized in Table 1. CCDC no. 1496447 for 1 and 1496455 for 2 contain the supplementary crystallographic data for the present paper.†
Table 1 Crystallographic data and details of refinements for complexes 1 and 2
| |
C48H44Cu2N6O15 1 |
C48H40Cu2N6O13 2 |
| Formula weight |
1069.95 |
1035.94 |
| Temperature (K) |
100(2) |
100(2) |
| Wavelength (Å) |
0.71073 |
0.71073 |
| Crystal system |
Monoclinic |
Monoclinic |
| Space group |
P21/n |
P21/n |
| a (Å) |
18.209(2) |
18.1632(14) |
| b (Å) |
14.0476(17) |
14.0696(12) |
| c (Å) |
18.549(2) |
18.5365(15) |
| α (°) |
90 |
90 |
| β (°) |
100.905(2) |
100.797(10) |
| γ (°) |
90 |
90 |
| Volume (Å3) |
4658.8(10) |
4653.1(7) |
| Z |
4 |
4 |
| Density (calculated) (mg m−3) |
1.525 |
1.479 |
| Absorption coefficient (mm−1) |
0.991 |
0.987 |
| F(000) |
2200 |
2128 |
| Crystal size (mm3) |
0.550 × 0.450 × 0.430 |
0.410 × 0.310 × 0.280 |
| Theta range for data collection (°) |
1.831 to 32.080 |
2.042 to 32.104 |
| Index ranges |
−22 ≤ h ≤ 27, −10 ≤ k ≤ 20, −27 ≤ l ≤ 27 |
−25 ≤ h ≤ 16, −20 ≤ k ≤ 20, −25 ≤ l ≤ 26 |
| Reflections collected |
24![[thin space (1/6-em)]](https://www.rsc.org/images/entities/char_2009.gif) 142 142 |
34084 |
| Data/restraints/parameters |
14455/33/691 |
14843/39/645 |
| Goodness-of-fit on F2 |
1.045 |
1.072 |
| Final R indices [I > 2sigma(I)] |
R1 = 0.0499, wR2 = 0.1352 |
R1 = 0.0436, wR2 = 0.1162 |
| R Indices (all data) |
R1 = 0.0721, wR2 = 0.1480 |
R1 = 0.0655, wR2 = 0.1254 |
Magnetic measurements
Magnetic susceptibility measurements for 1 and 2 were collected at low temperature. The magnetic susceptibilities of powder samples of these samples were measured over a temperature range of 2–300 K with a field of 100 MT, using a Quantum Design SQUID magnetometer MPMS-XL5. All experimental data were corrected for diamagnetism estimated from Pascal constants and temperature-independent paramagnetism (TIP).
Computational method
Full geometry optimizations were carried out using density functional theory (DFT) method at the B3LYP level for 1 and 2.48,49 All elements except Cu were assigned 6-31G(d) basis set.50,51 LANL2DZ with effective core potential for Cu atom was used.52–54 The vibrational frequency calculations were performed to ensure that the optimized geometries represent the local minima and that there is an only positive eigen value. In the computational model, the cationic complex was taken into account. All calculations were performed with GAUSSIAN09 program package55 with the aid of the Gauss View visualization program. Vertical electronic excitations based on B3LYP optimized geometries were computed using the time-dependent density functional theory (TDDFT) formalism56 in DMSO using a conductor-like polarizable continuum model (CPCM).57–59
Results and discussion
Syntheses and general characterization
The routes used for the syntheses of complexes 1 and 2 are shown in Scheme 1. Alkoxo bridged complexes 1 and 2 were synthesized by a single-pot synthesis in methanol through sequential addition of equimolar amounts of metal salt and Schiff bases. In synthetic route of complexes 2,2-methyl imidazole as bridging ligand was also added. After, sequential additions of above compounds, the resulting solutions were exposed to atmospheric oxygen. During exposure in atmospheric oxygen serendipitous hydrolysis took place and two new ligands 2-benzoylpyridine (L1) and phenyl(pyridin-2-yl)methanediol (gem-diol) (HL2) (Scheme 1), were produced probably through the metal-assisted hydrolysis of N′-[(E)-phenyl(pyridin-2-yl)methylidene]furan-2-carbohydrazide and N′-[(E)-phenyl(pyridin-2-yl)methylidene]acetohydrazide and two new binuclear copper(II) complexes were isolated (1 and 2). Also use of 2-methyl imidazole in synthetic route for complex 2 did not yield the desired products.
The polycrystalline FTIR spectra of complexes 1 and 2 were characterized by IR spectroscopy (Fig. S1 and S2†). The FTIR spectra of complexes were assigned on the basis of frequency calculations on DFT optimized geometries60–62 of 1 and 2. Characteristic IR bands along with calculated bands are presented in Table S1.† Both computed and experimental major frequencies and their respective positions, showed a good agreement between the calculated and experimental data. The gem-diol ν(C–OH) peaks located at 3075 cm−1 and 2993 cm−1 in 1 and 2, respectively. The free nitrate ion appears at 1428, 1297 and 818 cm−1 in 1 and 1498, 1262 and 754 cm−1 for 2 whereas weakly coordinated nitrato ligand was detected at 1350 cm−1. Peak corresponding to free water molecules in 1 was observed at 3397 cm−1. Peaks for coordinated water molecules were also observed in both complexes. In both complexes characteristic peaks located at 1615 in 1 and 1626 cm−1 in 2 are assigned to the vibrations of ν(C![[double bond, length as m-dash]](https://www.rsc.org/images/entities/char_e001.gif) O) group of the complexes.63 Other bands associated with the ligands displayed minor shifts, suggesting that the electronic density of the bonds have been altered upon coordination.64
O) group of the complexes.63 Other bands associated with the ligands displayed minor shifts, suggesting that the electronic density of the bonds have been altered upon coordination.64
Molecular structure characterization
Crystal structures of 1 and 2 are shown in Fig. 1 and 2, respectively. Important inter atomic parameters are listed in Tables 2 and 3. The structures reveal that both are binuclear copper(II) compounds derived from the L1 and HL2 bidentate ligands. The molecules of 1 and 2 have a noncentrosymmetric structure with a binuclear Cu2(Cu–O–R)2 rectangular core. One alkoxo oxygen from each HL2 acts as a bridge between two copper centers in both complexes. Both copper complexes crystallized as single dark blue crystals belong to the monoclinic crystal system and space group P21/n. Fig. 1 shows the structure of the cation complex 1, which is composed of one unsymmetrical ligand (L1) coordinated to both copper(II) centers (Cu(1) and Cu(2)). Each copper center is five coordinated and is bridged by the alkoxo donor O atom of the ligand (HL2). The coordination geometry around the both copper(II) atom is distorted square pyramidal, with the Cu(1) ion being surrounded by two pyridine nitrogens (N(1A) and N(1B)), two alkoxo oxygen (O(1B) and O(1D)) and crystalline water molecule (O(3W)), in Cu(1), Cu(2) ketonic oxygen O(1A) is attached in place of water molecule. The axial Cu(II)–N/O bond lengths fall in the range of 1.9091 to 2.000 Å, with the equatorial (Cu(1)–O(1W) and Cu(2)–O(1C)) bond lengths are slightly longer than the corresponding axial bond lengths (Table 2). The basal plane of both Cu(II) centers is occupied by pyridine nitrogen (N(1A) and N(1B)) and alkoxo bridging oxygen (O(1B) and O(1D)), thus, completing a distorted square pyramidal structure. The relative amounts of the distorted square based pyramidal component are indicated by an addition parameter (τ)65 representing the degree of trigonality within the structural continuum between square-pyramidal (τ = 0) and trigonal bipyramidal structures (τ = 1). The τ values for two Cu(II) ions of complex 1 are obtained as τ1 = 0.25 and τ2 = 0.3 by using the equation τ = β − α/60, where α1 = O(1D)–Cu(1)–N(1B) (158.08°), β1 = O(1B)–Cu(1)–N(1A) (173.67°), α2 = O(1B)–Cu(2)–N(1D) (158.82°), β2 = O(1D)–Cu(2)–N(1C) (176.95°), respectively. Thus, the coordination environment of each Cu(II) of complex 1 is a slightly distorted square pyramidal structure in which the four-fold axis is comprised of N(1A), N(1B), O(1B) and O(1D) atoms (or N(1C), N(1D), O(1B) and O(1D) atoms), with the axial atom O(3W) (or O(1C)). The slightly distortion in the basal plane may be attributed for the strain imposed by the ligand to the metal center during the coordination. The two copper atoms are separated by 3.027 Å, with a Cu(1)–O(1B)–Cu(2) and Cu(1)–O(1D)–Cu(2) bridge angles of 103.14(7) and 102.70(7)°, respectively. These angles (alkoxo, Cu–O–Cu) exhibit a clear antiferromagnetic coupling. The Cu–O–Cu (alkoxo) angles are similar to those observed for other alkoxo complexes.66–70 The Cu(1)⋯Cu(2) separation for this complex is comparable to that of the reported alkoxo bridged complex.71 Although this Cu(1)⋯Cu(2) separation (3.023 Å) is much shorter than the corresponding distance (6.097 Å) in the imidazole-bridged bicopper system.72
 |
| | Fig. 1 Molecular structure of complex [Cu2(L1)2(HL2)2(H2O)]2+ 1 showing the atom numbering scheme. | |
 |
| | Fig. 2 Molecular structure of complex [Cu2(L1)2(HL2)2]2+ 2 showing the atom numbering scheme. | |
Table 2 Coordination bond lengths [Å] and angles [°] for complex 1
| |
Exp. |
Cal. |
|
Exp. |
Cal. |
| Cu(1)–O(1B) |
1.9282(15) |
2.034 |
Cu(2)–O(1D) |
1.9091(15) |
2.075 |
| Cu(1)–N(1B) |
1.9948(18) |
2.432 |
Cu(2)–O(1B) |
1.9362(15) |
2.123 |
| Cu(1)–O(1D) |
1.9670(15) |
2.078 |
Cu(2)–N(1C) |
1.9868(18) |
2.065 |
| Cu(1)–N(1A) |
2.0000(18) |
2.035 |
Cu(2)–N(1D) |
1.9895(18) |
2.012 |
| Cu(1)–O(1A) |
2.4774(18) |
2.489 |
Cu(2)–O(1C) |
2.3800(16) |
2.634 |
| Cu(1)–O(3W) |
2.4705(17) |
2.879 |
Cu(1)–Cu(2) |
3.0273(5) |
3.265 |
| O(1B)–C(6B) |
1.397(3) |
1.674 |
O(1D)–C(6D) |
1.394(3) |
1.742 |
| O(2B)–C(6B) |
1.412(3) |
1.987 |
O(2D)–C(6D) |
1.406(2) |
1.874 |
| O(1B)–Cu(1)–O(1D) |
76.40(6) |
77.87 |
O(1B)–Cu(1)–N(1B) |
81.71(7) |
80.76 |
| O(1D)–Cu(1)–N(1B) |
158.08(7) |
159.89 |
O(1B)–Cu(1)–N(1A) |
173.67(7) |
176.87 |
| O(1D)–Cu(1)–N(1A) |
100.52(7) |
99.98 |
N(1B)–Cu(1)–N(1A) |
101.38(7) |
1.4.98 |
| O(1B)–Cu(1)–Cu(2) |
38.52(4) |
40.78 |
O(1D)–Cu(1)–Cu(2) |
37.97(4) |
36.98 |
| N(1B)–Cu(1)–Cu(2) |
120.21(5) |
123.54 |
N(1A)–Cu(1)–Cu(2) |
137.87(5) |
138.56 |
| O(1D)–Cu(2)–O(1B) |
77.58(6) |
77.98 |
O(1D)–Cu(2)–N(1C) |
176.95(7) |
175.78 |
| O(1B)–Cu(2)–N(1C) |
99.92(7) |
100.39 |
O(1D)–Cu(2)–N(1D) |
82.33(7) |
84.69 |
| O(1B)–Cu(2)–N(1D) |
158.82(7) |
160.59 |
N(1C)–Cu(2)–N(1D) |
100.35(8) |
102.99 |
| O(1D)–Cu(2)–O(1C) |
102.65(6) |
105.86 |
O(1B)–Cu(2)–O(1C) |
102.14(6) |
102.83 |
| N(1C)–Cu(2)–O(1C) |
76.06(6) |
77.97 |
N(1D)–Cu(2)–O(1C) |
88.66(7) |
89.09 |
| O(1D)–Cu(2)–Cu(1) |
39.34(4) |
39.98 |
O(1B)–Cu(2)–Cu(1) |
38.33(4) |
36.97 |
| N(1C)–Cu(2)–Cu(1) |
138.06(5) |
140.02 |
N(1D)–Cu(2)–Cu(1) |
121.58(5) |
123.31 |
| O(1C)–Cu(2)–Cu(1) |
103.98(4) |
104.09 |
Cu(1)–O(1B)–Cu(2) |
103.14(7) |
104.08 |
| O(1B)–C(6B)–O(2B) |
111.65(17) |
112.07 |
Cu(2)–O(1D)–Cu(1) |
102.70(7) |
102.82 |
| O(1D)–C(6D)–O(2D) |
112.20(17) |
112.42 |
|
|
|
Table 3 Coordination bond lengths [Å] and angles [°] for complex 2
| |
Exp. |
Cal. |
|
Exp. |
Cal. |
| Cu(1)–O(1B) |
1.9076(13) |
2.031 |
Cu(2)–O(1D) |
1.9262(13) |
2.056 |
| Cu(1)–O(1D) |
1.9311(14) |
1.986 |
Cu(2)–O(1B) |
1.9606(14) |
2.014 |
| Cu(1)–N(1A) |
1.9831(16) |
2.035 |
Cu(2)–N(1D) |
1.9912(17) |
2.098 |
| Cu(1)–N(1B) |
1.9854(17) |
2.130 |
Cu(2)–N(1C) |
1.9969(16) |
2.012 |
| Cu(1)–O(1A) |
2.3743(14) |
2.650 |
Cu(2)–O(1W) |
2.4676(15) |
2.756 |
| Cu(1)–O(11) |
3.113(2) |
3.473 |
Cu(2)–O(1C) |
2.4737(15) |
2.563 |
| O(1B)–C(6B) |
1.396(2) |
1.452 |
O(1D)–C(6D) |
1.398(2) |
1.375 |
| O(2B)–C(6B) |
1.406(2) |
1.398 |
O(2D)–C(6D) |
1.408(2) |
1.421 |
| O(1B)–Cu(1)–O(1D) |
77.51(6) |
77.89 |
O(1B)–Cu(1)–N(1A) |
176.72(6) |
175.90 |
| O(1D)–Cu(1)–N(1A) |
99.74(6) |
100.03 |
O(1B)–Cu(1)–N(1B) |
82.55(6) |
82.86 |
| O(1D)–Cu(1)–N(1B) |
158.80(6) |
158.01 |
N(1A)–Cu(1)–N(1B) |
100.40(7) |
101.04 |
| O(1B)–Cu(1)–O(1A) |
102.64(5) |
103.78 |
O(1D)–Cu(1)–O(1A) |
102.29(5) |
102.85 |
| N(1A)–Cu(1)–O(1A) |
76.09(6) |
77.04 |
N(1B)–Cu(1)–O(1A) |
88.94(6) |
88.05 |
| O(1B)–Cu(1)–O(11) |
82.04(6) |
84.96 |
O(1D)–Cu(1)–O(11) |
93.37(6) |
95.98 |
| N(1A)–Cu(1)–O(11) |
99.99(6) |
100.12 |
N(1B)–Cu(1)–O(11) |
76.67(6) |
78.23 |
| O(1A)–Cu(1)–O(11) |
164.27(5) |
166.97 |
O(1D)–Cu(2)–O(1B) |
76.37(6) |
78.45 |
| O(1D)–Cu(2)–N(1D) |
81.78(6) |
80.99 |
O(1B)–Cu(2)–N(1D) |
158.13(6) |
158.87 |
| O(1D)–Cu(2)–N(1C) |
173.55(6) |
173.97 |
O(1B)–Cu(2)–N(1C) |
100.22(6) |
101.65 |
| N(1D)–Cu(2)–N(1C) |
101.62(7) |
102.03 |
O(1D)–Cu(2)–O(1W) |
89.54(5) |
89.89 |
| O(1B)–Cu(2)–O(1W) |
85.55(6) |
85.99 |
N(1D)–Cu(2)–O(1W) |
93.36(6) |
94.01 |
| N(1C)–Cu(2)–O(1W) |
95.68(6) |
95.97 |
O(1D)–Cu(2)–O(1C) |
100.75(5) |
101.01 |
| O(1B)–Cu(2)–O(1C) |
95.98(5) |
96.11 |
N(1D)–Cu(2)–O(1C) |
89.00(6) |
89.76 |
| N(1C)–Cu(2)–O(1C) |
73.99(6) |
74.02 |
O(1W)–Cu(2)–O(1C) |
169.67(5) |
170.12 |
| O(1B)–C(6B)–O(2B) |
111.88(15) |
112.08 |
O(1D)–C(6D)–O(2D) |
111.52(15) |
113.11 |
| Cu(1)–O(1B)–Cu(2) |
102.78(6) |
102.89 |
Cu(2)–O(1D)–Cu(1) |
103.20(6) |
103.99 |
The binuclear copper [Cu2(L1)2(HL2)2]2NO3·H2O 2, was originally obtained from hydrolysis of a tridentate Schiff base ligand as shown in Scheme 1. Fig. 2 shows the perspective view of the binuclear Cu(II) cationic complex 2. Complex 2 crystallized in two different ligands L1 and HL2 acts as a neutral and mononegative, respectively. The crystal structure consists of the complex cation packed with two nitrate counter ions to form a monoclinic system with space group P21/n. The coordination polyhedral around Cu(1) and Cu(2) ions are distorted square pyramidal and distorted square planar, respectively. Each copper center is bounded by short, in-plane, contacts of two nitrogen and two oxygen atoms, with the pyridine nitrogen N(1A), N(1B), N(1C), N(1D) and the alkoxo oxygen O(1B) and O(1D) acting as a bridging between the two metal atoms. A ketonic oxygen O(1A) is bound terminally to Cu(1). The crystalline water molecule O(1W) and ketonic oxygen O(1C) are held loosely to Cu(2), through hydrogen bond (Fig. 3). Similarly, the nitrate anion is held loosely to Cu(1) (Fig. 3). Somewhat longer, but nevertheless significant contacts [Cu(1)–O(11) = 3.113(2) Å; Cu(2)–O(1C) = 2.473(15) Å and Cu(2)–O(1W) = 2.467(15) Å] indicate additional ligand on Cu(1) and Cu(2). One of the nitrate anion was found to be disordered, the position of the all oxygen (O(21), O(22) and O(23)) was shared by both orientations, thus, disordered was along the C3 rotation axis. No disorder of N(2) was observed, as a result of its involvement in hydrogen bonding with H2D (Fig. 4). The Cu(1) ion display a distorted square pyramidal coordination geometry (τ = 0.29),65 defined by two pyridyl nitrogen [N(1A) and N(1B)], two alkoxo oxygen [O(1B) and O(1D)] and O(1A) atom occupy its apical position. The equatorial Cu–Npy bond distance [Cu(1)–N(1A) = 1.9831(16) and Cu(1)–N(1B) = 1.9854(11) Å] are greater than the Cu(1)–Oalkoxo ones [Cu(1)–O(18) = 1.9076(13) and Cu(1)–O(1D) = 1.9311(14) Å]. Both being shorter than apical Cu(1)–O(1A) bond distances (see Table 3); as expected for a Jahn–Teller distorted octahedral or square-pyramidal d9 Cu(II) ion. The Cu(2) ion displays a distorted square planar structure. The planes are formed by two pyridine nitrogen (N(1C) and N(1D)) and two bridged alkoxo oxygen (O(1B) and O(1D)) atoms. The two copper atoms are separated by 3.023 Å, with a Cu(1)–O(1B)–Cu(2) and Cu(1)–O(1D)–Cu(2) bridge angles of 102.78(7) and 103.22(7)°, respectively. This Cu(1)⋯Cu(2) separation is also comparable to that of reported complex in the literature.71
 |
| | Fig. 3 Selected atom numbering pseudo hydrogen bonded structure of complex [Cu2(L1)2(HL2)2(NO3)(H2O)]+ 2. | |
 |
| | Fig. 4 Bifurcated and trifurcated hydrogen bonding scheme of complex [Cu2(L1)2(HL2)2(H2O)](NO3)2·2H2O 1. Selected numbering scheme with hydrogen-bond distances in (Å). | |
The ordered diol C–O bond length of 1.404 Å [C6B/C6D–Oav] observed in both complexes agrees well with values of 1.397–1.412 Å for previously reported diol complexes.73,74 The bonding of these ligands in both complexes to the copper atoms in a bidentate fashion causes no relevant angular strain, as can be seen from the observed angles at the sp3 hybridized gem-diol carbon atoms C(6B) and C(6D) from the expected value of 109°.
In complex 1, there exists five kinds of hydrogen bonding interactions with different functions for the formation of the supramolecule: (1) the intra-molecular hydrogen bonding C12d–H12d⋯O1c, C8ba–H8ba⋯O1A and C1A–H1aa⋯O3w being responsible for the overall stability of the complex; (2) the inter-molecular hydrogen bonding (C–H⋯O) generating the supramolecular synthon (3) bifurcated hydrogen bonding (4) trifurcated hydrogen bonding and (5) bifurcated oxygen interactions. The nitrate anions behave as H-bond acceptor towards the aqua ligands resulting in the formation of a 2D supramolecular network (Fig. S3†), while the geometrical parameters of H-bonds are collected in Table 4. The natures of bifurcated (or three-centered) hydrogen bonds (Fig. 4) have been investigated along with normal hydrogen bonds. A detail of the hydrogen bond interactions involving the water molecules and nitrate anion is shown in Fig. 4. Such types of hydrogen bonds have already been investigated by earlier workers.75–79 It is interesting to note that bifurcated H-bonding is found in H atoms of gem-diol, coordinated water molecule and crystalline water molecule. The hydrogen atoms (H2b and H2d) of the gem-diol OH also form bifurcated hydrogen bonds with the nitrate oxygen atoms (O11 and O13) and with other nitrate oxygen atoms (O22 and O23). The H atom of coordinated water molecule forms bifurcated hydrogen bond with nitrate oxygen atom (O22) and gem-diol oxygen O2D. Hydrogen atom (H2w1) of the uncoordinated water molecule (O2w) also forms bifurcated hydrogen bonds with uncoordinated oxygen atom of water molecule (O1w) and uncoordinated nitrate oxygen atom (O12). Trifurcated (or four-centered) hydrogen bonding was also detected from gem-diol H atom (H2D) with different atoms of nitrate anions (O22, O23, and N2). The bifurcated interaction is obtained through O atoms (O11 and O22) of two uncoordinated nitrate anions. Other intra-molecular hydrogen bonds are also shown in Fig. 4 in complex 1. In complex 2, the most interesting feature of the structure is the formation of a three-dimensional supramolecular structure through hydrogen-bonding interactions of the coordinated/uncoordinated nitrate anions and weakly coordinated water molecule (Fig. S4†). The hydrogen atoms, H(3DA) and H(3BA) attached to C(8B), C(9B), C(10B) and C(10D) are involved in inter-molecular C–H⋯π interactions with the symmetry (1/2 − x, 1/2 − y, 1/2 + z) related phenyl ring, C7B, C8B, C9B, C10B, C11B, C12B (Cg1), C7D, C8D, C9D, C10D, C11D, C12D (Cg2) and the hydrogen atoms of H(3BA) (Cg1) and H3DA (Cg2), attached to C3B and C3D are involved in inter-molecular C–H⋯π interactions. In both complexes 1 and 2, the ring centroid (H⋯Cg) distances are in the range of 2.55–2.75 Å. The C–H⋯Cg(1/2), angles 145.90° and 153.9° are still below the optimal value (180°) for strongest C–H⋯π interactions, which may be due to the steric constraints in the molecule (Fig. 5). Such CH⋯π interactions in both complexes 1 and 2 also contribute extra stabilization in their solid state.
Table 4 Hydrogen-bond geometry parameter [Å and °] for 1a
| D–H⋯A |
d(D–H) |
d(H⋯A) |
d(D⋯A) |
∠(DHA) |
| Symmetry transformations used to generate equivalent atoms: #1−x + 1/2, y − 1/2, −z + 3/2, #2−x, −y + 1, −z + 1, #3−x + 1, −y + 1, −z + 1. |
| C(1A)–H(1AA)⋯O(3W) |
0.95 |
2.48 |
3.196(3) |
131.8 |
| C(4A)–H(4AA)⋯O(23)#1 |
0.95 |
2.58 |
3.262(4) |
129.3 |
| C(1B)–H(1BA)⋯O(11A)#2 |
0.95 |
2.42 |
3.317(6) |
156.4 |
| C(2B)–H(2BA)⋯O(3W)#2 |
0.95 |
2.53 |
3.373(3) |
147.4 |
| C(1D)–H(1DA)⋯O(21)#3 |
0.95 |
2.37 |
3.237(3) |
151.0 |
| O(2W)–H(2W1)⋯O(12) |
0.863(19) |
2.16(2) |
3.019(9) |
176(6) |
| O(3W)–H(3W1)⋯O(11) |
0.839(18) |
2.01(2) |
2.845(4) |
173(4) |
| O(3W)–H(3W1)⋯O(13A) |
0.839(18) |
1.91(3) |
2.74(2) |
170(4) |
| O(3W)–H(3W2)⋯O(22) |
0.833(17) |
2.27(3) |
3.030(3) |
153(4) |
 |
| | Fig. 5 One-dimensional supramolecular chain of complex 1 (top) and 2 (bottom) via C–H⋯π interactions. Only the relevant hydrogen atoms are shown. | |
Electronic transitions and TD-DFT calculations
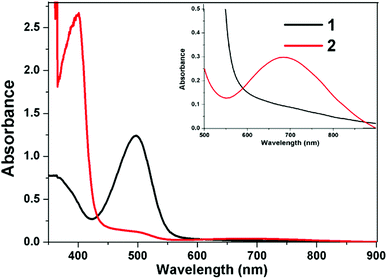
The electronic spectra of complex 1 and 2 have been recorded in DMSO solutions and data are summarized in the Table 5. The calculated vertical excitation energy oscillator strength and tentative nature of the transition obtained at the TD-DFT/B3LYP/LANL2DZ calculation have been performed in gas phase DMSO Table 5. The UV-visible spectra of complexes 1 and 2 (3 × 10⁻³ M) in DMSO shown in Fig. 6 indicate a broad d–d band consisting of two peaks centered at 700 (ε = 65.33 M−1 cm−1) and 760 nm (ε = 47.33 M−1 cm−1) for 1 and 622 nm (ε = 44.00 M−1 cm−1) and 693 nm (ε = 50.00 M−1 cm−1) for 2. In the visible region, each spectrum involves two ligand field bands, appearing at 700–760 nm and 622–693 nm regions, corresponding to the transitions dz2 → dx2−y2 and dxz, dyz → dx2−y2 respectively, as expected for square-planar Cu(II) complexes and confirming the dx2−y2 based ground state.80,81 The latter band for the complexes 1 and 2 appears in the form of a broad shoulder with increased intensity (Fig. 6), gained from the contribution of only d–d band due to the second Cu(II) center of distorted square-pyramidal geometry.82,83 Such type of absorption bands between the Cu(II)–Cu(II) homobinuclear copper(II) complexes were observed in homobinuclear complexes reported in literature.84,85 In addition, the UV-visible spectra of complexes 1 and 2 in the regions 490 and 378 nm are attributed to a ligand–metal charge transfer associated with the nitrogen and oxygen donors86,87 as shown in Fig. 6.
Table 5 Vertical electronic excitations calculated by the TD DFT/B3LYP/LANL2DZ method and experimental absorption bands of copper(II) complexes
| Excitation (eV) |
Wavelength (nm) |
Oscillator strength (f) |
Major contribution |
Transition assignment |
Exp. wave length (nm) |
| Complex 1 |
| 0.0780 |
1285 |
0.0025 |
αHOMO−1 → αLUMO (59%) |
dxz → dx2−y2 |
|
| 0.1871 |
890 |
0.0008 |
αHOMO−1 → αLUMO (81%) |
dxz → dx2−y2 |
760 |
| 0.2699 |
710 |
0.0004 |
αHOMO → αLUMO+1 (66%) |
dxz → dx2−y2 |
700 |
| 0.3326 |
690 |
0.0029 |
αHOMO−2 → αLUMO (33%) |
Cu-d → dx2−y2 |
|
| 0.5503 |
530 |
0.0032 |
αHOMO → αLUMO+1 (8%) |
LMCT |
490 |
| 0.6303 |
440 |
0.0005 |
αHOMO−2 → αLUMO (19%) |
LMCT |
|
|
| Complex 2 |
| 0.3049 |
1165 |
0.0252 |
αHOMO → αLUMO (28%) |
dx2 → dx2−y2 |
|
| 0.3664 |
938 |
0.0000 |
αHOMO−1 → αLUMO+5 (43%) |
dz2 → dx2−y2 |
693 |
| 0.4088 |
732 |
0.0054 |
αHOMO → αLUMO+1 (84%) |
dxz → dx2−y2 |
|
| 0.4708 |
650 |
0.0024 |
αHOMO → αLUMO+2 (40%) |
dxz → dx2−y2 |
622 |
| 0.5837 |
494 |
0.0270 |
αHOMO → αLUMO+2 (26%) |
LMCT |
|
| 0.7402 |
374 |
0.0008 |
αHOMO → αLUMO+3 (66%) |
LMCT |
378 |
 |
| | Fig. 6 UV-vis spectra of complexes 1 and 2 in DMSO (0.25 × 10⁻³ M) at RT in caption 3 × 10⁻³ M. | |
In complex 1 the experimental band 700 nm (shoulder) contains two theoretical excitation energies 0.6809 eV (1180 nm and f = 0.0001) and 0.4107 eV (945 nm and f = 0.0035). These excitations are contributed to HOMO → LUMO (50%) and HOMO−1 → LUMO (28%). They can be assigned to ligand to ligand transitions according to molecular orbital character79 (Fig. S3†). The experimental d–d band 624 nm is contributed to the two theoretical molecular orbital excitation energy 0.2003 eV (680 nm and f = 0.0031) and 0.4600 eV (568 nm and f = 0.002). They are assigned to HOMO−4 → LUMO (35%) and HOMO → LUMO (47%) of alpha spin state transition and can be interpreted as metal to metal electronic excitation. A sharp band 408 nm shows a two theoretical excitation energy 0.5123 eV (425 nm and f = 0.0003) and 0.6695 eV (380 nm and f = 0.0001) contributed to the HOMO−2 → LUMO (23%) and HOMO−2 → LUMO (17%) assigned to π–π* transition.
In complex 2, the UV-visible absorption spectrum of 2 shows an experimental d–d band at 693 nm corresponding to dz2 → dx2−y2 transition.49 These bands contain two vertical excitations at 0.3664 eV (938 nm and f = 0.000) and 0.3049 eV (1165 nm and f = 0.0252). These transitions are mainly originated from HOMO−1 → LUMO+5 (43%) and HOMO → LUMO (28%) of alpha spin state transitions (Fig. S5†). However, the calculated electronic transitions are 0.4708 eV (650 nm and f = 0.0024) and 0.4088 eV (732 nm and f = 0.0054) contributed to 622 nm (shoulder) absorption band. These calculated transitions originate mainly from HOMO → LUMO+1/+2 of alpha spin state molecular orbital electronic transitions. The molecular orbital electronic compositions are HOMO → LUMO+2 (40%) and HOMO → LUMO+1 (84%) (Fig. S6†). On the other hand, the experimental charge transfer band shown at 378 nm originates at HOMO to LUMO +2/+3 of alpha spin state transition. These are theoretically two compositions, 0.7402 eV (374 nm and f = 0.0008) and 0.5837 eV (494 nm and f = 0.0270) are contributed to HOMO → LUMO+3 (66%) and HOMO → LUMO+2 (26%). These transitions are assigned to the ligand to metal charge transfer band. The TD-DFT method employed here describes each individual excitation as involving contributions from many occupied and unoccupied MOs and thus we report only the major contribution(s) to the transition.
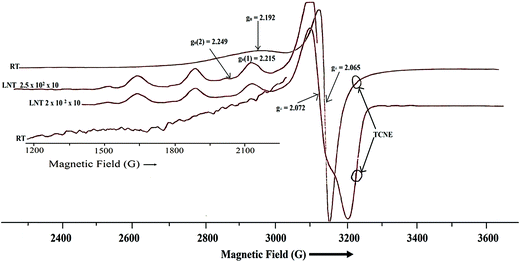
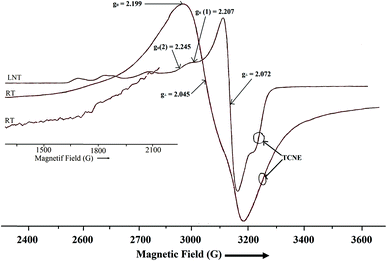
ESR spectra
The ESR spectra were recorded for polycrystalline material at RT and in DMSO solutions 3 × 10⁻³ M at LNT and are shown in Fig. 7 and 8 for complex 1 and 2, respectively. In the polycrystalline state, systems involving interaction between unpaired spins of two copper(II) nuclei (each S = 1/2) give rise to signal (S = 0) and the triplet (S = 1) states. The spin Hamiltonian (H) for S = 1 state interacting with a magnetic field (H) is defined as:
| H = gβHS + DSz2 + E(Sx2 − Sy2) − (2/3)D |
where D and E are zero field splitting parameters. The spectra of both binuclear complexes (1 and 2) are quite different in appearance (Fig. 7 and 8), with parallel and perpendicular signals unresolved at X-band frequencies. The g tensor value (g∥ and g⊥) and zero field splitting parameters are consistent with reported binuclear copper(II) complexes.88,89 The X-band spectrum of complex 1 consists of a g∥ absorption at g = 2.192 and a signal corresponding to g⊥ signal at g = 2.065 with the distorted square pyramidal geometry (τav = 0.27). Polycrystalline ESR spectrum about the copper(II) nuclei (Fig. 8), of complex 2 show two broad absorption signals (g1 = 2.045 and g2 = 2.199) corresponding anisotropic compounds of the g-value with the distorted square pyramidal geometry (τ = 0.29) Cu1(A) and square planar about Cu2(B) nuclei (Fig. 9).
 |
| | Fig. 7 ESR spectra of complex [Cu2(L1)2(HL2)2(H2O)](NO3)2·2H2O 1 in polycrystalline state (RT) and DMSO solution at LNT, in caption half field at RT. | |
 |
| | Fig. 8 ESR spectra of complex [Cu2(L1)2(HL2)2](NO3)2·H2O 2 in polycrystalline state (RT) and DMSO solution at LNT, in caption half field at RT. | |
 |
| | Fig. 9 Magnetic orbitals of the molecular models based on crystallographic structure of top: complex 1 bottom: complex 2. | |
The half-field ΔMs = 2 transitions in both complexes are very weak and appear as trailed trace (shoulder) (Fig. 7 and 8) and are apparent only after magnification of the half-field region of the spectrum. At liquid nitrogen temperature, solution spectra in DMSO were recorded and shown in Fig. 7 and 8. In the g∥ features of both complexes, it is clear that two kinds of g∥ features i.e. two kinds of copper nuclei with different structures are present in solution as also confirmed from single crystal structures (Fig. 1 and 2). In solution low temperature spectra ΔMs = 2 transitions are not observed in both complexes. The low temperature spectra of these two complexes are nearly similar and typical of magnetically coupled binuclear copper(II) complexes.88,89 The derived ESR parameters are given in Table 6. Six poorly resolved copper hyperfine lines appear on the g∥ region (ΔMs = 1) in the low temperature spectra of 1 and 2, corroborating the presence of a binuclear structure in solution. The presence of copper hyperfine splitting (A∥) of spacing 75 G in 1 and 80 G in 2 also are consistent with retention of a binuclear structure in solution. The derived ESR parameters are presented in Table 6. The value of zero-field splitting parameter are also evaluated and presented in the same Table 6. The value of D is consistent with other earlier reported binuclear copper(II) complexes.90–92 Low temperature ESR spectra of square pyramidal complexes are characterized by axial with g∥ > g⊥ > 2.03.93–95 The value of g∥ and g⊥ of complex 1 and 2 will in consistent with dx2−y2 based ground state.96 The measured values g∥, g⊥, A∥ and g∥/A∥ (Table 6), indicating a rather square pyramidal geometry with a dx2−y2 ground state. The spectra are very similar to that of other Cu–Cu binuclear complexes having a similar g∥/A∥ value.96–98 Low temperature ESR spectra are indicative of the  unit and are different from that of a mononuclear copper(II) complexes.99 The g∥ regions of the spectra of both complexes between ∼2500 and 3050 G are very different to interpret, due to presence of inequivalent two copper nuclei as confirmed by single crystal X-ray analysis (Fig. 1 and 2). For equivalent copper nuclei, the g∥ region should contain four evenly spaced lines.100 The G values of the present complexes (3.2 ± 0.3 < 4.0) indicate a dx2−y2 ground state having a weak exchange coupling which may be propagated through
  core.101,102 Since the spectrum of 1 is nearly similar to that of 2, indicating that these complexes are isostructural and show similar magnetic feature.
Table 6 ESR parameters of copper(II) complexes 1 and 2
| Parameter DMSO at 77 K |
1 |
2 |
| g∥ (1) |
2.215 |
2.207 |
| g∥ (2) |
2.249 |
2.245 |
| g⊥ |
2.072 |
2.072 |
| A∥ (G) (1) |
160 |
160 |
| A∥ (G) (2) |
167 |
135 |
| G (1) |
3.052 |
2.927 |
| G (2) |
3.340 |
3.486 |
| K∥ (1) |
0.157 |
0.146 |
| K∥ (2) |
0.168 |
0.160 |
| K⊥ |
0.179 |
0.172 |
| f (cm−1) (1) |
148.160 |
174.889 |
| f (cm−1) (2) |
144.166 |
177.916 |
| λmax (nm) |
760 |
693 |
| D (cm−1) |
0.007 |
0.011 |
Electrochemistry of the complexes
The redox behavior of the complexes was explored using cyclic voltammetry (CV) and differential pulse voltammetry (DPV). Cyclic voltammograms of 1 and 2 in DMSO 3 × 10⁻³ M were recorded at ambient temperature with TBAP as supporting electrolyte in nitrogen atmosphere. Cyclic voltammograms (scan rate 300 mV s−1) are shown in Fig. 10 and redox properties are summarized in Table 7. Both complexes showed the similar voltammograms. In both complexes two irreversible reduction process (process I) vs. Ag/AgCl reference, both involving an identical number of electrons as revealed from DPV experiments (Fig. 10), it has been observed that DPV is a very good technique for resolving redox responses having small differences in peak potentials, provided the two peaks differ in their formal potential by more than 180 mV.103,104 The Cu(II)/Cu(I) couple appears ∼0.18 V with respect to the Ag/AgCl electrode and in most cases in the CV experiments the two Cu(II)/Cu(I) couples are not resolved, though in DPV these two couples are sometimes resolved. Extra peaks (cathodic waves) observed in DPV spectrum may be due to reduction of ligand moiety. A comparison of the electrochemical properties (in Table 7) indicates that the process I in 1 and 2 is due to a one electron reduction involving the square pyramidal copper site, while the reduction at more negative potential (process II) involve square pyramidal/square planar copper centers corresponding to the CuIICuII ⇌ CuIICuI ⇌ CuICuI redox couples.84 The oxidation potentials of complex 1 are more negative than 2 presumably due to some structural changes involve (Fig. 1 and 2). These kinds of observations are indicative of significant metal coupling for both complexes.105,106 The reduction potentials observed for complexes 1 and 2 are in agreement with those reported in literature.13,107 The observed redox couples are irreversible with peak separation ∼250 V. The stability of the mixed valent complexes is expressed by the conproportionation constant (Kcon) for the following equilibrium
was estimated using the relationship logKcon = 16.9(ΔE1/2).108–111 The observed value of Kcon for both complexes is given in Table 7. From Table 7, it is evident that the large Kcon values indicate that the addition of a second electron is most difficult than the first electron and the CuIICuI mixed valence species is stable with respect to conproportionation. This kind of observation is more common in several binuclear complexes.112–114 The value of Kcon for complex 1 was found 2.9 × 10⁻¹ compared to the value of Kcon (1.8 × 10⁻¹) for complex 2 which firms that complex 1 is more stable.
 |
| | Fig. 10 Top: cycle voltammograms of 1 and 2 in DMSO at a Ag/AgCl electrode with scan rate 300 mV s−1 and temperature 20 °C. Bottom: Differential pulse voltammogram of 1 and 2 at room temperature using a scan rate 20 mV s−1 in DMSO. The pulse amplitude is 50 mV. | |
Table 7 Electrochemical data for binuclear copper(II) complexes 1–2 in DMSO (3 × 10⁻³ M) containing 0.1 M TBAP as a supporting electrolyte
| Complex |
Epc1 (V) |
Epa1 (V) |
Epc2 (V) |
Epa2 (V) |
DEpc1 (V) |
DEpc2 (V) |
ΔDpc (V) |
E1/21 (V) |
E1/22 (V) |
Kcon |
| 1 |
0.142 |
0.313 |
−0.480 |
−0.222 |
0.192 |
−0.444 |
0.636 |
0.171 |
0.258 |
2.9 × 10⁻¹ |
| 2 |
0.126 |
0.376 |
−0.188 |
−0.013 |
0.176 |
−0.104 |
0.280 |
0.250 |
0.175 |
1.8 × 10⁻¹ |
Magneto structural correlation
Variable-temperature magnetic susceptibility data for complexes 1 and 2 were carried out in the temperature range 2–300 K. The plots of χM vs. temperature for both complexes are shown in Fig. 11 and 12, respectively. The χM values for both complexes from 200 K to 100 K remain constant and then increase slowly down to 50 K and thereafter increases more rapidly to reach the value of 0.001010 for 1 and 0.0001234 emu for 2 at 3 K and no maximum was observed, indicating the presence of weak antiferromagnetic interactions between the two copper atoms. The χM and χM−1 vs. T plots of complexes 1 and 2 were fitted to the Curie–Weiss law χM = C/(T − Θ) using the parameters C = 0.91 cm3 K mol−1 and Θ = 0.06 K, indicating very weak magnetic coupling (Fig. 11 and 12). Complexes with double (OR) groups have been extensively studied. It is well known that the magnetic behavior of divalent copper complexes bridged equatorially by a pair of hydroxide,115–117 alkoxide,118–120 or phenoxide121–123 oxygen atoms is highly dependent on the Cu–O–Cu bridged angle. Also it can be influenced but in smaller measure by the Cu–O (bridge) distance, the Cu–Cu separation, dihedral angles offered by two coordination planes and the planarity of bridging oxygen atoms. The small values of the magnetic exchange coupling constant (J) found can be understood in terms of the geometrical distortions, which affect the copper coordination spheres, the geometries of the bridges and the planarity on the bridged core (Cu⋯O). To estimate a magnitude of magnetic exchange interaction (J) between the two copper(II) ions (S = 1/2 spins) the isotropic Heisenberg-Dirac-Van-Vleck isotropic Hamiltonian formalism was used.
 |
| | Fig. 11 Temperature dependence of χM, in caption: χM−1 for complex [Cu2(L1)2(HL2)2(H2O)]2NO3·2H2O 1. Circles (○) represent the experimental results and solid line correspond to the fit with Curie–Weiss equation. | |
 |
| | Fig. 12 Temperature dependence of χM, in caption: χM−1 for complex [Cu2(L1)2(HL2)2]2NO3·H2O 2. Circles (○) represent the experimental results and solid line correspond to the fit with Curie–Weiss equation. | |
The magnetic data was analyzed using a classical Bleaney–Bowers equation.124
where
NA,
kB,
β and
g are the Avogadro number, the Boltzmann constant, the Bohr magneton and
g-factor, respectively. This law gives the magnetic susceptibility as a function of temperature per atoms for dimeric nature of copper(
II) complexes. The best of the data gives
J = −12.90 cm
−1 and
g = 1.99 for
1 and
g = 1.99 and
J = −12.97 cm
−1 for
2, respectively. The theoretical magnetic orbitals for both complexes
1 and
2 are shown in
Fig. 9. The derived Mulliken spin density (
e) values from spin density plot (
Fig. 9) are shown in
Table 8. Only the spin densities at the metallic atoms and O-atoms of the μ-alkoxo bridges are presented. For both complexes, one exchange path way, with significant overlays, is found. From the
Scheme 4, it is clear that the exchange pathway may be resulted as a σ/π pathway involving the plane alkoxo p-orbitals and the metal d-orbitals. For the present complexes, the weak antiferromagnetic coupling between the two Cu(
II) centers (
J = −12.90 cm
−1 for
1 and
J = −12.97 cm
−1 for
2) are in agreement with the fact that the μ-alkoxo groups can interact with the unpaired electrons in the d
x2−y2 orbitals (
τ < 0.5) around Cu(1) and Cu(2) (
Scheme 4). The bridging O atoms also have a small d-spin density in high spin state (
Table 8), indicating that bridges are involved in the magnetic coupling mechanism. Their observations indicate that the exchange interaction in the complexes found in mediated by the superexchange mechanism
via the O atoms of the μ-alkoxo bridges. The HOMO orbital is a symmetric d
Cu–d
Cu orbital combination whereas the LUMO orbital is a d
Cu–d
Cu antisymmetric combination. The observation of antiferromagnetic interactions for a μ-alkoxo bridged copper(
II) complexes are rather exceptional. These complexes belong to the well documented family of derivatives for two copper centers and are linked through oxygen atoms of alkoxo bridged structures.
71–126
Table 8 Mulliken spin density (high spin) for complex 1 and 2
| Atom |
1 |
2 |
| Cu(1) |
0.1468 |
0.4512 |
| Cu(2) |
0.2744 |
0.5051 |
| O(1B) |
−0.2279 |
0.2143 |
| O(1D) |
−0.2238 |
0.1384 |
 |
| | Scheme 4 Schematic representation of the orientation of orbitals in complex 1 and 2. | |
Electronic structure and DFT calculations
B3LYP-6-31G(d,p) level of calculations of the molecules have been carried out to understand the electronic structure of complexes. The structural agreement has been verified on the comparing the bond distances and angles between the DFT optimized and X-ray determined structures of complexes 1 and 2 (Tables 2 and 3). According to Tables 2 and 3, the optimized bond lengths and angles are slightly larger than the experimental ones since the theoretical calculations were performed on isolated molecules in gas phase, whereas the experimental results were obtained in solid state.127–129 The energy gap in the copper(II) complexes with d9 configuration from HOMO to LUMO in alpha and beta orbitals are −0.356 eV and −1.254 eV for 1 and −1.463 eV and −1.759 eV for 2, respectively. The energy gap between the HOMO–LUMO orbitals indicates the molecular chemical stability.130 A large HOMO–LUMO gap indicates stable molecule with low chemical reactivity.131 The energy gap between the HOMO–LUMO is important to determine the electrical transport properties of molecules.132 Thus, the complex 2 is more active than 1. The metal ligand percentages of some selected orbitals are collected in Tables S2 and S3† for 1 and 2, respectively. The 3D counter plots of some selected molecular orbitals (α-spin and β-spin) of 1 and 2 have been shown in Fig. S3 and S4.† The highest energy occupied molecular orbitals (α and β spin) are concentrated on coordinated ligand (L) for 1. For complex 1, the α-spin higher energy occupied molecular (HOMO) has 92% π(L) character along with reduced contribution 8 (%) of dπ(Cu) molecular orbitals (Table S2†). The HOMO−1 to HOMO−4 (α-spin) have 97–72% π(L) character, while HOMO−5–HOMO−9 (α-spin) have mixed π(L) and dπ(Cu) character. The unoccupied molecular LUMO–LUMO+9 (α-spin) have 95–100% π(L) character except LUMO+2 and LUMO+4 have mixed π(L) and dπ(Cu) character (Table S2 and Fig. S3†). The β-spin (for 1) unoccupied orbitals (LUMO to LUMO+4) have mixed π(L) character along with reduced contribution from dπ(Cu) molecular orbital (Table S2†). The β-spin occupied molecular orbital HOMO to HOMO−4 have reduced π(L) character, while HOMO−5 to HOMO−9 have mixed π(L) and dπ(Cu) character except HOMO−7 has major concentrated π(L) character. For complex 2, unoccupied and occupied molecular orbitals of α and β spin states are concentrated on 100% π(L) character, except HOMO molecular orbital in both spin states have 100% dπ(Cu) character (Table S3 and Fig. S4†). The β-spin state of complex 2, HOMO−1 has 80% dπ(Cu) character along with reduced contribution of 20% π(L) character.
Kinetic studies for the oxidation of 3,5-di-tert-butylcatechol (catecholase-like activity)
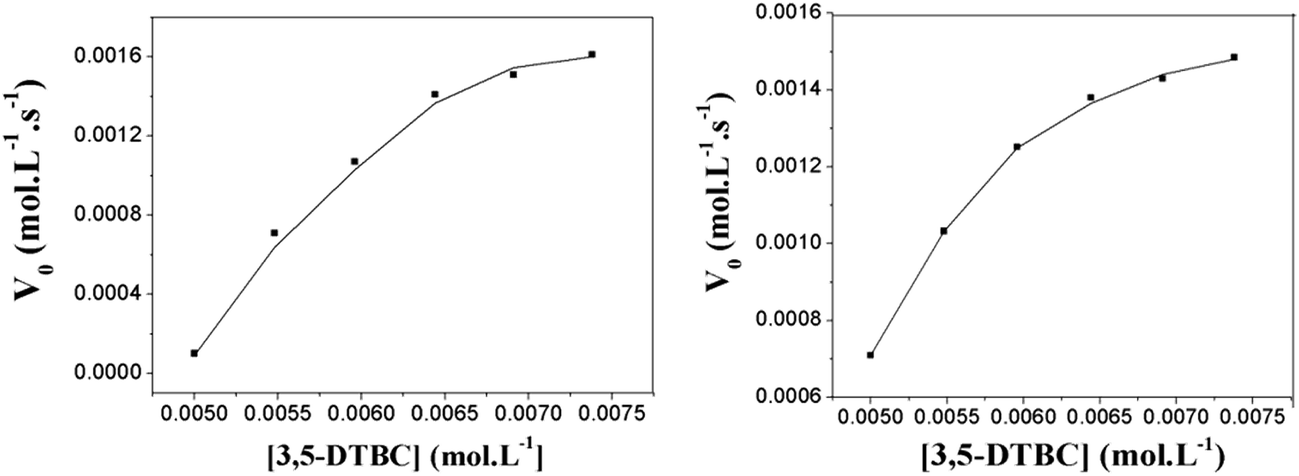
The catecholase-like activity of the present binuclear copper(II) complexes was determined by the catalytic oxidation of 3,5-dtbc (Scheme 5). Catechol oxidases are type III copper proteins which act as catalysts in the oxidation of catechols to quinones in the presence of molecular oxygen.133 The catechol oxidation reaction is first order with respect to the substrate and follows Michaelis–Menten kinetics. The kinetic studies of the oxidation of 3,5-dtbc by complexes 1 and 2 were performed to understand the extent of the catalytic efficiency. To check the ability of the Cu(II) complexes as catalysts for the catecholase like activity, a 100 μL of the substrate 3,5-dtbc under aerobic condition (0.165 M) was added to a solution containing 100 μL of complex (2.4 × 10⁻³ M), 100 μL of the buffer solution (5 × 10⁻⁴ M) pH 8.0; 3 mL of oxygenated methanol, in a spectrophotometric cell at 25 °C. The course of the reaction was followed by UV-vis spectroscopy and the time dependent spectral scans of both the complexes are shown in Fig. 13. Both complexes behave similarly, showing a smooth conversion of 3,5-dtbc to 3,5-dtbq. The kinetics of the 3,5-dtbc oxidation was determined by monitoring the increase of the product 3,5-dtbq. It was found that under anaerobic conditions only 1 equiv. of 3,5-dtbq is formed and when oxygen is bubbled into the solution, the catalytic activity is regenerated, indicating that the catalyst is still active and that oxygen must participate directly in the catalytic cycle of the oxidation reaction, acting as a thermodynamic driving force by reoxidizing any copper(I) species and regenerating them to the active copper(II) species. Both complexes showed saturation kinetics and a treatment based on the Michaelis–Menten model seemed to be appropriate. Saturation kinetics was obtained at pH 8.5. The graph of the initial reaction rates (V0) vs. 3,5-dtbc concentrations shows a saturation profile (Fig. 14). This dependence of the rate on the substrate concentration suggests that the oxidation reaction occurs with the formation of an intermediate substrate/complex.
 |
| | Scheme 5 Possible mechanism of 3,5-dtbc oxidation by complex 1 same as 2. | |
 |
| | Fig. 13 The change of UV-vis spectral behaviour at regular intervals of time left: complex 1 and right: complex 2. | |
 |
| | Fig. 14 Dependence of the reaction rates on the 3,5-dtbc concentrations for the oxidation reaction catalysed by complexes. Left complex 1 and right complex 2. | |
The Michaelis–Menten model was applied to characterize the kinetic behaviour of complexes 1 and 2. Different kinetic parameters are shown in Table 9. On perusal of enzyme kinetic parameters, it is evident that, complex 2 is more effective in the conversion of 3,5-dtbc to the quinine (3,5-dtbq), with a catalytic efficiency of 834.01 M−1 s−1 compared to 416.66 M−1 s−1 observed for complex 1 with respect to the enzyme catalytic turnover number (kcat), the reactivity of complex 2 is greater than complex 1 as a result of a higher turnover rate (2.2 × 10⁻³ h−1). This is reflection of its substrate–catalyst binding constant (kass = 1.4 × 10³ M L−1), which is higher in comparison to that observed for complex 1 (Table 9). Non planar complexes, which have coordination geometries that are intermediate between trigonal bipyramidal and square pyramidal are considered more active than square planar complexes.134–136 At the same time, exogenous ligands also play a vital role owing to the fact that weakly coordinating ligands will be easily displaced by the incoming catechol, thus enhancing the enzymatic activity.30 The geometry of complex 2 is different than complex 1. In this complex nitrate and water molecules are weakly coordinated and six coordinate octahedral geometry is completed in both Cu(II) centers. The weakly coordinated water molecule was easily displaced by the incoming catechol thus enhancing the enzymatic activity.30 The probable structure of complex-substrate intermediates are depicted in Scheme 6.
Table 9 Kinetic parameters for the oxidation reaction of 3,5-dtbc catalyzed by complexes 1 and 2 at pH 8.03 and 25 °C
| Complex |
Vmax (mol L−1 s−1) |
KM (M L−1) |
kass (M−1 L) |
kcat (s−1) |
TOF (h−1) |
kcat/KM (M−1 s−1) |
| 1 |
1.6 × 10⁻³ |
8.4 × 10⁻⁴ |
1.2 × 10³ |
0.3513 |
1.3 × 10⁻³ |
416.66 |
| 2 |
1.4 × 10⁻³ |
1.4 × 10⁻⁴ |
1.4 × 10³ |
0.6171 |
2.2 × 10⁻³ |
834.01 |
 |
| | Scheme 6 Probable structure of complex-substrate intermediates. | |
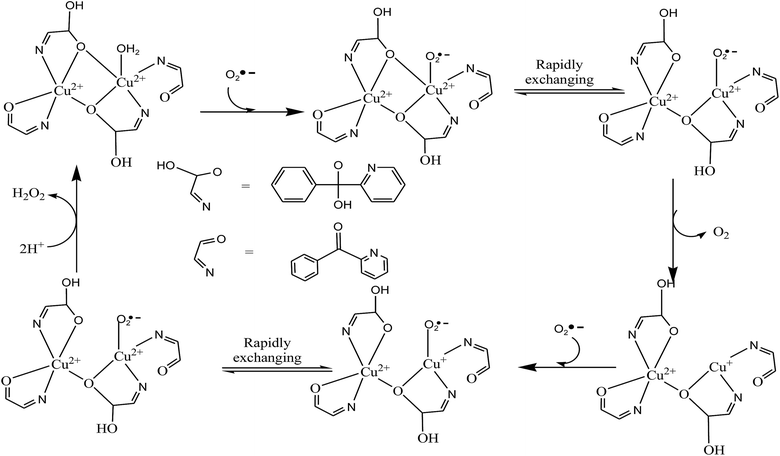
SOD activity
The SOD mimetic activities of these complexes have been evaluated and presented in Table 10. The SOD activities of the complexes were evaluated by the NBT assay23–26 following the reduction of NBT to MF+ kinetically at 560 nm. These complexes exhibit significant catalytic activity toward the dismutation of superoxide anions. The concentration to attain 50% inhibition of the NBT reduction defined as IC50 were estimated for complexes 1 and 2. The observed IC50 values of the present complexes were compared with earlier SOD mimics so for reported24–26,30,84,137 (Table 10) and the value of the native SOD is also given for the comparison (note that the higher the IC50 value, the less SOD activity). The IC50 value of complex 2 (35 μmol) is less than 1 (38 μmol). Thus, the complex 2 is more SOD active than 1. The difference in IC50 value between 1 and 2 may be ascribed to the presence of weakly coordinated nitrate ion and water molecule in complex 2 around copper centers, thus favouring ligand exchange and interaction with substrate. The same trend of biological activity is also verified from DFT calculations. The catalytic function of the stable alkoxo bridge can be understood according to the mechanism suggested in literature138,139 (Scheme 7). The disproportionation of O2˙− may take place in following steps: first, O2˙− displaces a H2O, binds directly to the copper(II) ion and gives up its electron. Second, the O2˙− binding directly to the copper(II) ion can be exchange rapidly between the axial and the planar position of the distorted square pyramid, leading it to give up its electron and form an O2 molecule. Third, the alkoxo bridge breaks and the electrically neutral oxygen molecule leaves. The O atom of alkoxo bridge gets its proton from bulk solvent and copper(II) reduce to copper(I). Four, a second O2˙− binds again to the copper(I) ion to accept an electron and a proton from the buffer. The second O2˙− oxidizes Cu(I) to Cu(II) and Cu(II)–Cu(II) species form. These two species containing Cu(II)–Cu(II) and Cu(II)–Cu(I) centers remain in equilibrium. Since the proton exchange between the substrates and buffer is a rapid process, the O2˙− further combines another proton from the solution to form a H2O2 molecule. Finally, the alkoxo bridge re-forms and electrically neutral H2O2 leaves from the system, completing a catalytic cycle.
Table 10 SOD activities (IC50 values) of Cu(II) complexes
| Complex |
IC50 (μmol dm−3) |
SOD activity (μM−1) |
kcat (M−1 s−1) |
Ref. |
| [(Bipy)2Cu-Im-Cu(Bipy)2](ClO4)3·CH3OH |
22 |
45.45 |
15.12 |
26 |
| [(L1)Cu(μ-CH3COO)2Cu(L1)]·4,4-bipy |
52 |
19.23 |
6.39 |
24 |
| [(L2)Cu(μ-NO3)2Cu(L2)] |
58 |
17.24 |
5.73 |
24 |
| [(L)Cu(μ-CH3COO)2Cu(L)] |
35 |
28.57 |
9.50 |
25 |
| [(L)Cu(μ-NO3)2Cu(L)] |
26 |
38.46 |
12.79 |
25 |
| [Cu2(bdip)(CH3CN)2](ClO4)3·CH3CN·3H2O |
0.32 |
3125.00 |
1039.50 |
84 |
| [Cu2(Me4bdpi)(H2O)2](ClO4)3·4H2O |
1.1 |
909.09 |
302.40 |
84 |
| [Cu(im)Cu(pip)2]3+ |
0.50 |
2000.00 |
665.28 |
137 |
| [Cu2(npzbiap)Cl3] |
0.52 |
1923.07 |
639.69 |
30 |
| Native Cu,Zn-SOD |
0.04 |
25000.00 |
8316.00 |
137 |
| [Cu2(L1)2(HL2)2(H2O)](NO3)2·2H2O |
38 |
26.31 |
8.75 |
Present work |
| [Cu2(L1)2(HL2)2](NO3)2·H2O |
35 |
28.57 |
9.50 |
Present work |
 |
| | Scheme 7 Systematic diagram of O2˙− dismutation reaction catalyzed by 1 steering the O2˙− to the Cu2+. | |
The catalytic rate constant (kcat) was also evaluated of these complexes. The kinetic catalytic constant kcat was obtained by the equation kcat = kNBT ×[NBT]/IC50, where kNBT = 5.94 × 10⁴ (mol L−1)−1 s−1 is the second order rate constant for NBT.140,141 The disproportionation constant (kcat) of 1 and 2 are 8.75 × 10⁴ (mol L−1)−1 s−1 and 9.50 × 10⁴ (mol L−1)−1 s−1 respectively. The value of catalytic rate constants (kcat) for superoxide disproportionation clear indicate that present complexes can be used as superoxide scavenger. Comparison of kcat of complexes 1 and 2 reveals that the geometry around copper contributes to modulate SOD activity, with 2 being the best suited to react with superoxide. Our observation suggested the conclusion that the coordinated nitrate ion and water molecule present around the copper centers in the complex 2 is indeed essential for high SOD activity and can steer the superoxide substrate to and from the active copper ion.
Correlation between kcat and electrochemical property of the complexes
The catalytic properties of the complexes depend on electronic effect reflected by their redox potential values. A good correlation was found in between electrochemical parameter ΔE (ΔE = Epc1 − Epc2) and kinetic parameter (turnover number kcat/KM). ΔEp is an important parameter since it represents how readily the metal centers accept the electron pair from the 3,5-dtbc in the oxidation reaction. The DPV peaks potentials were more accurately measured than that of CV peaks, we have taken the DPV peak potentials for our attempted correlation study with the kcat values. The two Cu(II)/Cu(I) potentials were observed in DPV. We have taken an average value of the two potentials for correlation purpose, the ΔDpc 0.636 and 0.280 V for 1 and 2, respectively were found. The smaller value of ΔDpc complex of 2 may be responsible for higher catalytic ability of this complex.
Conclusions
The two alkoxo copper(II)–copper(II) bridged complexes 1 and 2 that have been synthesized by metal assisted hydrolysis of N′-[(E)-phenyl(pyridin-2-yl)methylidene]furan-2-carbohydrazide and N′-[(E)-phenyl(pyridin-2-yl)methylidene]acetohydrazide appear to be good models for catechol oxidase and superoxide dismutase. The molecular structures of complexes 1 and 2 consist of gem-diols. Low temperature magnetic susceptibility revealed that the copper(II) centers in 1 and 2 are antiferromagnetically coupled (J = −12.90 cm−1 for 1 and −12.97 cm−1 for 2). Electrochemical studies of binuclear complexes 1 and 2 showed two irreversible waves CV and DPV observations reveal that oxidation of 3,5-dtbc to 3,5-dtbq catalyzed by binuclear copper(II) complexes 1 and 2 proceed by two steps: first semiquinone followed by benzoquinone with concomitant reduction of Cu(II) to Cu(I). Kinetic studies revealed that 1 and 2 are efficient catalysts in the oxidation of 3,5-dtbc to 3,5-dtbq by O2. Complex 2 being the more active because it is the stronger oxidant compared to 1. In addition, complexes were shown to efficiently catalyze the dismutation of O2−. Observations suggest the conclusion that the coordinated nitrate ion and water molecule present around the copper centers in the complex 2 is indeed essential for high SOD activity and can steer the superoxide substrate to and from the active copper ion.
Acknowledgements
RSIC (SAIF) IIT, Bombay for ESR measurements and SAIF, Central Drug Research Institute, Lucknow India, are thankfully acknowledged for providing analytical and spectral facilities. UGC-DAE Indore for, low temperature magnetic measurements. We are grateful to MP Council of Science & Technology, Bhopal, India, [Scheme No. A/RD/RP-2/2015-16/245] for their financial support. Dr Matthias Zeller for the collection of diffraction data and NSF Grant CHE 0087210, Ohio Board of Regents Grant CAP-491 by Youngstown State University for funds to purchase the X-ray diffractometer for partial funding of this research are also gratefully acknowledged.
References
- Q. Lawrence Jr and D. Yanhong, Acc. Chem. Res., 1996, 29(4), 190–196 CrossRef.
- I. S. Edward, T. C. Brunold, M. I. Davis, J. N. Kemsley, S.-K. Lee, N. Lehnert, F. Neese, A. J. Skulan, Y.-S. Yang and J. Zhou, Chem. Rev., 2000, 100, 235–250 CrossRef.
- S. Saito and Y. Yamamoto, Chem. Rev., 2000, 100, 2901–2916 CrossRef CAS PubMed.
- T. Yau Luh, M.-k. Leung and K.-T. Wong, Chem. Rev., 2000, 100, 3187–3204 CrossRef.
- R. B. Steven and D. Dong, Chem. Rev., 1998, 98, 1997–2011 CrossRef.
- S. T. Frey, N. N. Murthy, S. T. Weintraub, L. K. Thompson and K. D. Karlin, Inorg. Chem., 1997, 36, 956–957 CrossRef CAS PubMed.
- G. Kolks, S. J. Lippard, J. V. Waszczak and H. R. Lilienthal, J. Am. Chem. Soc., 1982, 104, 717–725 CrossRef CAS.
- P. V. Bernhardt and L. A. Jones, Chem. Commun., 1997, 655–656 RSC.
- L. Walz, H. Paulus, W. Haase, H. Langhof and F. Nepveu, J. Chem. Soc., Dalton Trans., 1983, 657–664 RSC.
- L. P. Wu, T. K. Sowa, M. Maekawa, Y. Suenaga and M. Munakata, J. Chem. Soc., Dalton Trans., 1996, 2179–2180 RSC.
- H. Zhang, D. Fu, F. Ji, G. Wang, K. Yu and T. Yao, J. Chem. Soc., Dalton Trans., 1996, 3799–3803 RSC.
- P. A. Vigato, S. Tamburini and D. E. Fenton, Coord. Chem. Rev., 1990, 106, 25–170 CrossRef CAS.
- R. E. H. M. B. Osório, R. A. Peralta, A. J. Bortoluzzi, V. R. de Almeida, B. Szpoganicz, F. L. Fischer, H. Terenzi, A. S. Mangrich, K. Mary Mantovani, D. E. C. Ferreira, W. R. Rocha, W. Haase, Z. Tomkowicz, A. dos Anjos and A. Neves, Inorg. Chem., 2012, 51, 1569–1589 CrossRef PubMed.
- M. Mugnai, G. Cardini, V. Schettino and C. J. Nielsen, Mol. Phys., 2007, 105, 2203–2210 CrossRef CAS.
- H. E. Krizner, D. O. De Haan and J. Kua, J. Phys. Chem. A, 2009, 113, 6994–7001 CrossRef CAS PubMed.
- H. J. Buschmann, E. Dutkiewicz and W. Knoche, Ber. Bunsenges. Phys. Chem., 1982, 86, 129–134 CrossRef CAS.
- G. Fischer, S. Flatau, A. Schellenberger and A. Zschunke, J. Org. Chem., 1988, 53, 214 CrossRef CAS.
- M. Becker, Ber. Bunsen-Ges., 1964, 68, 669–674 CrossRef CAS.
- M. Becker and H. Strehlow, Z. Elektrochem., 1960, 64, 813–823 CAS.
- H. J. Buschmann, H. H. Fuldner and W. Knoche, Ber. Bunsenges. Phys. Chem., 1980, 84, 41–49 CrossRef CAS.
- P. Bradford, R. C. Hynes, N. C. Payne and C. J. Willis, J. Am. Chem. Soc., 1990, 112, 2647–2654 CrossRef CAS.
- H. Sartzi, G. S. Papaefstathiou, V. Psycharis, A. Escuer, S. P. Perlepes and C. C. Stoumpos, Polyhedron, 2010, 29, 100–109 CrossRef CAS.
- R. N. Patel, N. Singh, K. K. Shukla, U. K. Chauhan, S. Chakraborty, J. Niclos-Gutierrez and A. Castineiras, J. Inorg. Biochem., 2004, 98, 231–237 CrossRef CAS PubMed.
- R. N. Patel, Inorg. Chim. Acta, 2010, 363, 3838–3846 CrossRef CAS.
- R. N. Patel, D. K. Patel, V. P. Sondhiya, K. K. Shukla, Y. Singh and A. Kumar, Inorg. Chim. Acta, 2013, 405, 209–217 CrossRef CAS.
- R. N. Patel, N. Singh, K. K. Shukla, V. L. N. Gundla and U. K. Chauhan, J. Inorg. Biochem., 2005, 99, 651–663 CrossRef CAS PubMed.
- P. Chakraborty, J. Adhikary, B. Ghosh, R. Sanyal, S. K. Chattopadhyay, A. auzá, A. Frontera, E. Zangrando and D. Das, Inorg. Chem., 2014, 53, 8257–8269 CrossRef CAS PubMed.
- J. Mukherjee and R. Mukherjee, Inorg. Chim. Acta, 2002, 337, 429–438 CrossRef CAS.
- S. Mandal, J. Mukherjee, F. Lloret and R. Mukherjee, Inorg. Chem., 2012, 51, 13148–13161 CrossRef CAS PubMed.
- I. A. Koval, P. Gamez, C. Belle, K. Selmeczi and J. Reedijk, Chem. Soc. Rev., 2006, 35, 814–840 RSC.
- B. P. Murphy, Coord. Chem. Rev., 1993, 124, 63–105 CrossRef CAS.
- G. Tabbi, W. L. Driessen, J. Reedijk, R. P. Bonomo, N. Veldman and A. L. Spek, Inorg. Chem., 1997, 36, 1168–1175 CrossRef CAS PubMed.
- R. L. Rusting, Sci. Am., 1992, 267, 88–95 CrossRef.
- D. M. Moreno, M. A. Marti, P. B. De Biase, D. A. Estrin, V. Demicheli, R. Radi and I. Boechi, Arch. Biochem. Biophys., 2011, 507, 304–309 CrossRef CAS PubMed.
- B. Machura, I. Nawrot and K. Michalik, Polyhedron, 2012, 31, 548–557 CrossRef CAS.
- B. Machura, I. Nawrot, R. Kruszynski and M. Dulski, Polyhedron, 2013, 54, 272–284 CrossRef CAS.
- F. Neese, Coord. Chem. Rev., 2009, 253, 526–563 CrossRef CAS.
- M. Ray, R. Mukherjee, J. F. Richardson, M. S. Mashuta and R. M. Buchanan, J. Chem. Soc., Dalton Trans., 1994, 965–969 RSC.
- A. K. Patra, M. Ray and R. Mukherjee, J. Chem. Soc., Dalton Trans., 1999, 2461–2466 RSC.
- A. K. Patra, M. Ray and R. Mukherjee, Inorg. Chem., 2000, 39, 652–657 CrossRef CAS PubMed.
- C. Fernandes, A. Neves, A. J. Bortoluzzi, A. S. Mangrich, E. Rentschler, B. Szpoganicz and E. Schwingel, Inorg. Chim. Acta, 2001, 320, 12–21 CrossRef CAS.
- G. M. Sheldrick, SADABS (Version 2.03), University of Gottingen, Germany, 2002 Search PubMed.
- SMART (V 5.628), SAINT (V 6.45a), XPREP, SHELXTL, Bruker AXS Inc., Madison, WI, 2004 Search PubMed.
- G. M. Sheldrick, Acta Crystallogr., Sect. A: Found. Crystallogr., 2008, 64, 112–122 CrossRef CAS PubMed.
- A. L. Spek, Acta Crystallogr., Sect. D: Biol. Crystallogr., 2009, 65, 148–155 CrossRef CAS PubMed.
- L. J. Farrugia, J. Appl. Crystallogr., 1997, 30, 565 CrossRef CAS.
- L. J. Farrugia, J. Appl. Crystallogr., 1999, 32, 837–838 CrossRef CAS.
- A. D. Becke, J. Chem. Phys., 1993, 98, 5648–5652 CrossRef CAS.
- C. Lee, W. Yang and R. G. Parr, Phys. Rev. B: Condens. Matter Mater. Phys., 1988, 37, 785–789 CrossRef CAS.
- G. A. Petersson, A. Bennett, T. G. Tensfeldt, M. A. Al-Laham, W. A. Shirley and J. Mantzaris, J. Chem. Phys., 1988, 89, 2193–2218 CrossRef CAS.
- G. A. Petersson and M. A. Al-Laham, J. Chem. Phys., 1991, 94, 6081–6090 CrossRef CAS.
- P. J. Hay and W. R. Wadt, J. Chem. Phys., 1985, 82, 270–283 CrossRef CAS.
- W. R. Wadt and P. J. Hay, J. Chem. Phys., 1985, 82, 284–298 CrossRef CAS.
- P. J. Hay and W. R. Wadt, J. Chem. Phys., 1985, 82, 299–310 CrossRef CAS.
- M. J. Frisch, G. W. Trucks, H. B. Schlegel, G. E. Scuseria, M. A. Robb, J. R. Cheeseman, G. Scalmani, V. Barone, B. Mennucci, G. A. Petersson, H. Nakatsuji, M. Caricato, X. Li, H. P. Hratchian, A. F. Izmaylov, J. Bloino, G. Zheng, J. L. Sonnenberg, M. Hada, M. Ehara, K. Toyota, R. Fukuda, J. Hasegawa, M. Ishida, T. Nakajima, Y. Honda, O. Kitao, H. Nakai, T. Vreven, J. A. Montgomery Jr, J. E. Peralta, F. Ogliaro, M. Bearpark, J. J. Heyd, E. Brothers, K. N. Kudin, V. N. Staroverov, R. Kobayashi, J. Normand, K. Raghavachari, A. Rendell, J. C. Burant, S. S. Iyengar, J. Tomasi, M. Cossi, N. Rega, J. M. Millam, M. Klene, J. E. Knox, J. B. Cross, V. Bakken, C. Adamo, J. Jaramillo, R. Gomperts, R. E. Stratmann, O. Yazyev, A. J. Austin, R. Cammi, C. Pomelli, J. W. Ochterski, R. L. Martin, K. Morokuma, V. G. Zakrzewski, G. A. Voth, P. Salvador, J. J. Dannenberg, S. Dapprich, A. D. Daniels, O. Farkas, J. B. Foresman, J. V. Ortiz, J. Cioslowski and D. J. Fox, Gaussian 09, Revision D.01, Gaussian Inc., Wallingford CT, 2009 Search PubMed.
- R. Bauernschmitt and R. Ahlrichs, Chem. Phys. Lett., 1996, 256, 454–464 CrossRef CAS.
- V. Barone and M. Cossi, J. Phys. Chem. A, 1998, 102, 1995–2001 CrossRef CAS.
- M. Cossi and V. Barone, J. Chem. Phys., 2001, 115, 4708–4717 CrossRef CAS.
- M. Cossi, N. Rega, G. Scalmani and V. Barone, J. Comput. Chem., 2003, 224, 669–681 CrossRef PubMed.
- E. J. Baerends, D. Ellis and P. Ros, Chem. Phys., 1973, 2, 41–51 CrossRef CAS.
- A. Becke, Phys. Rev. A, 1998, 38, 3098–3100 CrossRef.
- E. Van Lenthe and E. J. Baernds, J. Comput. Chem., 2003, 24, 1142–1156 CrossRef CAS PubMed.
- Y. C. Zhang, J. Y. Tang, G. L. Wang, M. Zhang and X. Y. Hu, J. Cryst. Growth, 2006, 294, 278–282 CrossRef CAS.
- L. Valencia, R. Bastida, M. C. F. Fernandez, A. Macias and M. Vicente, Inorg. Chim. Acta, 2005, 358, 2618–2628 CrossRef CAS.
- A. W. Addison, T. N. Rao, J. Reedijk, J. Van Rijn and G. C. Verschoor, J. Chem. Soc., Dalton Trans., 1984, 1349–1356 RSC.
- K. D. Karlin, A. Farooq, J. C. Hayes, B. I. Cohen, T. M. Rowe, E. Sinn and J. Zubieta, Inorg. Chem., 1987, 26, 1271–1280 CrossRef CAS.
- A. Benzekri, P. Dubourdeaux, J. M. Latour, J. Laugier and P. Rey, Chem. Commun., 1987, 1564–1565 RSC.
- G. A. van Albada, I. Mutikainen, U. Turpeinen and J. Reedijk, Polyhedron, 2006, 25, 81–86 CrossRef CAS.
- S. P. Foxon, D. Utz, J. Astner, S. Schindler, F. Thaler, F. W. Heinemann, G. Liehr, J. Mukherjee, V. Balamurugan, D. Ghosh and R. Mukherjee, Dalton Trans., 2004, 2321–2328 RSC.
- I. A. Koval, M. Huisman, A. F. Stassen, P. Gamez, O. Roubeau, C. Belle, J. L. Pierre, E. Saint-Aman, M. Luken, B. Krebs, M. Lutz, A. L. Spek and J. Reedijk, Eur. J. Inorg. Chem., 2004, 4036–4045 CrossRef CAS.
- D. Ghosh, N. Kundu, G. Maity, K.-Y. Choi, A. Caneschi, A. Endo and M. Chaudhury, Inorg. Chem., 2004, 43, 6015–6023 CrossRef CAS PubMed.
- D. Li, S. Li, D. Yang, J. Yu, J. Huang, Y. Li and W. Tang, Inorg. Chem., 2003, 42, 6071–6080 CrossRef CAS PubMed.
- D. M. Sabel, J. A. Thompson, R. Butcher and P. H. Smith, Acta Crystallogr., Sect. C: Cryst. Struct. Commun., 1996, 52, 1950–1954 CrossRef.
- S. L. Wang, J. W. Richardson, S. J. Briggs, R. A. Jacobson and W. P. Jensen, Inorg. Chim. Acta, 1986, 111, 67–72 CrossRef CAS.
- G. R. Desiraju, Crystal Engineering to Design of Organic Solids, Elsevier, Amsterdam, New York, 1989 Search PubMed.
- R. Parthasarathy, Acta Crystallogr., Sect. B: Struct. Crystallogr. Cryst. Chem., 1969, 25, 509–518 CrossRef CAS.
- R. N. Patel, V. P. Sondhiya, D. K. Patel, K. K. Shukla, D. K. Patel and Y. Singh, Indian J. Chem., Sect. A: Inorg., Phys., Theor. Anal., 2013, 52, 717–723 Search PubMed.
- A. Guha, K. S. Banu, S. Das, T. Chattopadhyay, R. Sanyal, E. Zangrando and D. Das, Polyhedron, 2013, 52, 669–678 CrossRef CAS.
- A. K. Pramanik, D. Sarkar and T. K. Mondal, Polyhedron, 2015, 102, 32–40 CrossRef CAS.
- B. J. Hathaway and D. E. Billing, Coord. Chem. Rev., 1970, 5, 143–207 CrossRef CAS.
- A. B. P. Lever, Inorganic Electronic Spectroscopy, Elsevier, New York, 2nd edn, 1984 Search PubMed.
- G. A. McLachlan, G. D. Fallon, R. L. Martin and L. Spiccia, Inorg. Chem., 1995, 34, 254–261 CrossRef CAS.
- B. J. Hathway, in Comprehensive Coordination Chemistry, ed. G. Wilkinesen, R. D. Gillard and J. A. Mccleverty. Pergamon Press, Oxford, England, 1987, vol. 5, p. 533 Search PubMed.
- H. Ohtsu, Y. Shimazaki, A. Odani, O. Yamauchi, W. Mori, S. Itoh and S. Fukuzum, J. Am. Chem. Soc., 2000, 122, 5733–5741 CrossRef CAS.
- S. Mukhopadhyay, D. Mandal, P. B. Chatterjee, C. Desplanches, J. P. Sutter, R. J. Butcher and M. Chaudhury, Inorg. Chem., 2004, 43, 8501–8509 CrossRef CAS PubMed.
- R. Cao, Q. Sun, D. Sun, M. Hong, W. Bi and Y. Zhao, Inorg. Chem., 2002, 41, 6161–6168 CrossRef CAS PubMed.
- T. M. Donlevy, L. R. Gahan, T. W. Hambley, G. R. Hanson, K. L. McMahon and R. Stranger, Inorg. Chem., 1994, 33, 5131–5137 CrossRef CAS.
- H. M. J. Hendriks, P. J. M. W. L. Birker, G. C. Verschoor and J. Reedijk, J. Chem. Soc., Dalton Trans., 1982, 623–631 RSC.
- K. J. Oberhausen, J. F. Richardson, R. M. Buchanan, J. K. McCusker, D. N. Hendrickson and J. M. Latour, Inorg. Chem., 1991, 30, 1357–1365 CrossRef CAS.
- D. Kaase, C. Gotzmann, S. Rein, Y. Lan, S. Kacprzak and J. Klingele, Inorg. Chem., 2014, 53, 5546–5555 CrossRef CAS PubMed.
- R. N. Patel, H. C. Pandey and K. B. Pandeya, Transition Met. Chem., 1999, 24, 35 CrossRef CAS.
- R. N. Patel, H. C. Pandeya and K. B. Pandeya, Indian J. Pure Appl. Phys., 1997, 35, 649–652 CAS.
- A. W. Addison, H. M. J. Hendriks, J. Reedijk and L. K. Thompson, Inorg. Chem., 1981, 20, 103–110 CrossRef CAS.
- M. Duggan, N. Ray, B. Hathaway, G. Tomilson, P. Briant and K. Plien, J. Chem. Soc., Dalton Trans., 1980, 1342–1348 RSC.
- S. Pal, A. K. Barik, S. Gupta, A. Hazra, S. K. Kar, S.-M. Peng, G.-H. Lee, R. J. Butcher, M. S. El Fallah and J. Ribas, Inorg. Chem., 2005, 44, 3880–3889 CrossRef CAS PubMed.
- G. Kolks, C. R. Frihart, P. K. Coughlin and S. J. Lippard, Inorg. Chem., 1981, 20, 2933–2940 CrossRef CAS.
- L. R. Acevedo, C. S. Lopez, C. Amero and L. Quintanar, Inorg. Chem., 2015, 54, 3788–3796 CrossRef PubMed.
- J. L. Pierre, P. Chautemps, S. Refaif, C. Beguin, A. El Marzouki, G. Serratrice, E. S. Aman and P. Rey, J. Am. Chem. Soc., 1995, 177, 1965–1973 CrossRef.
- J. Peisach and W. E. Blumberg, Arch. Biochem. Biophys., 1974, 165, 691–708 CrossRef CAS PubMed.
- J. E. Wertz and J. R. Bolton, Electron spin resonance Ele. Mentram Theory and Practical applications, McGraw-Hill, New York, 1972 Search PubMed.
- S. K. Jain, B. S. Garg, Y. K. Bhoon, D. L. Klayman and J. P. Scovill, Spectrochim. Acta, Part A, 1985, 41, 407–413 CrossRef.
- M. J. Bew, B. J. Hathaway and R. J. Faraday, J. Chem. Soc., Dalton Trans., 1972, 1229–1237 RSC.
- P. Zanello, Inorganic Electrochemistry: Theory, Practice and Applications, The Royal Society of Chemistry, U. K., 2003, pp. 110–113 Search PubMed.
- D. E. Richardson and H. Taube, Inorg. Chem., 1981, 20, 1278–1285 CrossRef CAS.
- V. Ranjedran, R. Viswanathan, M. Palaniandavar and M. Lakshminarayanan, J. Chem. Soc., Dalton Trans., 1992, 3563–3569 Search PubMed.
- C. Bethe, C. Beguin, I. G. Luneau, S. Hamman, C. Philouze, J. L. Pierre, F. Thomas and S. Torreli, Inorg. Chem., 2002, 41, 479–491 CrossRef.
- A. Neves, L. M. Rossi, A. J. Bortoluzzi, B. Szpoganicz, C. Wiezbicki and E. Schwingel, Inorg. Chem., 2002, 41, 1788–1794 CrossRef CAS PubMed.
- R. R. Gagne, C. A. Koval and T. J. Smith, J. Am. Chem. Soc., 1977, 99, 8367–8368 CrossRef CAS.
- R. R. Gagne, J. L. Allison, R. S. Gall and C. A. Koval, J. Am. Chem. Soc., 1977, 99, 7170–7178 CrossRef CAS PubMed.
- R. R. Gagne, C. A. Koval, T. J. Smith and M. C. Cimolino, J. Am. Chem. Soc., 1979, 101, 4571–4580 CrossRef CAS.
- F. Ammar and J. M. Saveant, J. Electroanal. Chem. Interfacial Electrochem., 1973, 47, 115–125 CrossRef CAS.
- C. Creutz, J. Am. Chem. Soc., 1973, 95, 1086–1094 CrossRef CAS.
- W. H. Morrison, S. Krogsrud and D. N. Hendrickson, Inorg. Chem., 1973, 12, 1998–2004 CrossRef CAS.
- R. R. Gagne, C. A. Keval, T. J. Smith and M. C. Cimolino, J. Am. Chem. Soc., 1079, 101, 4571–4580 CrossRef.
- V. H. Crawford, H. W. Richardson, J. R. Wasson, D. J. Hodgson and W. E. Hatfield, Inorg. Chem., 1976, 15, 2107–2110 CrossRef CAS.
- D. J. Hodgson, Prog. Inorg. Chem., 1975, 19, 173–241 CrossRef CAS.
- A. Asokan, B. Varghese and P. T. Manoharan, Inorg. Chem., 1999, 38, 4393–4399 CrossRef CAS PubMed.
- H. Handa, N. Koga and S. Kida, Bull. Chem. Soc. Jpn., 1988, 61, 3853–3857 CrossRef.
- M. Kodera, N. Terasako, T. Kita, Y. Tachi, K. Kano, M. Yamazaki, M. Koikawa and T. Tokii, Inorg. Chem., 1997, 36, 3861–3868 CrossRef CAS.
- L. Merz and W. Haase, J. Chem. Soc., Dalton Trans., 1980, 875–879 RSC.
- D. Black, A. J. Blake, K. P. Dancey, A. Harrison, M. McPartlin, S. Parsons, P. A. Tasker, G. Whittaker and M. Schröder, J. Chem. Soc., Dalton Trans., 1998, 3953–3960 RSC.
- Y. Xie, H. Jiang, A. Sun-Chi Chan, Q. Liu, X. Xu, C. Du and Y. Zhu, Inorg. Chim. Acta, 2002, 333, 138–143 CrossRef CAS.
- C. R. Choudhury, S. K. Dey, R. Karmakar, C. D. Wu, C. Z. Lu, M. Salah, E. Fallah and S. Mitra, New J. Chem., 2003, 27, 1360–1366 RSC.
- B. Bleaney and K. D. Bowers, Proc. R. Soc. London, A, 1952, 214, 451–465 CrossRef CAS.
- T. N. Doman, D. E. Williams, J. F. Banks, R. M. Buchanan, H. Chang, R. J. Webb and D. N. Hendrickson, Inorg. Chem., 1990, 29, 1058–1062 CrossRef CAS.
- Y. Nishida and S. Kida, Inorg. Chem., 1988, 27, 447–452 CrossRef CAS.
- N. Sundaraganesan, S. Kalaichelvan, C. Meganathan, B. Dominic Joshua and J. Cornard, Spectrochim. Acta, Part A, 2008, 71, 898–906 CrossRef CAS PubMed.
- S. Ramalingam, S. Periandy and S. Mohan, Spectrochim. Acta, Part A, 2010, 77, 73–81 CrossRef CAS PubMed.
- F. Zhang, Y. Tang, Z. Cao, W. Jing, Z. Wu and Y. Chen, Corros. Sci., 2012, 61, 1–9 CrossRef CAS.
- V. Barone and M. Cossi, J. Phys. Chem. A, 1998, 102, 1995–2001 CrossRef CAS.
- N. M. O'Boyle, A. L. Tenderholt and K. M. Langner, J. Comput. Chem., 2008, 29, 839–845 CrossRef PubMed.
- R. Dennington, T. Keith and J. Millam, GaussView, Version 5, Semichem Inc., Shawnee Mission KS, 2009 Search PubMed.
- Y. Lu, N. Yeung, N. Sieracki and N. M. Marshall, Nature, 2009, 460, 855–862 CrossRef CAS PubMed.
- N. A. Rey, A. Neves, A. J. Bortoluzzi, C. T. Pich and H. Terenzi, Inorg. Chem., 2007, 46, 348–350 CrossRef CAS PubMed.
- J. Reim and B. J. Krebs, J. Chem. Soc., Dalton Trans., 1997, 3793–3804 RSC.
- A. Banerjee, S. Sarkar, D. Chopra, E. Colacio and K. K. Rajak, Inorg. Chem., 2008, 47, 4023–4031 CrossRef CAS PubMed.
- U. Weser, L. M. Schubotz and E. Lengfelder, J. Mol. Catal., 1981, 13, 249–261 CrossRef CAS.
- P. J. Hart, M. M. Balbirnie, N. L. Ogigara, A. M. Nersissian, M. S. Weiss, J. S. Valentine and D. Eisenberg, Biochemistry, 1999, 38, 2167–2178 CrossRef CAS PubMed.
- I. Bertine, L. Banci, M. Piccioli and C. Luchinat, Coord. Chem. Rev., 1990, 100, 67–103 CrossRef.
- S. Durot, C. Policar, F. Cisnetti, F. Lambert, J. P. Renault, G. Pelosi, G. Blain, H. Korri-Youssoufi and J. P. Mahy, Eur. J. Inorg. Chem., 2005, 3513–3523 CrossRef CAS.
- Z. R. Liao, X. F. Zheng, B. S. Luo, L. R. Shen, D. F. Li, H. L. Liu and W. Zhao, Polyhedron, 2001, 20, 2813–2821 CrossRef CAS.
Footnote |
| † Electronic supplementary information (ESI) available. CCDC 1496447 and 1496455. For ESI and crystallographic data in CIF or other electronic format see DOI: 10.1039/c6ra20367a |
|
| This journal is © The Royal Society of Chemistry 2016 |
Click here to see how this site uses Cookies. View our privacy policy here. 


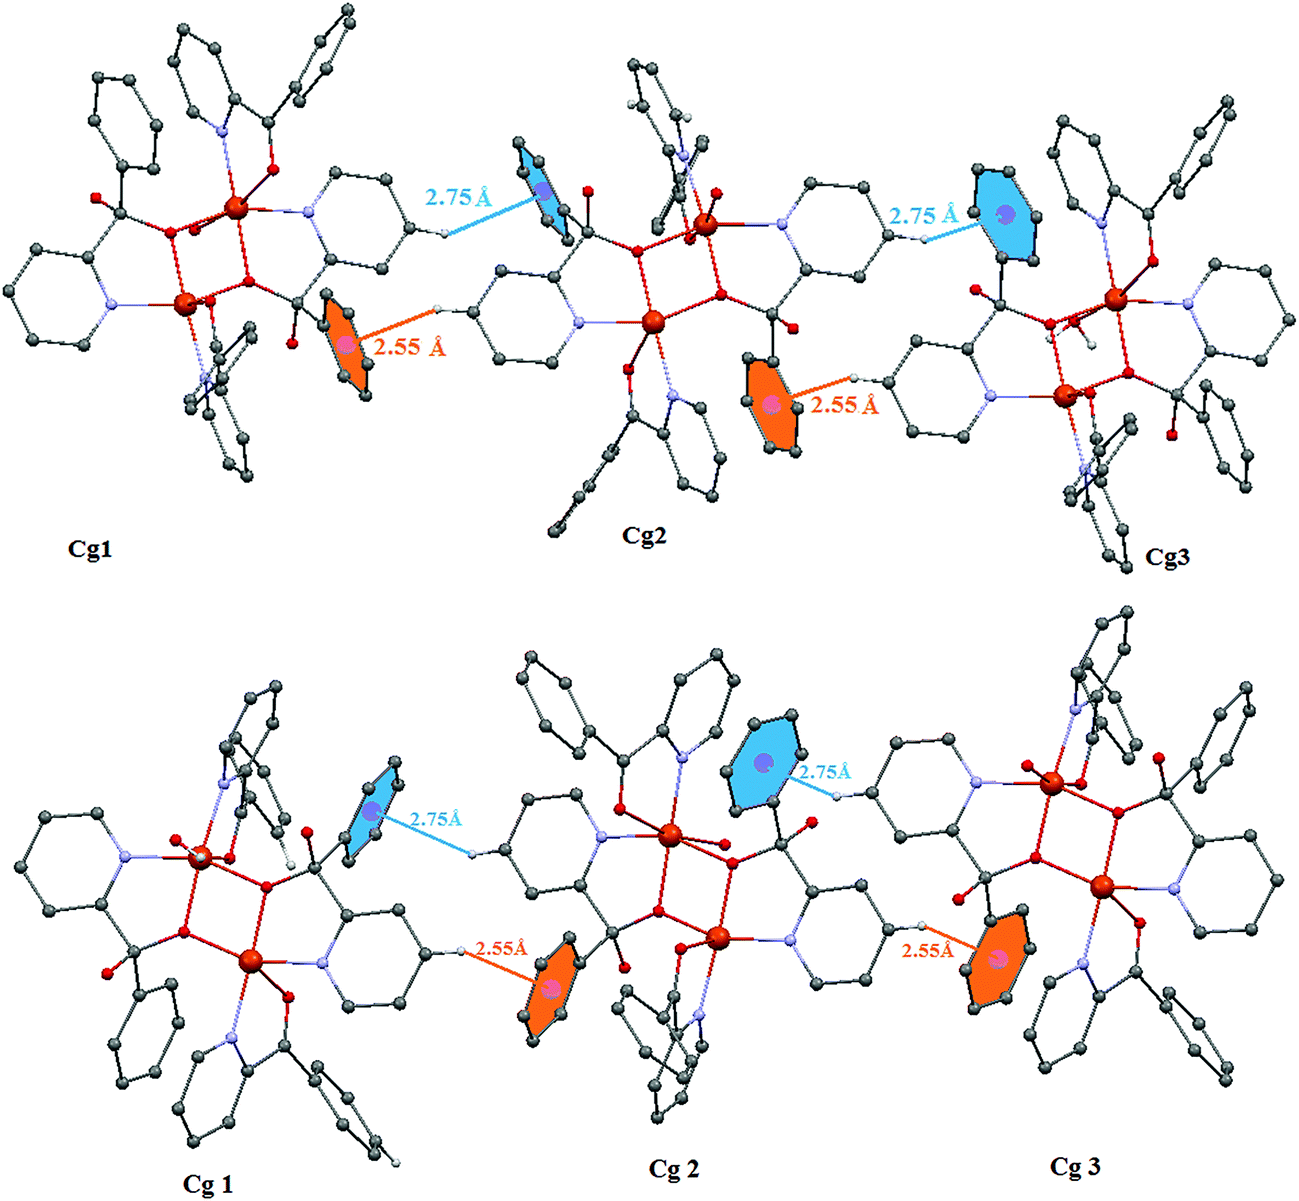


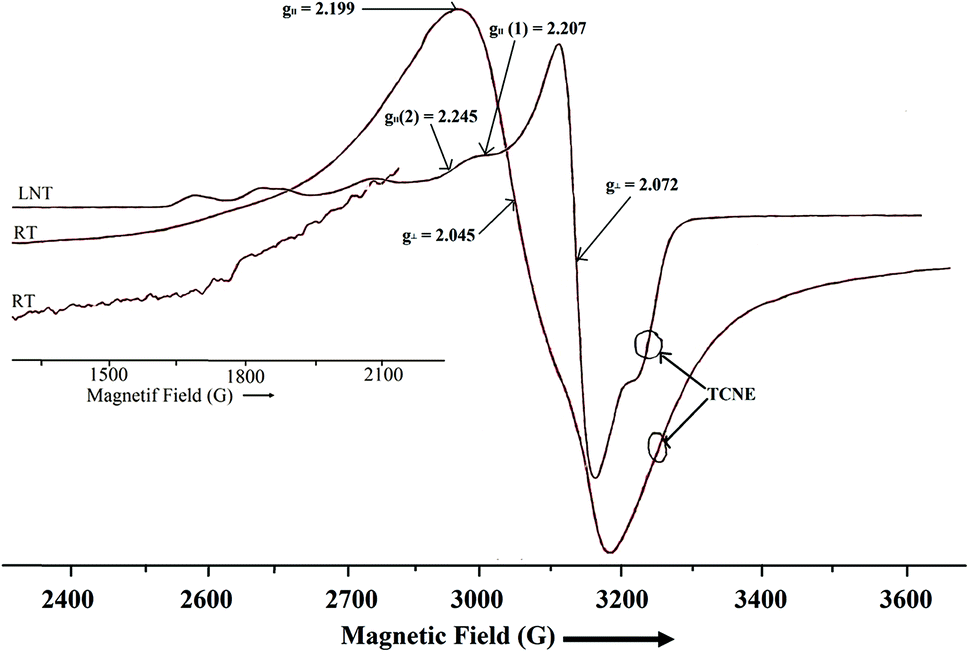
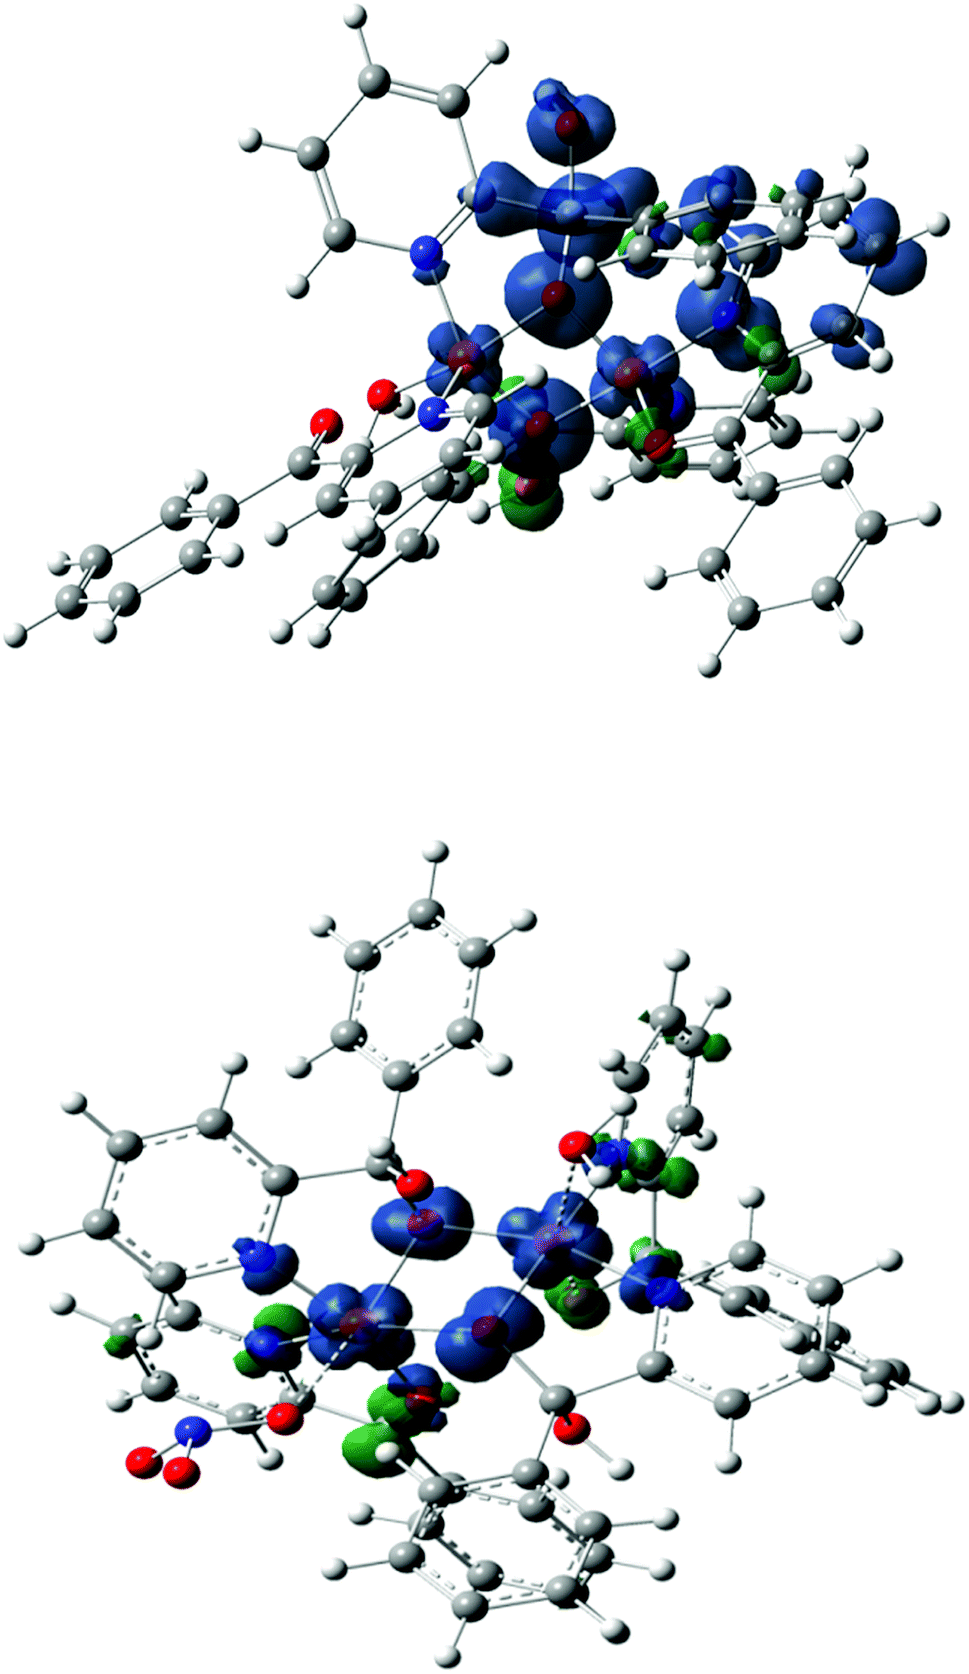
 unit and are different from that of a mononuclear copper(II) complexes.99 The g∥ regions of the spectra of both complexes between ∼2500 and 3050 G are very different to interpret, due to presence of inequivalent two copper nuclei as confirmed by single crystal X-ray analysis (Fig. 1 and 2). For equivalent copper nuclei, the g∥ region should contain four evenly spaced lines.100 The G values of the present complexes (3.2 ± 0.3 < 4.0) indicate a dx2−y2 ground state having a weak exchange coupling which may be propagated through
  core.101,102 Since the spectrum of 1 is nearly similar to that of 2, indicating that these complexes are isostructural and show similar magnetic feature.